
Welcome to 2021. As we kick off a new year, we begin with the S&P 500 trading at historical extremes. It is essential to have some perspective to set reasonable expectations for future returns and quantify the “risk” of something going wrong.
As we discussed with our RIAPRO.NET subscribers yesterday, the real risk to the market in 2021 is over-confidence.
“Currently, Wall Street analysts are wildly exuberant on expectations of explosive economic growth, rising interest rates, and inflation. The problem with those expectations is that in an economy that is $85 Trillion in debt, higher rates and inflation are a ‘death knell’ to economic growth.
Yes, while the Fed may come to the rescue with more QE, with markets already trading at 36x times earnings it is becoming increasingly difficult to justify overpaying for earnings. Eventually, corporate earnings are going to have to markedly improve, or prices will revert.”
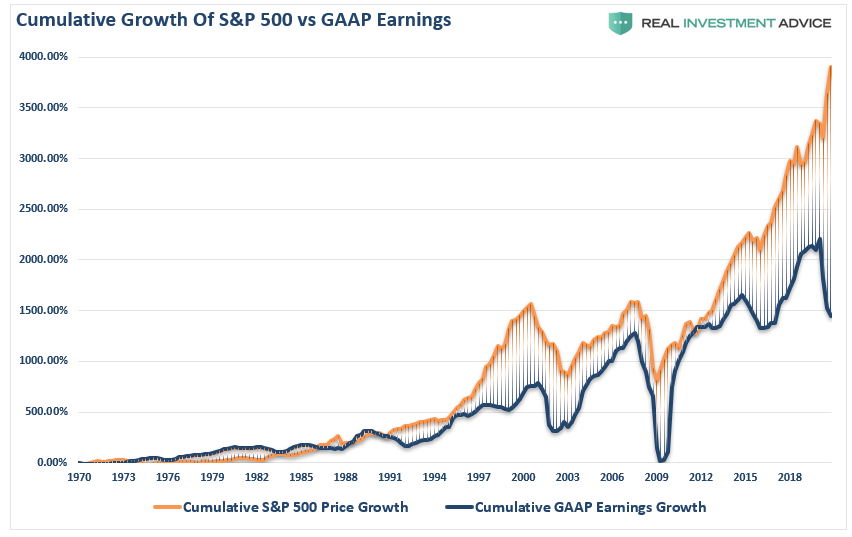
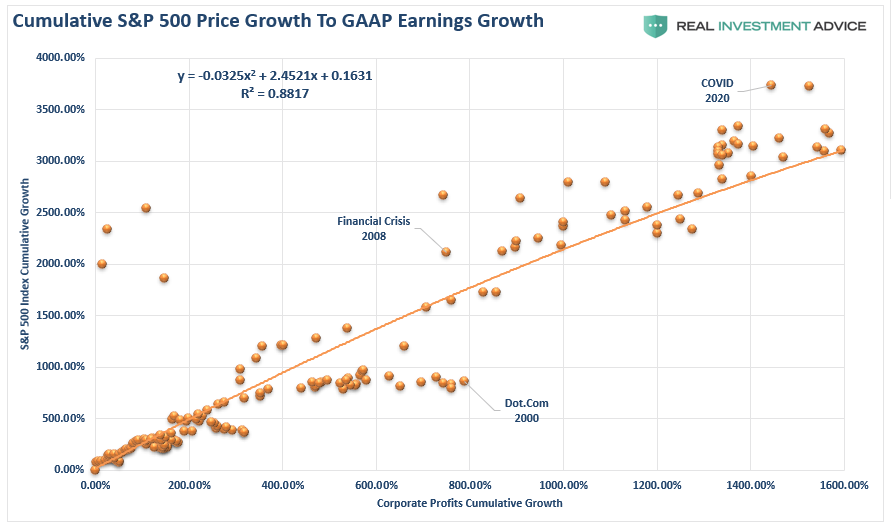
There is a high long-term correlation between the index and earnings of 88%. As shown, extreme deviations from the long-term correlation have always preceded short- to intermediate-term corrections.
Short-Term It’s A Coin Toss
In the short-term, which equates from a few days to a few weeks, markets are sentiment-driven. As we showed in “2020-A Year Of Speculative Mania,” investor sentiment is just about as “bullish” as it can get.
“The chart below shows the combined average of institutional and individual investor valuation confidence subtracted from future returns confidence. When the reading is positive, the confidence the market will be higher one year from now is more elevated than the confidence in the market’s valuation. The opposite is the case when the reading is in negative territory.
The key takeaway is that investors think simultaneously, the market is over-valued but likely to keep climbing.”
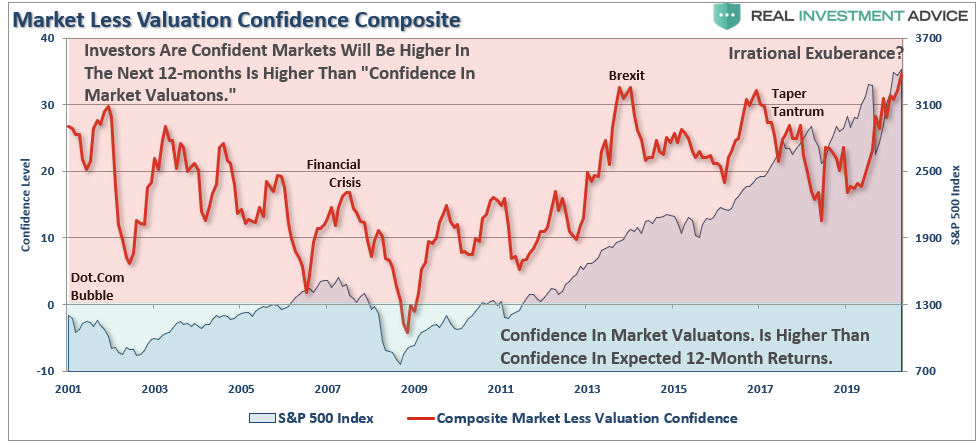
“Such is the same phenomenon famously described by former Fed Chair Alan Greenspan in a December 1996 speech on ‘Irrational Exuberance.'”
However, it is that “sentiment,” or more commonly known as the “Fear of Missing Out,” that can continue to drive prices higher in the short-term.
As shown, the S&P index is currently overbought and trading significantly above its 200-dma. However, with the Bollinger Bands narrowing, the market could trade higher over the next month.
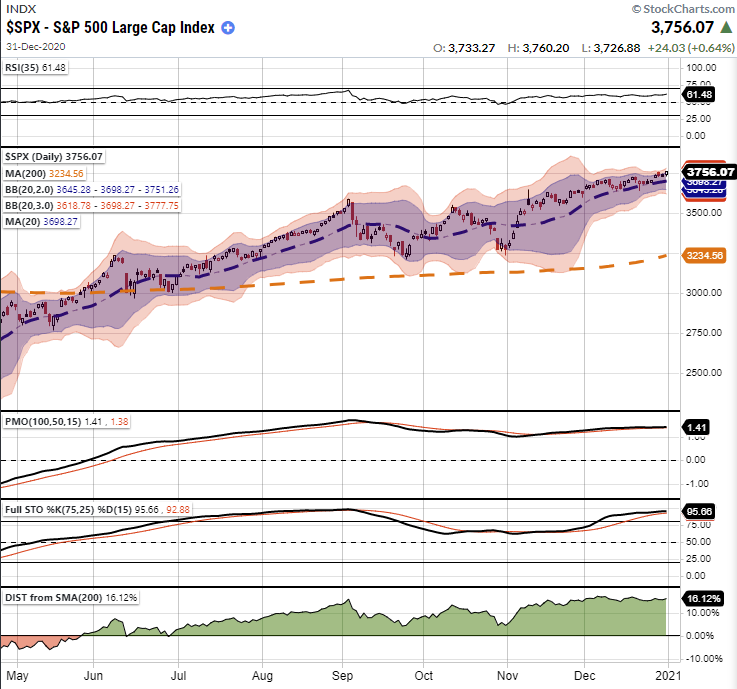
Such a move higher would align with our expectations of the current bullish trade to continue into January.
However, with the more extreme deviation from the 225-day moving average, somewhere between February and March, we could see a correction take hold. Such would be akin to what we saw during the first half of the last 3-years.
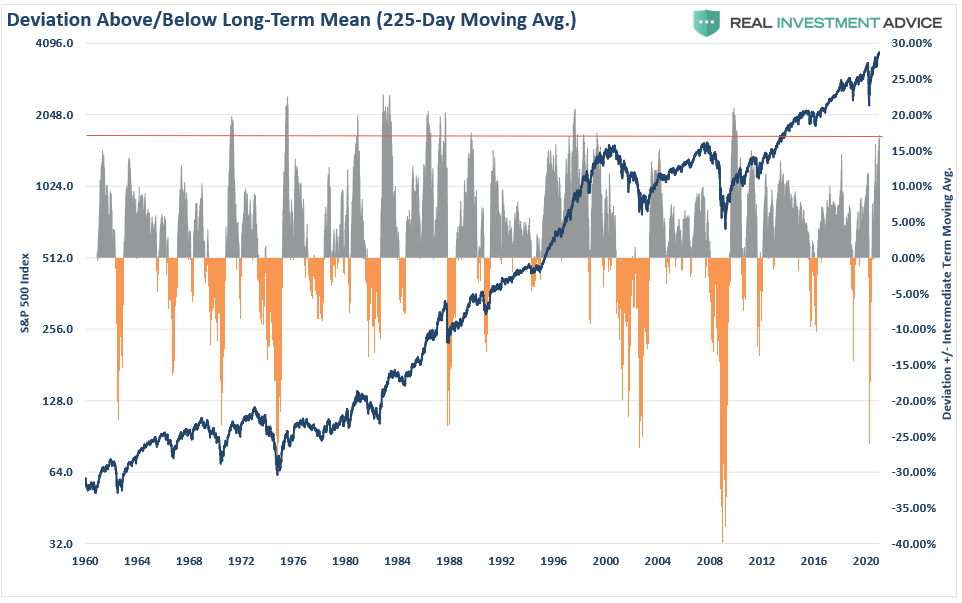
Intermediate-Term Is Worrisome
For investors, the outlook becomes much more troubling as we look further out.
The market is trading 3-standard deviations above its long-term mean and is incredibly overbought on a weekly basis. At the same time, there is a negative divergence in relative strength (RSI), which is also a cause of concern.
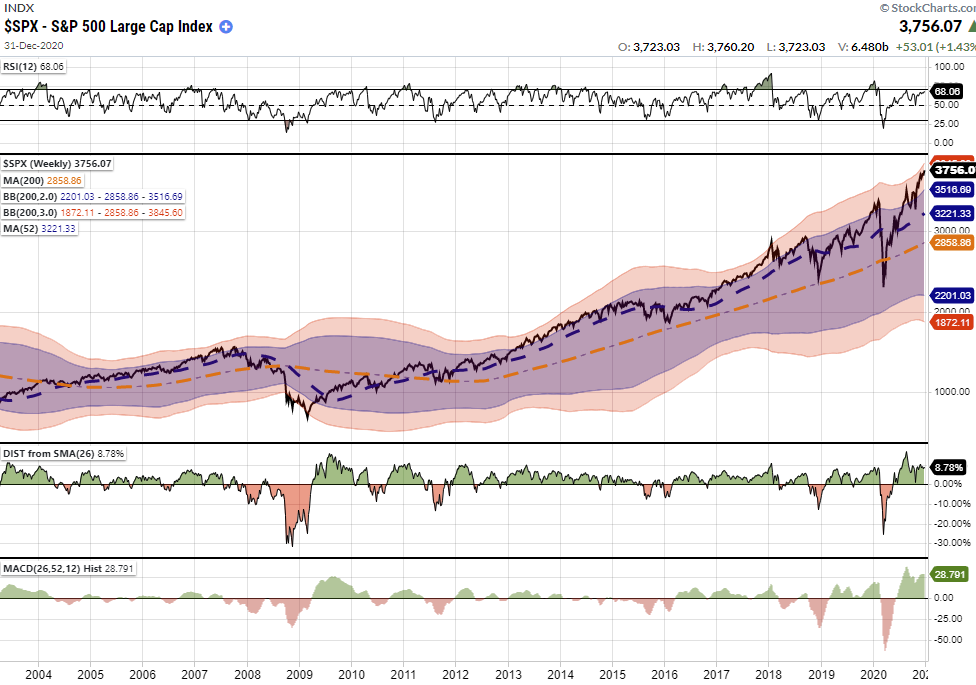
Since weekly charts are slower moving, such does not mean the markets will crash immediately. Long-term charts indicate that price volatility will likely be higher in the months ahead, and investors should monitor their risk accordingly. While momentum-driven markets can remain irrational much longer than logic would predict, eventually, a reversion has always occurred.
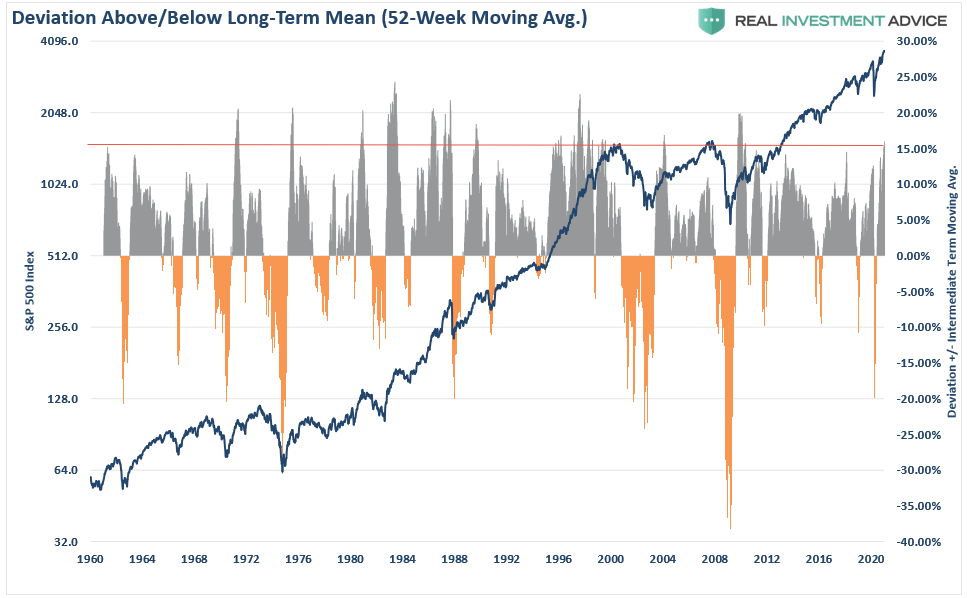
The chart below shows the price deviation from the one-year weekly moving average. Given the deviation is above 15%, price corrections have always been nearby. (Such does not mean a market crash. A correction of 10-20% is well within norms.)
Long-Term View Is Bearish
The monthly chart of the S&P 500 is likewise just as problematic. Again, long-term charts predict long-term outcomes and are NOT SUITABLE for trading portfolios short-term. As shown, the deviation from long-term monthly means and negative divergences in relative strength has previously been warning signs for more significant corrections.
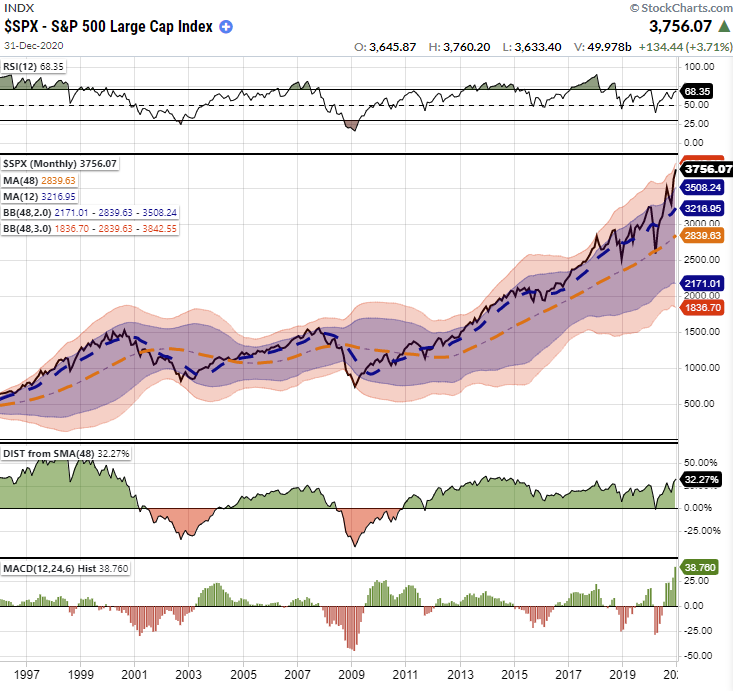
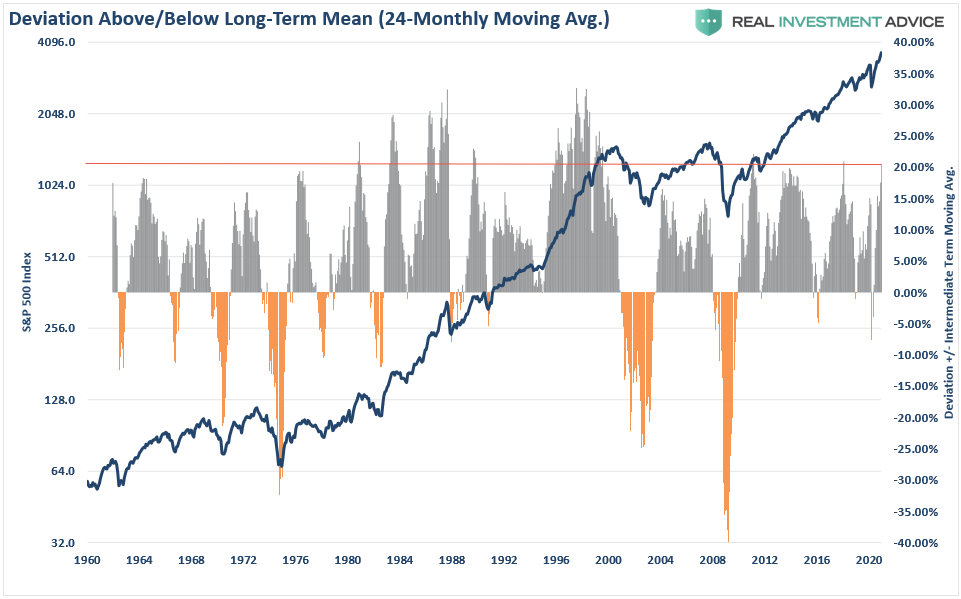
We see the same problematic setup when viewing the market’s current deviation from its 2-year monthly moving average. The current deviation has only occurred 5-times since 1960 and has always led to a correction over the next several months. (Some worse than others.)
However, since 1900, using QUARTERLY analysis, the picture is bearish for returns over the next decade. The research below aligns valuation, relative strength, and deviations into one chart.
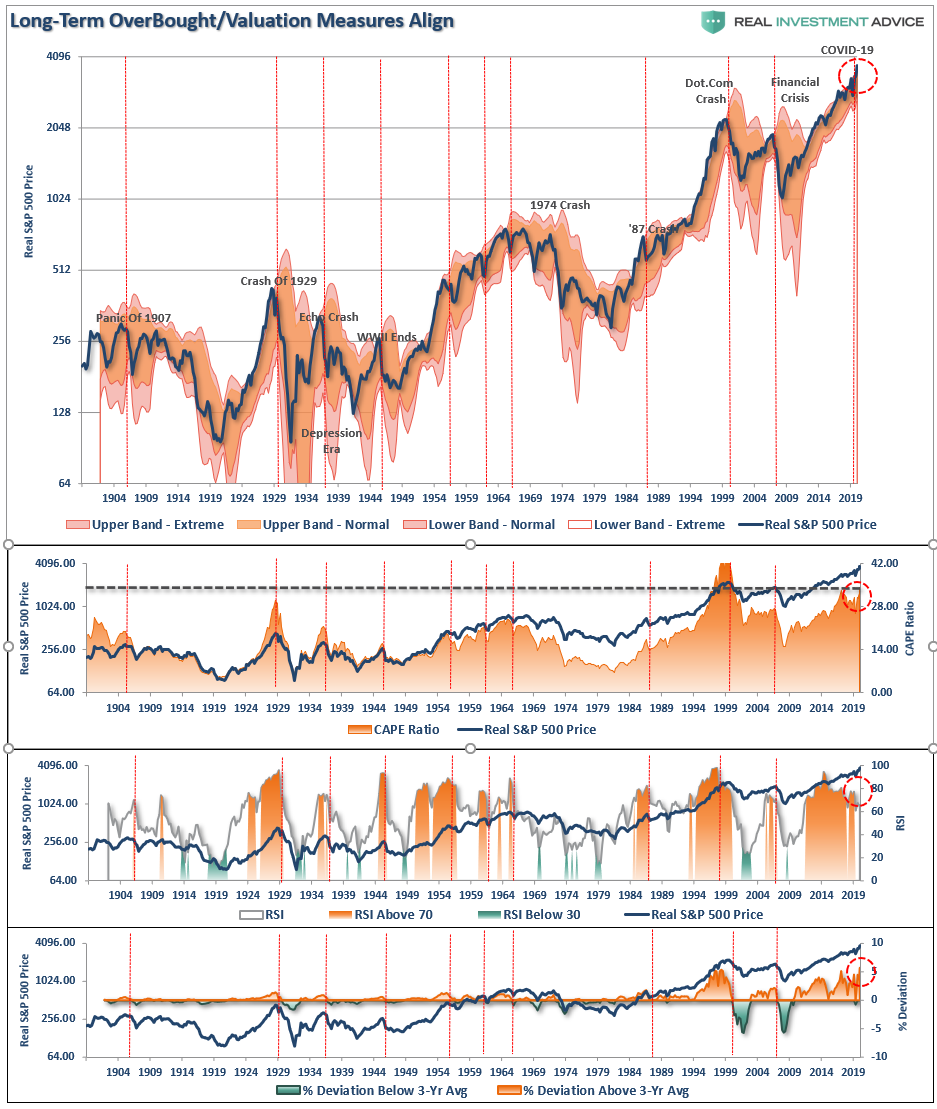
There is little to suggest investors who are currently extremely “long equity risk” in portfolios now won’t eventually suffer a more severe “mean-reverting event.”
While valuations and long-term deviations suggest problems for the markets ahead, such can remain the case for quite some time. It is this long lead time that always leads investors to believe “this time is different.”
Because of the time required for long-term data to revert, monthly and quarterly data is more useful as a guide to managing expectations, allocations, and long-term exposures. In other words, this data is not as valuable as a short-term market-timing tool.
What Could Cause A Correction In 2021?
Lots of things.
The market is currently priced for perfection betting on explosive economic growth, a falling dollar, interest rates remaining low, consumer spending surging sharply, and inflation remaining muted. The reality is that none of those things will likely turn out to be the case.
The one thing that always trips of the market is the one thing that no one is paying attention to. For me, that risk lies with the US Dollar. As noted previously, everyone expects the dollar to continue to decline, and the falling dollar has been the tailwind for the emerging market, commodity, and equity-risk trade. Whatever causes the dollar to reverse will likely bring the equity market down with it.
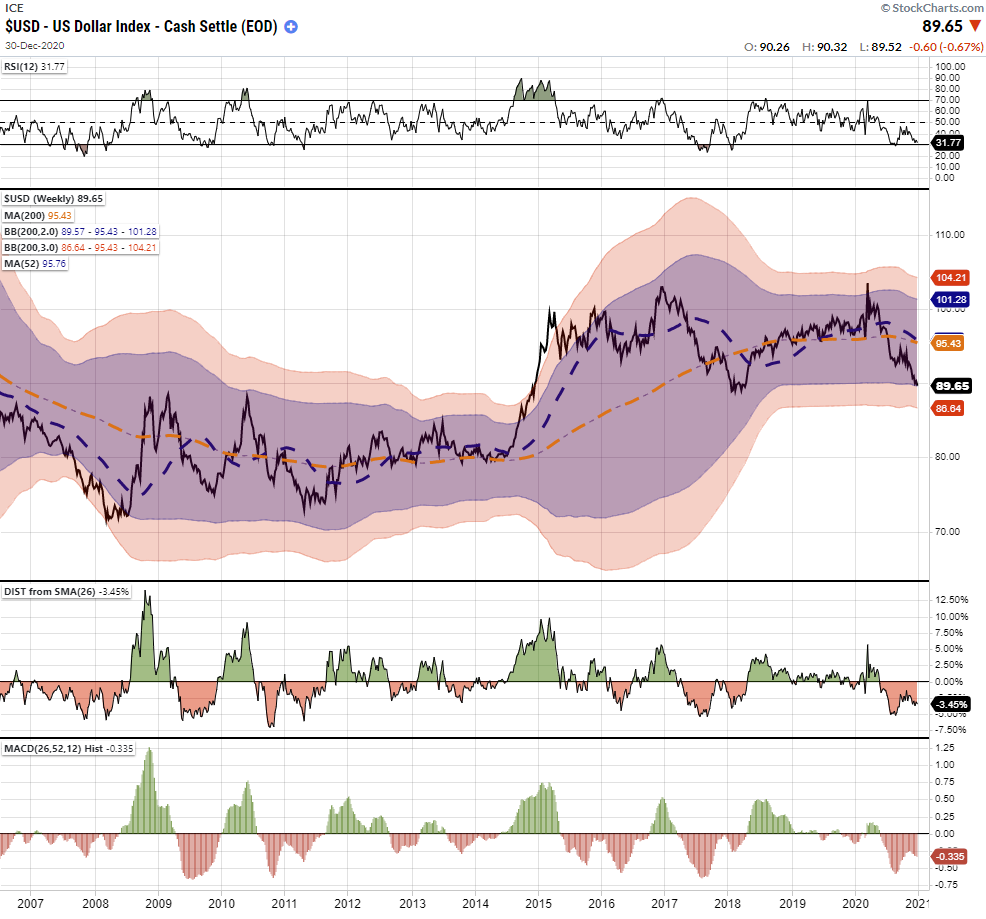
That is the risk we are paying attention to right now.
What This Means And Doesn’t Mean
Let me repeat the following just so there is no confusion.
“What this analysis DOES NOT mean is that you should ‘sell everything’ and ‘hide in cash.’”
As always, long-term portfolio management is about managing “risk” by “tweaking” things over time.
If you have a “so so” hand at a poker table, you bet less or fold.
It doesn’t mean you get up and leave the table altogether.
What this analysis does suppest is that we should use rallies to rebalance portfolios.
- Trim Winning Positions back to their original portfolio weightings. (ie. Take profits)
- Sell Those Positions That Aren’t Working. If they don’t rally with the market during a bounce, they will decline more when the market sells off again.
- Move Trailing Stop Losses Up to new levels.
- Review Your Portfolio Allocation Relative To Your Risk Tolerance. If you have an aggressive allocation to equities at this point of the market cycle, you may want to try and recall how you felt during 2008. Raise cash levels and increase fixed income accordingly to reduce relative market exposure.
Could I be wrong? Absolutely. But what if the indicators are warning us of something more significant?
What’s worse:
- Missing out temporarily on the initial stages of a longer-term advance, or;
- Spending time getting back to even, which is not the same as making money.
Conclusion
For most investors, the recent rally has been a recovery of what was lost last year. In other words, while investors have made no return over the previous eighteen months, they have lost 18-months of their retirement saving time horizon.
Yes, if the market corrects and reduces some of its current overbought condition without violating supports and maintaining the current bullish trend, we will miss some of the initial upside. However, we can quickly realign portfolios to participate from that point with a much higher reward to risk ratio than what currently exists.
However, if I am right, the preservation of capital during an ensuing market decline will provide a permanent portfolio advantage in the future. The real power of compounding is not in “the winning” but in the “not losing.”
As I noted recently in our blog on trading rules:
“Opportunities are made up far easier than lost capital.” – Todd Harrison

