In this past weekend’s newsletter, we stated the market was likely to bounce due to the short-term oversold condition which existed following Friday’s rout. To wit:
“With a ‘sell signal’ clearly triggered (lower panel), it suggests, on a short-term basis, we are likely to see a ‘tradeable bounce.’ However, until the signal reverses, any short-term bounce should probably be ‘sold into.’
Make no mistake, there is currently downside risk below the 50-dma to both the 38.2% and 50% Fibonacci retracement levels. From recent peaks, such a correction would entail a 5-8% decline, which is well within the normal range of a market correction within an ongoing bullish trend.”
Chart updated through Monday’s close.
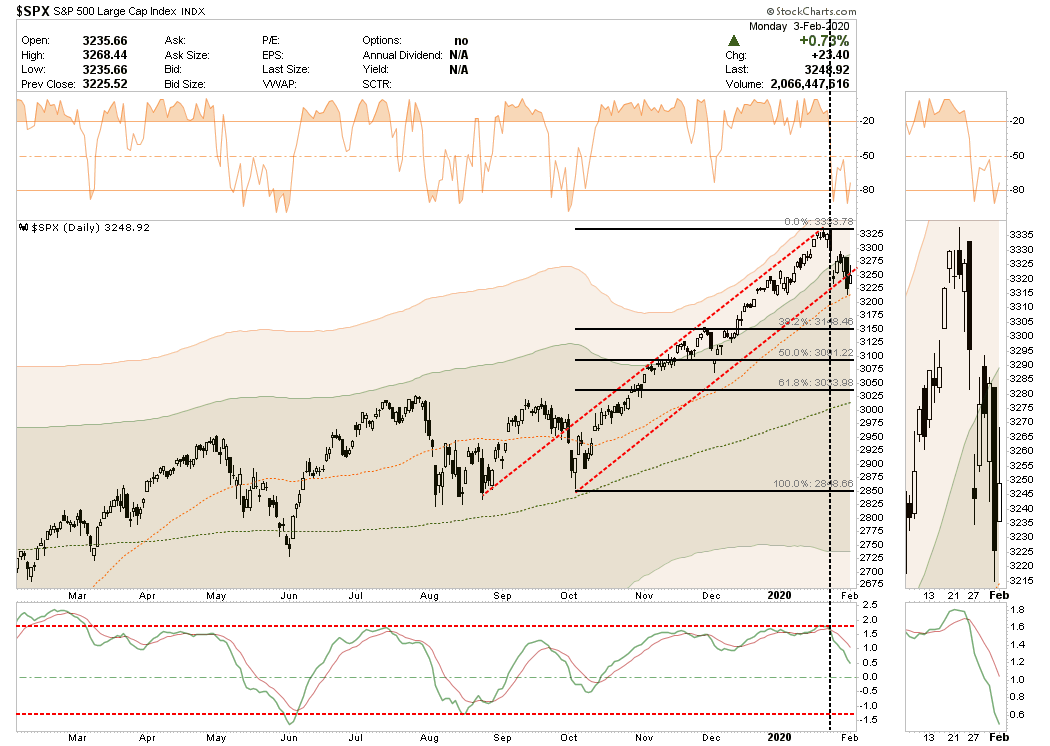
The market failed at the bottom of the broken trend line yesterday, which suggests this “short-term” bounce is likely an opportunity to rebalance risks into.

With the fallout of the “coronavirus” being written off very quickly, under the assumption the outcome will be equivalent to the SARS epidemic in 2003, such is likely a mistake. As I wrote previously:
“Following a nearly 50% decline in asset prices, a mean-reversion in valuations, and an economic recession ending, the impact of the SARS virus was negligible given the bulk of the ‘risk’ was already removed from asset prices and economic growth. Today’s economic environment could not be more opposed.”

With global growth already slow, and the U.S. dragging its feet along at roughly 2% annual growth, there isn’t much room to absorb the impact of an event that potentially curtails consumption.
Given that China, which is roughly 4x the size of global GDP today versus 2003, it occupies a central place in many supply chains used by other manufacturing countries, including pharmaceuticals, and is a voracious buyer of raw materials and other commodities, including oil, natural gas, and soybeans. That means that any economic hiccups for China this year, coming on the heels of its worst economic performance in 30 years, will have a bigger impact on the rest of the world than during past crises.
The was a point made by Mohamed El-Erian, on Monday, who stated the outbreak was going to take a major toll on the Chinese economy and hurt global growth.
“For a long time I thought the market sentiment was so strong that we could overcome a mounting list of economic uncertainty. But the coronavirus is different. It is big. It’s going to paralyze China. It’s going to cascade throughout the global economy. Importantly, it cannot be countered by central bank policy.
Investors ‘need to decide if they want to opt for more of the same, by continuing to implement an investment playbook that has served them well, or if they want to treat the viral outbreak for what it is — a big economic shock that could derail global growth and shake markets out of their ‘buy-the-dip’ conditioning.” – Mohamed El-Erian
On Monday, the reflexive bounce was primarily supported by “market chatter” the Fed may be forced to extend their current “Not QE” through June, and/or lower rates. El-Erian is likely correct that this is not an event “monetary band-aids” can fix.
Furthermore, his comments run similar to our own in that the long-running play of dismissing downbeat fundamentals on expectations central banks will be able to ride to the rescue could prove misguided in the current environment. What the current “bullish bias” is potentially missing is that while the effects of the deadly outbreak are substantial in China, and will cascade not only through the world’s second-largest economy, it will also slow global growth. A weaker China is not only a problem for Europe, but also for the U.S. where exports account for about 40% of corporate profits.
Importantly, the multi-year gap between elevated asset prices and weaker economic conditions is becoming increasingly unsustainable. This is shown in the chart below:
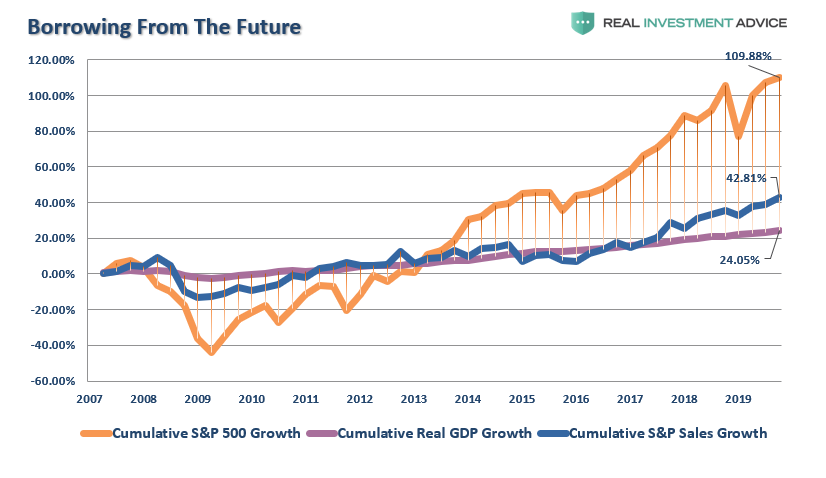
The problem with pulling forward future consumption, is that it leaves a void which eventually must be filled, which requires more interventions to do so. Ultimately, that void becomes too vast.

So Goes January…
January was a complete bust. After rocketing higher on “Fed Fuel,” the entire month’s gains were wiped out by January 31st.
It reminded me of January 2018, as the S&P 500 was surging higher following the passage of “tax cuts.” The markets were extrapolating earnings estimates to ridiculous levels in the hopes tax cuts would lead to an earnings and economic recovery. As I wrote then, such was never going to happen:
“The same is true for the myth that tax cuts lead to higher wages. Again, as with economic growth, there is no evidence that cutting taxes increases wage growth for average Americans. This is particularly the case currently as companies are sourcing every accounting gimmick, share repurchase or productivity increasing enhancement possible to increase profit growth.
Not surprisingly, our guess that corporations would utilize the benefits of ‘tax cuts’ to boost bottom line earnings rather than increase wages has turned out to be true. As noted by Axios, in just the first two months of this year companies have already announced over $173 BILLION in stock buybacks.”
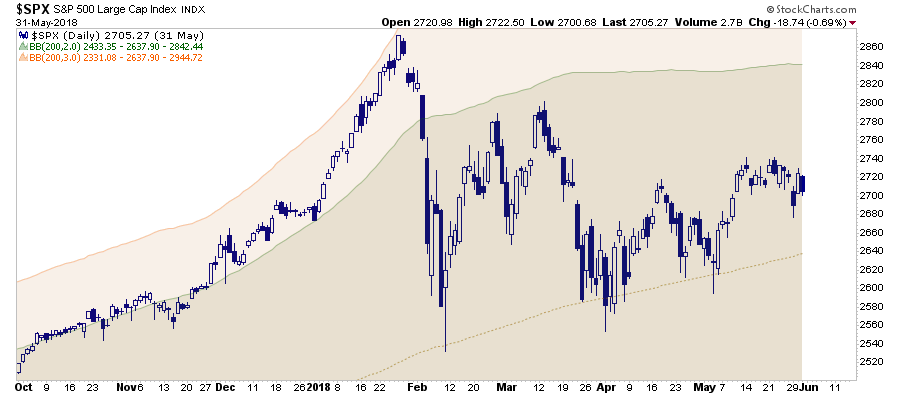
The chart below shows the run up from October to the January peak in 2018. That rally pushed the S&P 500 to 3-standard deviations above the 200-dma, just as the end of the month was approaching. Then, in just a few short days, the entire gain of January evaporated.
The chart below is the S&P 500 from October 2019 to present. Again, we see the market pushing into 3-standard deviation territory, then wiping out the entire gain of January in just a few days.

While I am not suggesting the market will test the 200-dma as it did in 2018, it is a possibility, particularly if the “coronavirus” worsens, or economic impacts begin to become visible.
However, the reversal of the January gain to a loss does bring up the old Wall Street axiom:
“So goes January…So goes the year.”
The January barometer was devised by Yale Hirsch in 1972 and has only registered ten major errors since 1950, for an 85.7% accuracy ratio. As noted by StockTraders Almanac:
“Of the ten major errors Vietnam affected 1966 and 1968. 1982 saw the start of a major bull market in August. Two January rate cuts and 9/11 affected 2001. The market in January 2003 was held down by the anticipation of military action in Iraq. The second worst bear market since 1900 ended in March of 2009, and Federal Reserve intervention influenced 2010 and 2014. In 2016, DJIA slipped into an official Ned Davis bear market in January. Including the eight flat years yields a .743 batting average.”
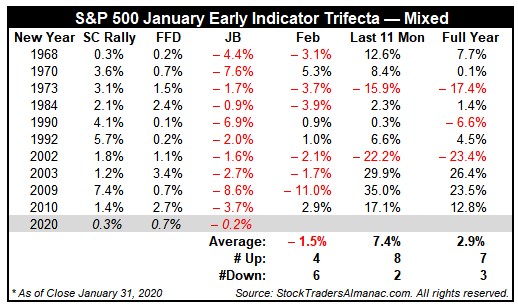
“This year’s combination of a positive Santa Claus Rally and First Five Days with a full-month January loss has only occurred 11-times (including this year) since 1950. In the previous 10-occurrences, the S&P 500 was down six times in February with an average loss of 1.5%. However, over the remaining 11 months of the year, S&P 500 advanced 80% of the time with an average gain of 7.4%. Full-year performance was positive 70% of the time, but with an average gain of 2.9%.”
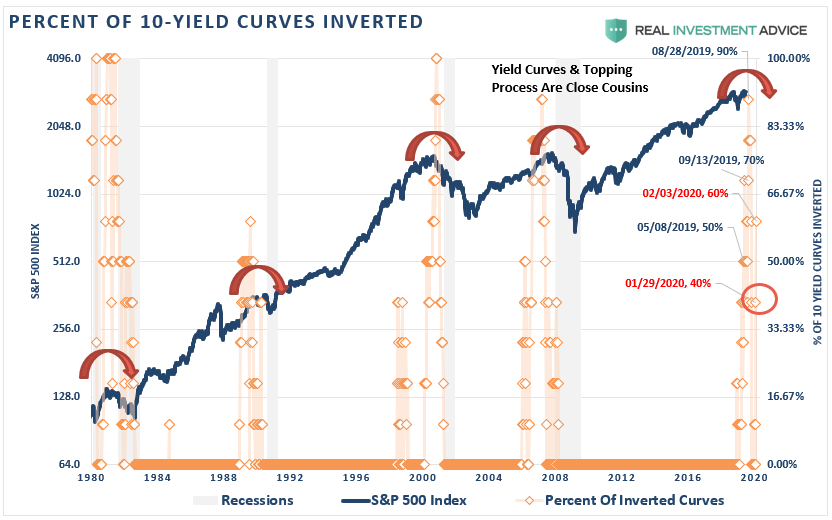
While there are many other factors that could drive the market higher this year, from the election to more Central Bank interventions, there is a growing chorus of indications which suggest we are nearing the end of current cycle. With negative yielding debt back on the rise, numerous yield spreads re-inverting, slower economic growth, and weaker earnings, the ability to sustain high valuations is going to become more challenging.

Don’t Forget The Super Bowl
The Kansas City Chiefs won “Super Bowl LIV” in a stunning fourth-quarter rally to beat the San Francisco 49ers, which triggered the “Super Bowl Indicator” suggesting a weaker market. (This is a purely coincident indicator, but, given it was the Chiefs’ first Super Bowl championship in 50 years, maybe there is something about odd things happening when everyone else thinks they won’t.)
If you aren’t familiar with the indicator, it says that if the winning team of National Football League’s (NFL) championship game is from the National Football Conference (NFC), then stocks will have a bull market that year. If a team from the American Football Conference (AFC) wins, then it will be a bear market.
The Chiefs are from the AFC, meaning the indicator predicts a bear market this year and the predictor has been right 40 out of 53 games, a 75% success rate. While the last four years have been wrong, statistics suggest odds have increased for the indicator to be correct this year.
Here’s a breakdown of the 20 Super Bowl winners, of the last 53 Super Bowls, and how the S&P 500 has done following their victories:
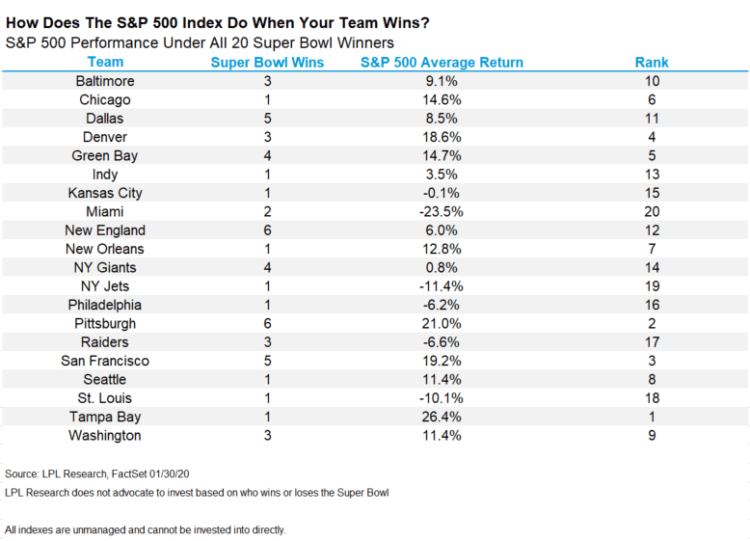
While investors should never use a “coincident” indicator such as this to manage money, it is interesting nonetheless.
Portfolio Positioning
Yesterday, as we discussed with our RIAPro Subscribers (30-Day Risk-Free Trial) we slightly reduced our holdings in Utilities and Real Estate to raise some cash ahead of what we suspect will be a fairly short-lived rally. The goal is to use a pullback to rebalance exposures and look for a more “washed out” level to take on some “opportunistic” holdings.

One such area where there is a tremendous amount of “negative sentiment” is in the energy sector. While it isn’t time to start adding exposure, we may be getting a decent “trading setup” here soon. Also, after previously reducing our holdings in some of our Technology, Healthcare, and Communications holdings, we may get the opportunity to rebuild our long-term core holdings at better risk/reward levels.
While this year could indeed turn out to be a negative year, it doesn’t mean there won’t be some decent trading opportunities along the way. This is portfolio management.
However, make no mistake that we are nearing the end of an exceedingly long bull market cycle, and the eventual “reversion to the mean” will be a brutal event.
While it is easy to dismiss such an outcome under the guise of “this time is different because of the Fed,” every single “bear market” previously came on the heels of similar beliefs. In 1987, it was “Portfolio Insurance.” In 2000, it was the “Internet.” In 2007, it was the “Goldilocks Economy.”
Today will not be different, but the eventual outcome will be the same.

