
Despite, or actually because of, the recent market turmoil, many large banks and brokers reported better-than-expected earnings. Market volatility provided a nice boost to trading revenue, which helped offset weakness in other business lines. Goldman Sachs, reporting earnings on Monday, said their equity trading revenue rose 27% from the prior quarter. JP Morgan and Morgan Stanley reported a 21% and 17% boost to trading revenue, respectively.
The benefits of wider bid-offer spreads and more trading volume are higher trading revenues in larger banks and, thus, a more diversified income statement than smaller banks. At times, as first-quarter earnings highlight, the revenue boost from volatility was a helpful revenue hedge against poor market conditions and weaker activity in more traditional banking. For instance, Goldman Sachs reported its highest quarterly revenue ever despite investment banking revenue falling 8% compared to last year.
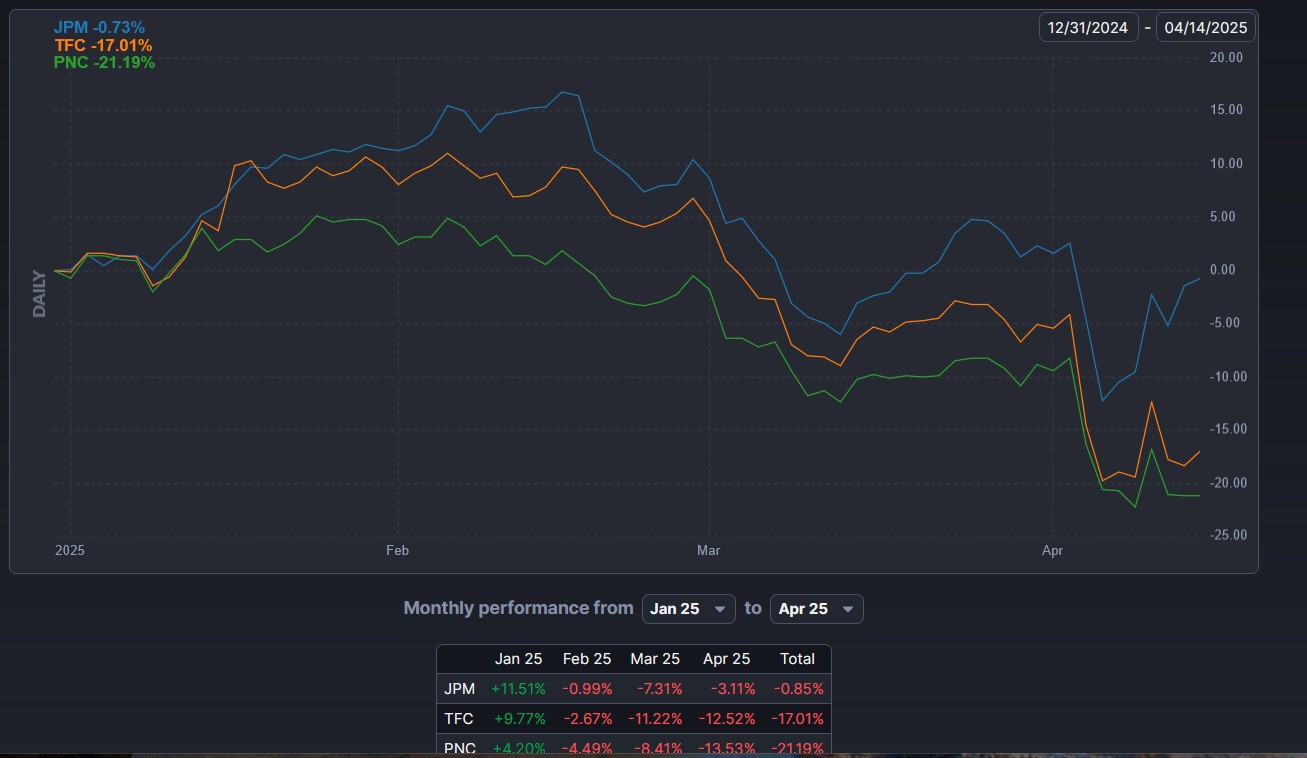
The graph below, courtesy of FinViz, shows that the earnings boost due to market volatility has helped JPM decently outperform smaller regional banks like Truist and PNC. However, it’s not all gravy for the larger banks. The large banks and brokers tend to provide more capital for hedge funds. Therefore, they expose themselves to significant risks if hedge funds fail due to extreme volatility.
What To Watch Today
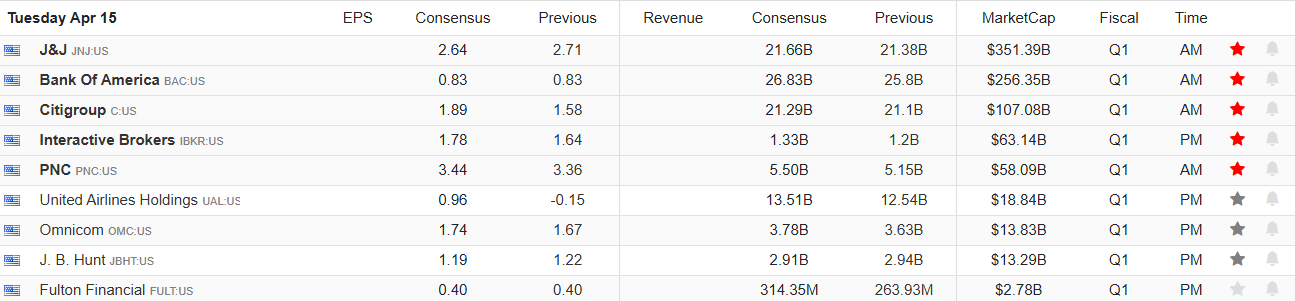
Earnings
Economy

Market Trading Update
As discussed yesterday, the correction process is still well entrenched, so this is not the time to try to be a hero. Risk management remains the key for now, as many investors were “trapped” in the recent decline and are looking for an opportunity to exit. However, with that said, Sentimentrader.com had a great note out yesterday regarding the recent “risk-off” move in the markets.
“The Sentimentrader Risk On/Risk Off indicator combines 21 of our best measures of investor mood to objectively designate overall investor behavior as “risk on” (i.e., investors are aggressively buying) or “risk off” (i.e., investors are aggressively selling).”
Here is a sample of some of the indicators. As you will notice, all of them are trading at rather extreme “risk-off“ levels.

When those 21 indicators are combined into a single indicator, it gives readings of when markets are trading at more extreme bullish or bearish levels.
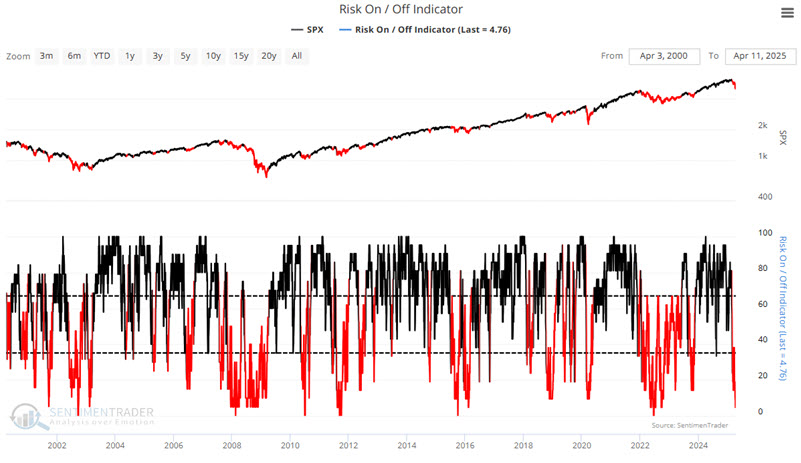
As we have discussed previously, extremes in either direction generally indicate when market turns tend to occur. As Sentimentrader.com notes:
“Historically, declines in the Risk On/Risk Off indicator below 35 have been associated with volatile periods in the market involving significant declines. “Playing defense” during these periods can, at times, help investors avoid some of the financial and psychological pain of riding significant drawdowns to the bottom fully invested. However, this indicator has gone so far to the unfavorable extreme that it might be “so bad that it’s good.”
Historically, when indicators reach such extreme levels, most of the previous advances or declines are likely to be complete. However, it does not mean that markets can not go even further into extremes before reaching a bottom. As Sentimentrader.com concluded:
“The good news is that – on a standalone basis – the signal and performance highlighted above make a compelling favorable case for stocks. The bad news is that we would never advise basing portfolio decisions on any one indicator or indicator signal. The proper message from the results above is NOT “All clear for stocks, and happy days are here again.” The proper message is “Ignore the bearish noise, manage risk, and keep an open mind to the potential for better results moving forward – but especially manage risk.”
We agree.

High Volatility Bodes Well For Markets
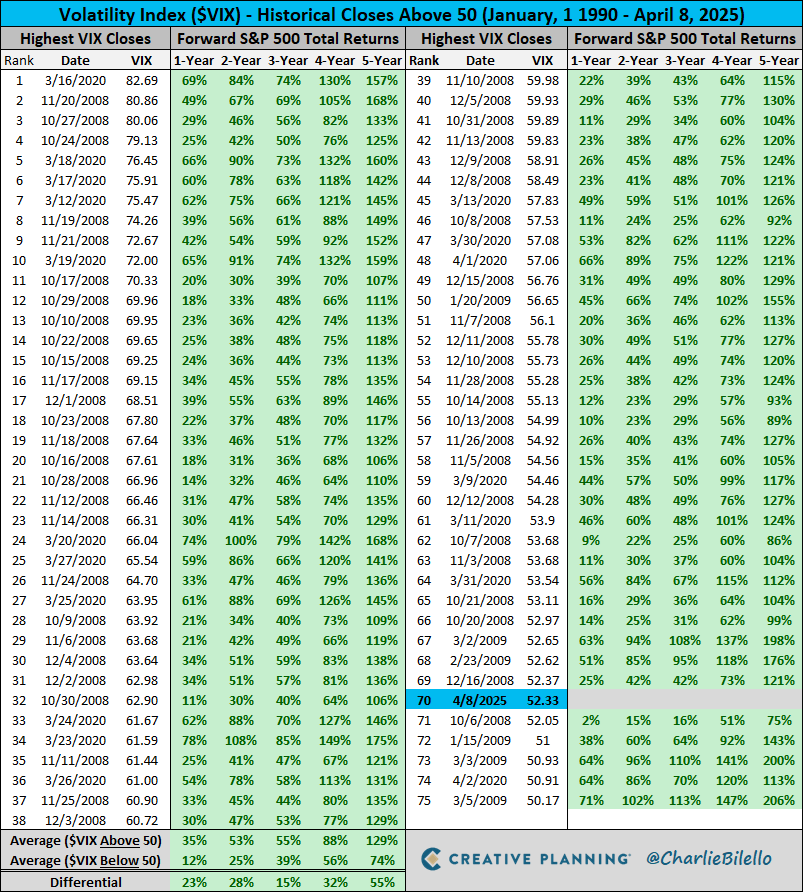
Yes, high volatility may be a good thing. Today, that statement may be hard to fathom. Moreover, it’s likely that stock returns over the coming weeks and months will be poor. However, as we share in a table courtesy of Charlie Bilello, since 1990, when volatility spikes above 50, longer-term returns have always been good. The 75 instances following the VIX spiking above 50 have consistently produced positive returns over the next 1-5 years. This bodes well for those able to shut their eyes and ignore markets. However, for the rest of us, there are risks. For example, you will see many dates below from the fall of 2008. During the Lehman bankruptcy and related financial market carnage, volatility spiked. Markets didn’t set the ultimate low until March of 2009. Those that bought on the spikes above 50 faced a gut-wrenching decline, but if they held, they ultimately did well.
The point is that today’s volatility will likely result in good returns, but better buying opportunities may soon emerge, producing even better returns.
Transports Continue To Languish
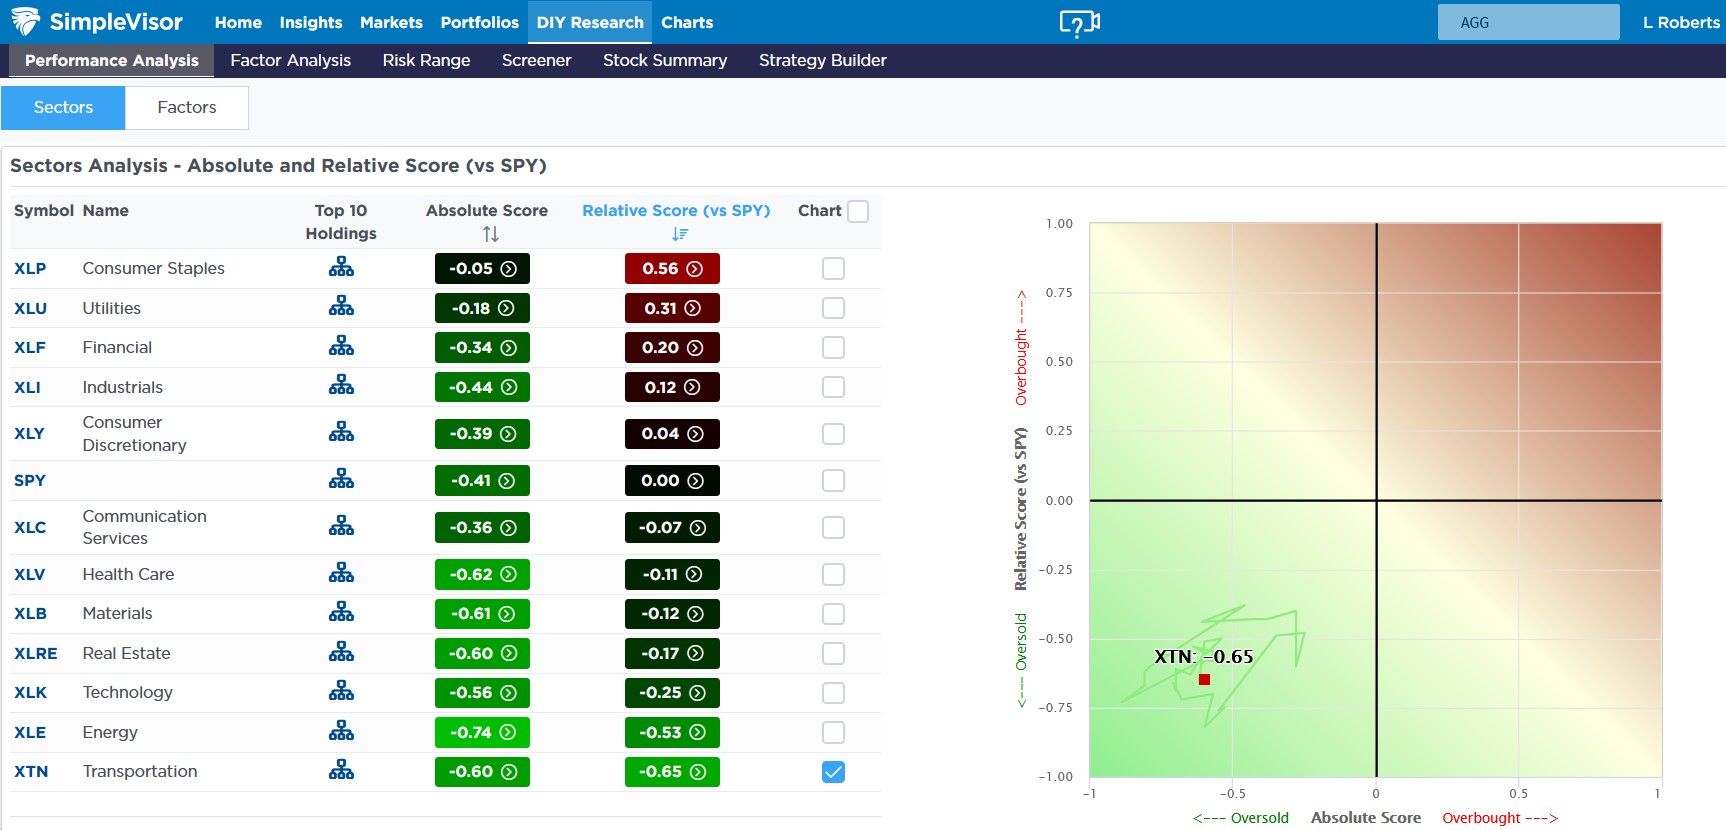
Interestingly, the sector likely to be directly impacted by tariffs the least is and continues to be the most oversold sector. As the SimpleVisor table below shows, transportation stocks have the most oversold relative score. The scatter plot on the right shows that the sector has been “orbiting” over the last seven weeks in the lower left quadrant. This quadrant represents a situation where the absolute and relative scores are oversold.
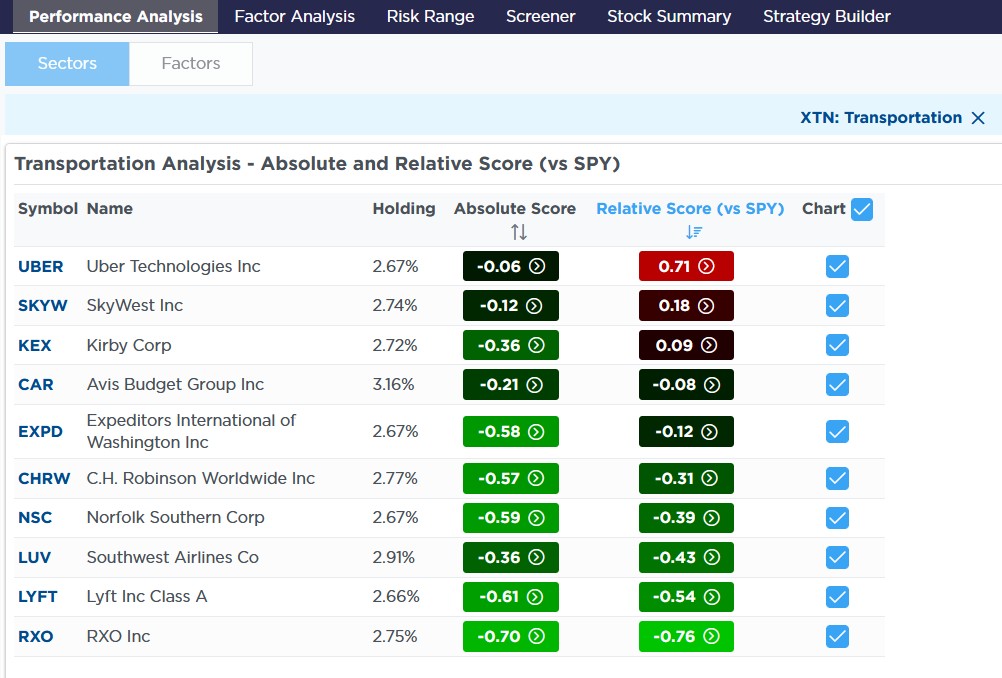
The second graphic provides a deeper dive into the transportation sector. The sector’s largest holdings are rental car/ride services, airlines, and shipping companies. While direct tariffs on these companies may be less than others, they are susceptible to slowing economic activity. These stocks may likely continue to underperform if the economy does enter a recession. However, if the economy can sustain itself as tariff deals get worked out, these stocks may be the ones to watch, as they are certainly due for a period of outperformance.
Tweet of the Day
“Want to achieve better long-term success in managing your portfolio? Here are our 15-trading rules for managing market risks.”
Please subscribe to the daily commentary to receive these updates every morning before the opening bell.
If you found this blog useful, please send it to someone else, share it on social media, or contact us to set up a meeting.

