There are currently no future events scheduled. Please check back soon!
Contact Us
855-742-7526
Site Search
        • ACTIONS

          Join Our Daily Newsletter

          Daily Market Commentary

          DMC- Subscription - Mega menu Invest

          Name
          This field is for validation purposes and should be left unchanged.
        • ACTIONS

          Join Our Daily Newsletter

          Daily Market Commentary

          DMC- Subscription - Mega menu retire

          Name
          This field is for validation purposes and should be left unchanged.
        • ACTIONS

          Join Our Daily Newsletter

          Daily Market Commentary

          DMC- Subscription - Mega menu Insure

          Name
          This field is for validation purposes and should be left unchanged.
        • ACTIONS

          Join Our Daily Newsletter

          Daily Market Commentary

          DMC- Subscription - Mega menu benefits

          Name
          This field is for validation purposes and should be left unchanged.
Connect With Us
TPA Plus - Trend Range

SRCL-positive

tpa
Screenshot_1-4
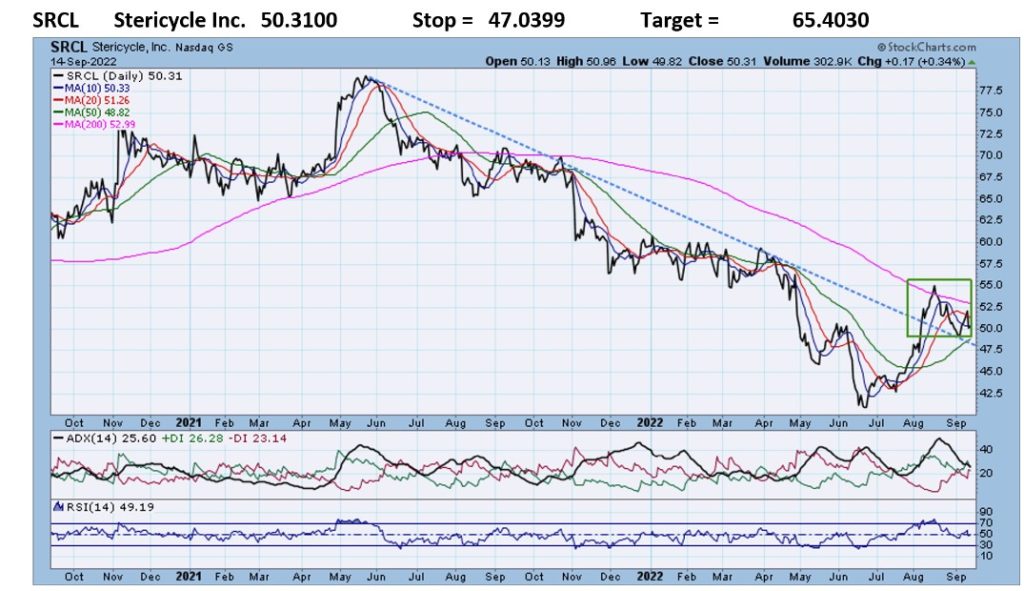
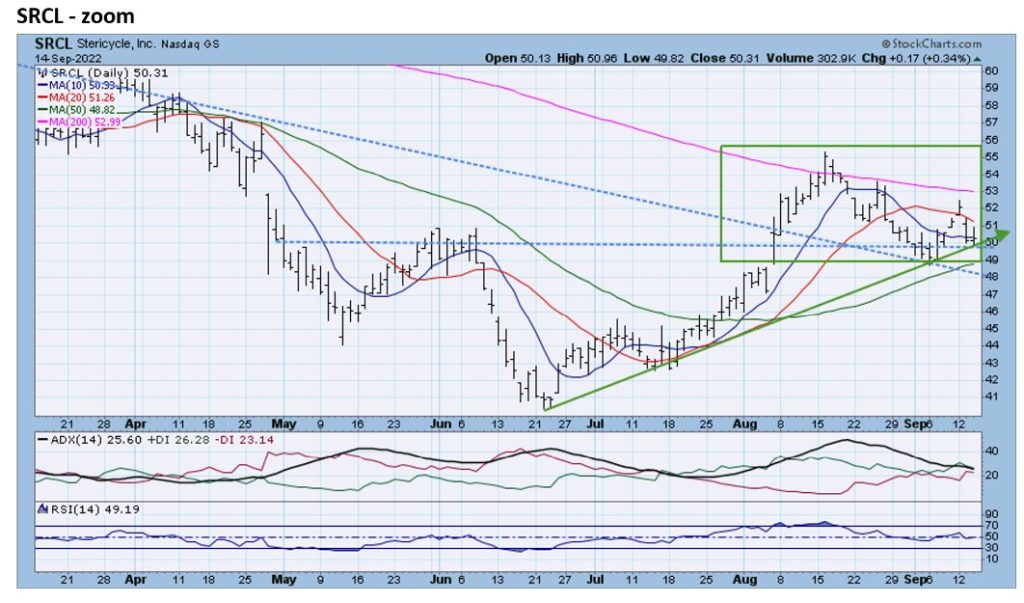
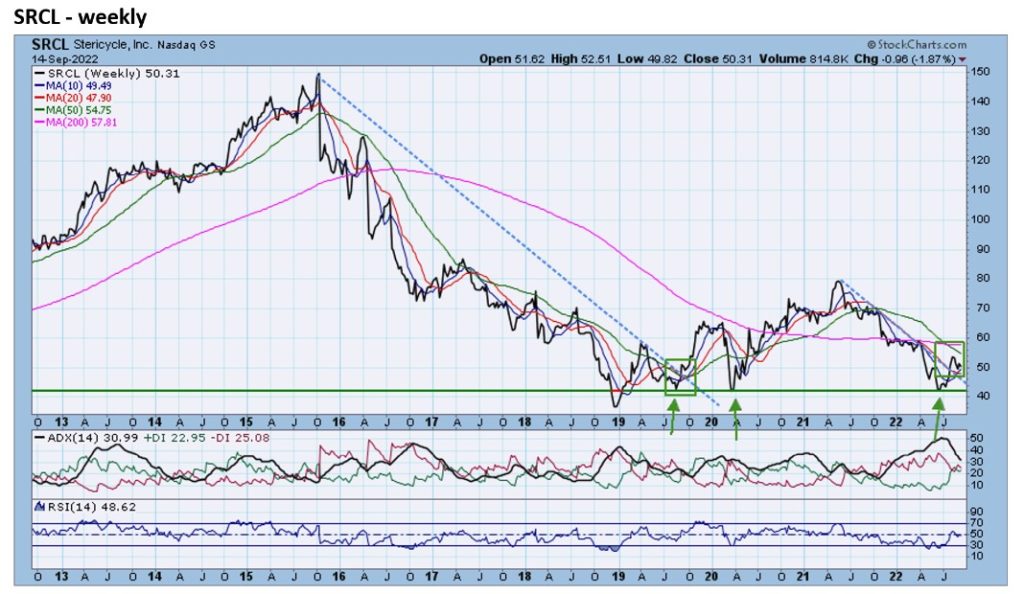
  • SRCL rose above its 15-month downtrend line in August. The zoom chart reveals that the rally in August also put SRCL above 3-month resistance at the 50 level. SRCL has established a pattern of higher lows=uptrend and the recent decline puts it at uptrend support. The weekly chart shows that the low is June was a true long-term inflection point as it matches up with support from 2019 and 2020. The weekly chart also shows that SRCL is very close to the bottom of its 10-year trading range.

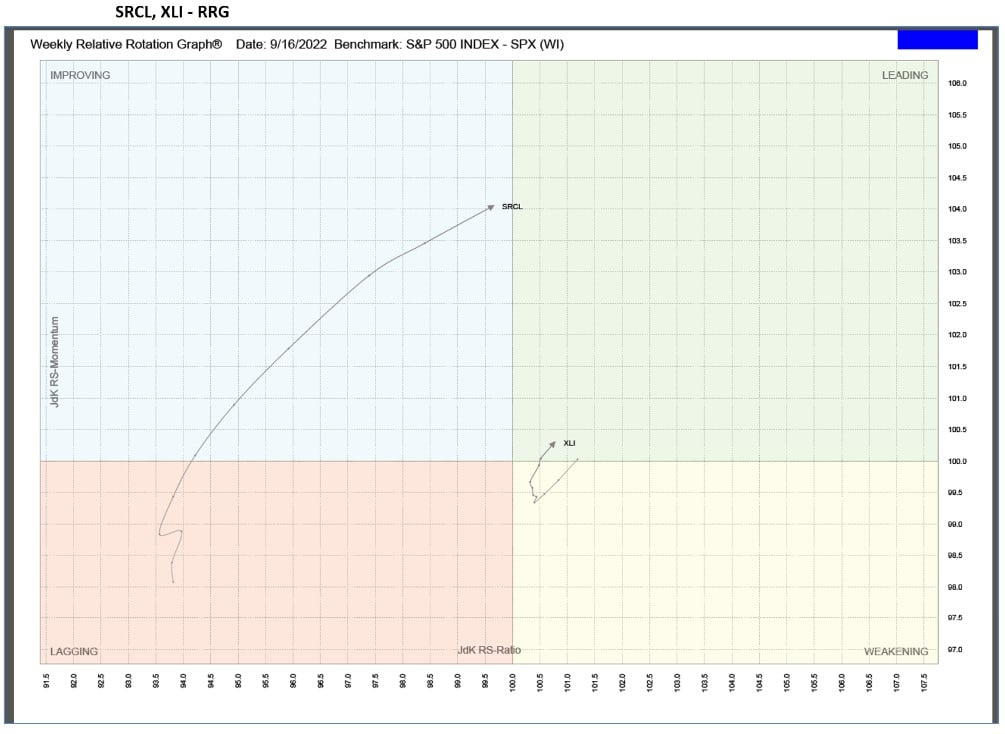
RRG analysis shows that SRCL has moved out of the Lagging quadrant, into the Improving quadrant, and is headed to the Leading quadrant. (see RRG below).

1-8
2-5

4-4

Relative Rotation Graphs (RRG) – explanation video

RRG – written explanation

5-4
FacebookLinkedInTwitterEmailPrint

Never miss our content again!

Subscribe Now

Daily-Market-Commentary
the-bull-bear-report