
In 2010, following the financial crisis and market meltdown in 2008 and early 2009, Fed Chairman Ben Bernanke made a notable speech explaining the virtues of the wealth effect. To wit:
Higher stock prices will boost consumer wealth and help increase confidence, which can also spur spending. Increased spending will lead to higher incomes and profits that, in a virtuous circle, will further support economic expansion.
While not implicit, Bernanke boasted that by fortifying liquidity in the financial markets via QE and lower Fed Funds, the Fed boosted stock returns and thus greased the wheels of the “virtuous circle.”
Since then, periods of easy monetary policy have correlated well with positive stock market returns. While that relationship is noteworthy, we must also consider the other side of the coin. When the Fed is not providing ample liquidity to the financial markets and stock returns are negative, there must be an adverse wealth effect. Simply, the wheels of Bernanke’s virtuous circle get stuck in the mud.
Accordingly, given the recent market volatility and the possibility of an adverse wealth effect, it’s worth quantifying the relationship between stock returns and economic activity.

Marginal Propensity To Consume (MPC)
Marginal propensity to consume (MPC) helps us approximate how gains or declines in wealth or income contribute to or reduce economic activity.
We lead with the MPC calculation for income and then use the same logic for changes in wealth.
MPC quantifies the proportion of additional income an individual will spend rather than save. While the proportion differs for everyone, economists focus on aggregate data. MPC is calculated as the change in consumption divided by the change in income. It is expressed as a ratio between 0 and 1. For example, if a person receives a $1,000 bonus and spends $750, the MPC is 0.75.
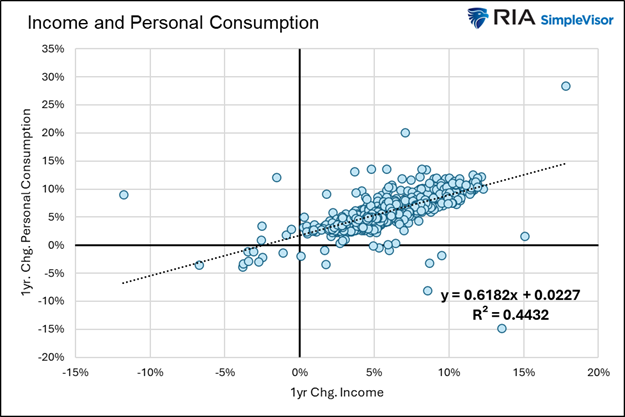
The graph below plots annual changes in aggregate consumption and income since 1959. The R-squared of .4432 shows the relationship is relatively strong. Furthermore, based on the slope of the trend line, the MPC is .6182. In other words, consumers in aggregate are likely to spend 61 cents of every dollar they earn in additional income. Income relates to salaries and bonuses, as well as government-related benefits such as lower taxes or stimulus payments.
The Wealth Effect Calculation
To compute the MPC for changes in wealth due to stock market changes, we substitute personal income for individual equity holdings. As we will show, the relationship between changes in equity wealth and spending is not nearly as robust as that between income and spending. However, it has become better in recent years.
The first graph below plots the relationship between personal consumption and equity holdings from 1959 to 1995. The R-squared is statistically inconsequential at .0072. Therefore, the MPC estimate has no value. While statistically meaningless, it’s interesting that the relationship is negative, meaning stock market wealth and spending had an inverse relationship during that period. The downward-sloping trend line highlights this.

The relationship between equity holdings and consumption has strengthened more recently. The graph below plots the data from 1995. The R-squared is low at .0952, but the trend line is upward sloping. This denotes that equity holdings and consumption have a positive relationship. The formula indicates an MPC of .0483. Every dollar gain in equity wealth should boost personal consumption by almost a nickel.

The graph below highlights the growing positive relationship between the stock market and consumption. The increasing correlation should be expected as stock ownership as a percentage of the population has grown rapidly, as shown in the second graphic below.


The MPC Multiplier
Thus far, Bernanke’s stock market wealth effect appears minimal, especially compared to the wealth effect on income. While their respective MPCs are vastly different, we must also consider that personal consumption can have an amplified impact on GDP over longer periods. Thus, the MPC underestimates the total economic impact of equity wealth and income changes.
The so-called Keynesian multiplier states that additional personal consumption prompts businesses to produce more, which entails hiring more employees and investing in more output. Accordingly, wages rise, providing consumers with extra money to spend. Thus, the benefit to GDP is not just the MPC but an additional kicker due to the multiplier.
The formula for the Keynesian multiplier is 1 / (1 – MPC). To highlight its power, we compare how $1 of additional income and wealth benefits the economy.
As we shared, the MPC of income is 0.62. Therefore, the multiplier is 1 / (1 – 0.62) = 2.63, meaning a $1 increase in incomes should lead to a $2.63 increase in GDP.
Using the same math, a $1 gain in equity wealth should lead to a $1.054 increase in GDP – (1 / (1 – 0.048) = 1.054).
Remember that the correlation between equity wealth and consumption was statistically weak, so the relationship has little predictive value. Other gauges, like consumer sentiment, which benefits from higher stock prices, might produce a more compelling case for Bernanke’s wealth effect.
Cogs In The Virtuous Circle
We calculated that the MPC of stock market wealth is 0.05, a mere pittance compared to 0.62 on income. While a dollar gain in equity wealth results in slightly more than a dollar of GDP, it pales compared to increases in income.
The following bullet points reveal a few problems that explain its relative inefficiency versus income:
- Retirement Plans: Profits in our retirement account are inaccessible for most investors. Retirement plans are estimated to represent 40% or even more of the total equity holdings.
- Demographics: Retirees tend to be wealthier than younger generations, but many are less likely to consume as their budgets are constrained.
- Time Lags: Our needs and desires to consume do not always occur simultaneously with the growth of wealth.
- Wealth Distribution: As shown below, the wealthiest 20% own the vast majority of stocks. Therefore, the equity wealth effect only applies to a relatively small percentage of the population. Further, the very wealthy do not change their consumption habits based on marginal changes in wealth.


Summary
We wrote that there is almost a one-to-one relationship between the growth of wealth from equity holdings and GDP. That relationship is two-way. In other words, if the stock market falls and equity wealth diminishes, the economy should, on the margin, be negatively impacted.
There are a few things to remember before applying the wealth effect to your GDP expectations.

