
In hindsight, markets are easy to assess, yet extremely challenging to forecast. For example, as we will show, it’s undeniable that value, particularly large-cap value stocks, have been in vogue during the recent decline, while growth is being kicked to the curb. This rotation from growth to value is an example of how investors rotate from one sector or factor to another. The key to maximizing your returns is to spot sector and factor rotations early. We share two screenshots from SimpleVisor that we use to assess the recent rotation from growth to value. As we will share in a coming article, SimpleVisor has many other proprietary rotation tools that can help spot which sectors and factors are hot and which are not. Notably, the analysis guides to what rotation may be next in line.
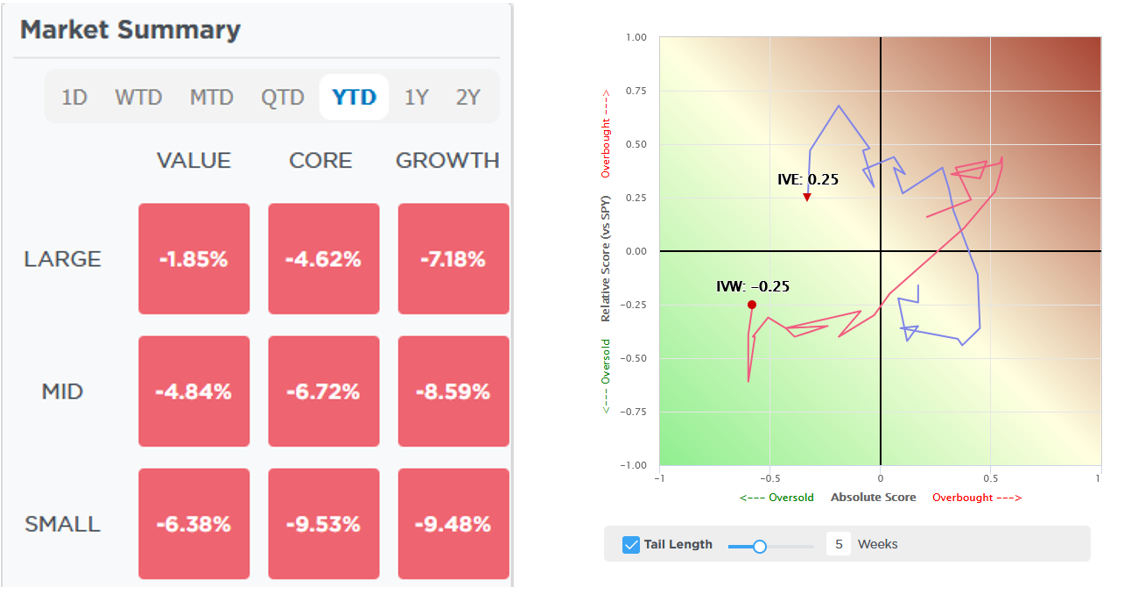
The table on the left shows year-to-date returns by market cap and value/growth factors. As it shows, large cap value (top left corner) is down on the year but grossly outperforming the other factors, especially large cap growth. Within SimpleVisor we calculate relative (vs S&P 500) and absolute technical scores on sectors and many stock factors. The scores are based on 14 technical scores, some of which are proprietary.
The graph to the right plots the changes in the absolute and relative scores for large cap value (IVE) and large cap growth (IVW). It shows that over the last five weeks, IVW has rotated from overbought on both metrics to oversold on both. Conversely, the relative score on IVE has increased over the previous five weeks, while its absolute score has deteriorated recently. This is a graphical way to show how IVE has beaten the market but is slipping with the market. Furthermore, it shows how IVW is underperforming on a relative and absolute basis.
What To Watch Today
Earnings
- No notable earnings releases
Economy

Market Trading Update
I am traveling today, so I will update the current market environment on Monday. However, I did want to revisit our weekly analysis which is the key to signaling a deeper corrective cycle. In March of 2022, our money flow indicator generated a confirmed sell signal which preceded the near 20% decline in the market. That signal reversed to a buy signal in November 2022 suggesting a reversal back to a bull market which has held constant since.
However, two of the three signals are now triggering concerns about a larger corrective cycle sometime this year. While it would seem prudent to drastically reduce exposure currently, by the time the two lower indicators are triggered, markets tend to be deeply oversold and a reflexive rally is probable. Such is the case we have been making most of this week.
The primary signal, which will confirm the two lower indicators, has not been triggered yet. This keeps exposures intact for now, but the confirming sell signal will occur if the market continues to trade sideways for the next few weeks. That signal will suggest further corrective actions following a short—to intermediate-term rally this summer. If such occurs, and we think it will, portfolios will need to be more drastically risk reduced.

No indicator is perfect, and this one will not get us out of the market without first sustaining some damage. However, this model has often kept us out of harm’s way. We trust that it will do that for us again as well. Trade accordingly.

PPI Confirms CPI- Inflation Is Cooling
Headline PPI came in at 0.0% for February, while the core PPI fell by 0.1%. Both were below expectations for an increase of 0.3%. This was just the 2nd negative print in core PPI since April 2020. The weaker inflation figures were fueled by a big drop in transportation services and, in particular, public transportation prices. Transportation prices have been volatile over the past few reports. As we noted yesterday with CPI, the bond market is more focused on the risk-on/risk-off trade, thus gaining little impetus from the weaker inflation data.
While the PPI news is good, the sub-components, shown below, that feed PCE are slightly higher than expected. Accordingly, estimates for PCE prices are drifting up to +0.3%, from +0.2%.

The Importance Of Asset Allocation In Building A Resilient Portfolio
A well-structured asset allocation strategy is the foundation of a resilient investment portfolio. It determines how your investments are distributed across different asset classes, balancing risk and return to align with your financial goals. Proper asset allocation can help you navigate market fluctuations, protect wealth, and optimize long-term performance.
In this article, we’ll explore the importance of asset allocation, the different asset classes, and strategies for adjusting your portfolio over time.

Tweet of the Day

“Want to achieve better long-term success in managing your portfolio? Here are our 15-trading rules for managing market risks.”
Please subscribe to the daily commentary to receive these updates every morning before the opening bell.
If you found this blog useful, please send it to someone else, share it on social media, or contact us to set up a meeting.

