
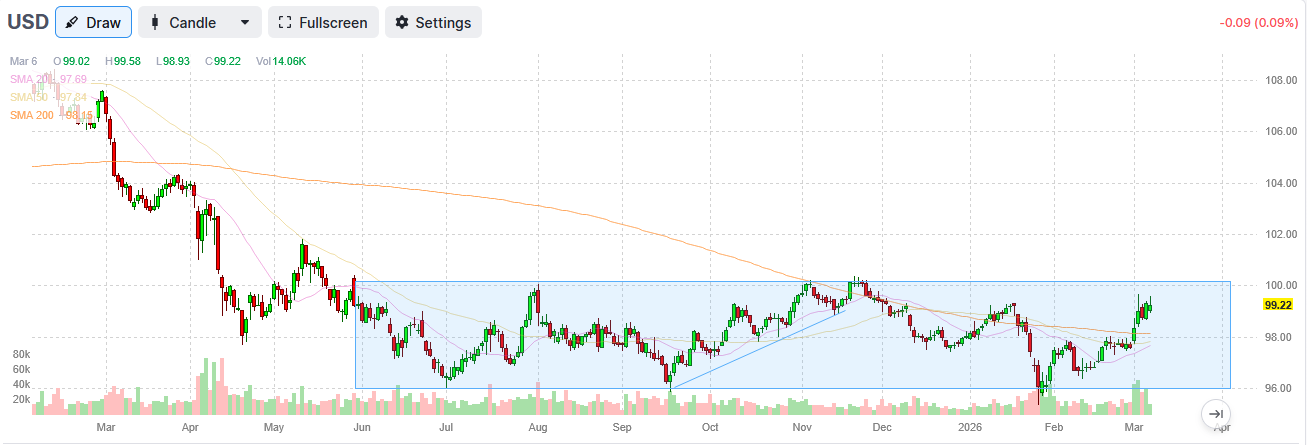
The Iran conflict has dominated the headlines, with the financial media primarily focusing on rising oil prices. While higher oil prices can certainly impact the economy, the dollar’s surge, which we hear little of, is an equally consequential market and economic development. Moreover, the appreciating dollar’s ripple effects are being felt across asset classes in ways that are easy to miss but unwise to ignore.
A stronger dollar creates a headwind for US multinational corporations, whose overseas revenues are worth less when translated back into dollars. With roughly 40% of S&P 500 revenues generated outside the US, a sustained dollar appreciation will weigh on earnings. At the same time, dollar strength broadly suppresses commodity prices, which partially offsets the inflationary impulse from higher oil prices. This helps explain why gold and silver have struggled despite the favorable geopolitical backdrop for precious metals.
The most underappreciated impact, however, is on developed and emerging markets. Prior to the Iranian conflict, those two sectors had been among the best performers. Moreover, their recent outperformance was closely linked to the dollar’s weakness. US investors buying foreign assets must convert their dollars into the foreign currency before investing. Thus, a stronger dollar works against their investment. Further, foreign companies that borrow in dollars will see their debt servicing costs rise when the dollar strengthens, regardless of any change in their local interest rates. This tightens global financial conditions and reduces capital flows into risk assets. Moreover, it can trigger currency crises in the most vulnerable economies.
What To Watch Today
Earnings

Economy

Market Trading Update
The S&P 500 closed Friday at 6,852, down roughly 0.8% on the session and approximately 2.1% from its late-January high of 7,002. From a momentum standpoint, conditions have deteriorated on the short-term time frame. The 14-day RSI has slipped to approximately 39, a weak reading and trending lower. The MACD has crossed bearishly, with the histogram printing in negative territory. The index now trades below both its 20-DMA (~6,910) and 50-DMA (~6,881), which have flattened into overhead resistance. Most importantly, the 20-DMA has crossed bearishly below the 50-DMA, confirming the weakening market backdrop.

The market closed on Friday at the support, going back to mid-December and the previous tops in October. However, the close firmly below the 100-DMA, which has previously contained selloffs, suggests more risk heading into next week. Volatility is also on the move. The VIX surged on Friday, closing near 30, its highest level since last November’s sell-off. That rising VIX poses a reflexive risk, as systematic strategies that added exposure during the recent low-volatility window may face mechanical de-risking if the VIX sustains above 20.

Breadth, however, remains the bull case. Approximately 58% of S&P 500 constituents remain above their 200-DMA. Despite the correction in the broad market index, this is a market correcting through rotation, not liquidation. The sectors doing the heavy lifting (Industrials, Energy, Materials, Staples) represent only ~19% of index weight, barely offsetting the drag from Technology alone (~29%).
Bottom line: The bull trend is intact, but short-term momentum has weakened into overhead resistance. I suspect we will get a better entry point for a rally as we get into mid-March, as seasonal tailwinds are mildly positive. However, this is a midterm election year, which historically delivers muted first-half returns and an average intra-year drawdown of 18%. Watch the 6,740 level closely, and a break below 6,720 would be a “warning shot.” The next meaningful rally will likely come from a rotation back into the oversold mega-cap sectors, Technology, Communications, and Financials, rather than a continuation of the value/cyclical leadership. Rebalance winners, define risk levels, and don’t fight the trend, but protect gains.


The Week Ahead, Jobs, And Retail Sales
The market’s focus this week will be on inflation. CPI on Wednesday is expected to show a 0.2% increase, down 0.1% from last month’s figure. The January PCE price report will be released on Friday. It too is expected to show a 0.2% increase. Changes in energy prices lag in the inflation reports by 2-3 months, so there will be no impact on this week’s inflation data from the recent surge in oil prices.
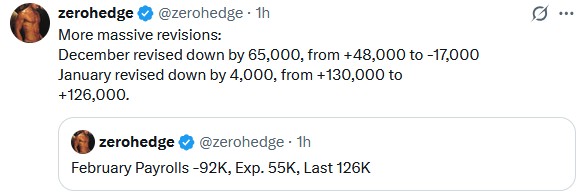
After a surprisingly strong BLS labor report last month, the February data is quite the opposite. Payrolls fell by 92k jobs, bringing the two-month average to a net gain of a mere 17k jobs per month. The culprit, as we share below, is a loss of jobs in the strongest sectors: Education and Health Care. Over the previous six months, the two sectors added 57k jobs per month on average. See the Tweet of the Day below for more worrisome jobs data. Adding to the dour economic data, Retail Sales fell by 0.2% versus being flat last month. Such a decline was expected.

US Stablecoins And The Rebasement Of The Dollar
The “fiat is dying” argument has become a catchphrase narrative among digital asset bulls, gold bugs, and cryptocurrency advocates. That narrative’s core is that central banks have printed vast amounts of money. The “money printing” has led to currency debasement and rendered the U.S. dollar obsolete. We discussed this “debasement” narrative previously.
The narrative is seductive: inflation is out of control, the government is printing money, and the dollar is on its last legs. But while there are real risks to watch, most headlines sell fear rather than fact. It’s striking, and those selling gold, silver, or other doomsday assets often use it to scare individuals into taking action. One of their favorite charts used to make the “debasement” case is the classic graph showing that the U.S. dollar has lost 90% of its purchasing power since 1966.”
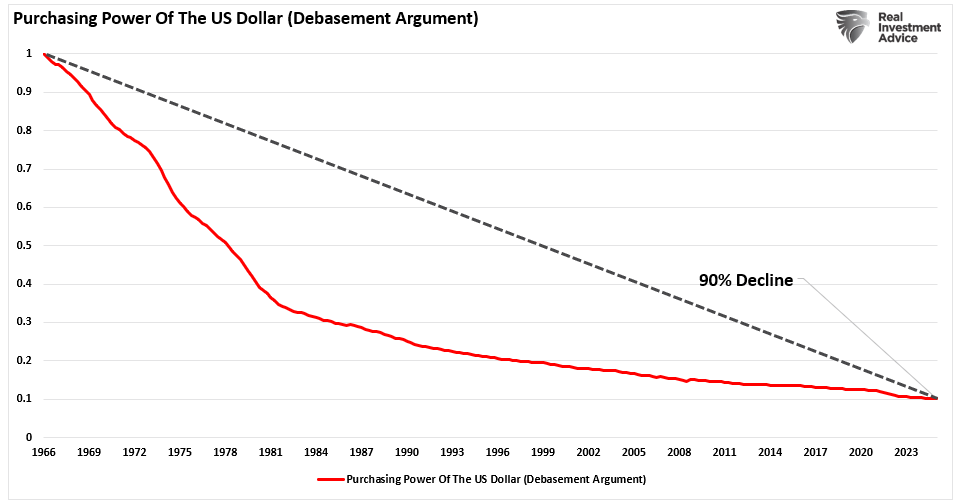
But here’s the thing: that chart doesn’t show debasement. It only reflects inflation, a well-understood and largely expected outcome in a growing economy. Prices rise over time because demand increases due to population growth, rising incomes, and growing consumption. This is especially true in a post-industrial, service-driven economy that incentivizes credit expansion and capital investment. In other words, it’s not the dollar losing value; it’s the economy expanding.
Tweet of the Day
“Want to achieve better long-term success in managing your portfolio? Here are our 15-trading rules for managing market risks.”
Please subscribe to the daily commentary to receive these updates every morning before the opening bell.
If you found this blog useful, please send it to someone else, share it on social media, or contact us to set up a meeting.

