
Tweets like the one we share below allude that the Fed is doing stealth QE, despite the fact that they publicly claim to be conducting QT. Given the importance of the Fed balance sheet, let’s dive into the stealth QE accusation and uncover the facts.
The graphic within the Tweet contains the official Treasury Department announcement of last Tuesday’s ten-year Treasury auction. The red arrow highlights that the Fed, via its SOMA account, bought $14.8 billion of the auction notes. While the Fed is buying, leading to stealth QE claims, they are not adding to their balance sheet. Under the current QT regime, the Fed targets a $5 billion monthly decline in its Treasury securities holdings. For example, about $76 billion of its bonds will mature in May. Therefore, if $76 billion naturally leaves the balance sheet but the goal is for a $5 billion decline, they must buy $71 billion throughout the month.
Another bit of false information we hear is that Fed purchases are making Treasury auctions appear better than they are. This, like stealth QE, is patently false. The size of the auctions is announced in advance. After the auction buyers and yield are determined, the Fed buys additional bonds from the Treasury at the predetermined auction yield. Thus, the Fed’s purchase of bonds does not affect the auction statistics. The auction shown below was for $42 billion. The relevant auction statistics are based on the $42 billion and the type of buyers.

What To Watch Today
Earnings

Economy
- No economic data of consequence
Market Trading Update
Last week, we discussed that while the market improved sharply, the underlying economic data continues to decline steadily. However, given that the data was not recessionary, the market rallied and took out some key resistance levels. To wit:
“This past week, two reports confirmed the economy is slowing. First, there was the weak GDP report, which showed growth of roughly one percent, after discounting the impact of the trade deficit. Secondly, while the employment number was higher than expected, job growth also slowed. However, those reports should have tempered market enthusiasm as they reduced hopes for Fed rate cuts. However, the market pushed higher as investors raced to jump back into “risk assets” as the market cleared initial resistance at the 20-DMA and reversed all of the ‘Liberation Day” losses.‘”
The market paused its advance before the Fed meeting on Wednesday, which was remarkably uneventful. The Fed held rates steady as expected and did not provide much guidance regarding its forecast for future rate cuts. However, on Thursday, the Trump administration discussed its first “trade deal” with the UK. Notably, the US has a trade surplus with the UK, making negotiating a trade deal easier. Nonetheless, announcing a long-awaited agreement gave the market hope that more deals eventually will follow. Unfortunately, other trade deals with actual “trade deficit” countries may be tougher and take much longer to negotiate.
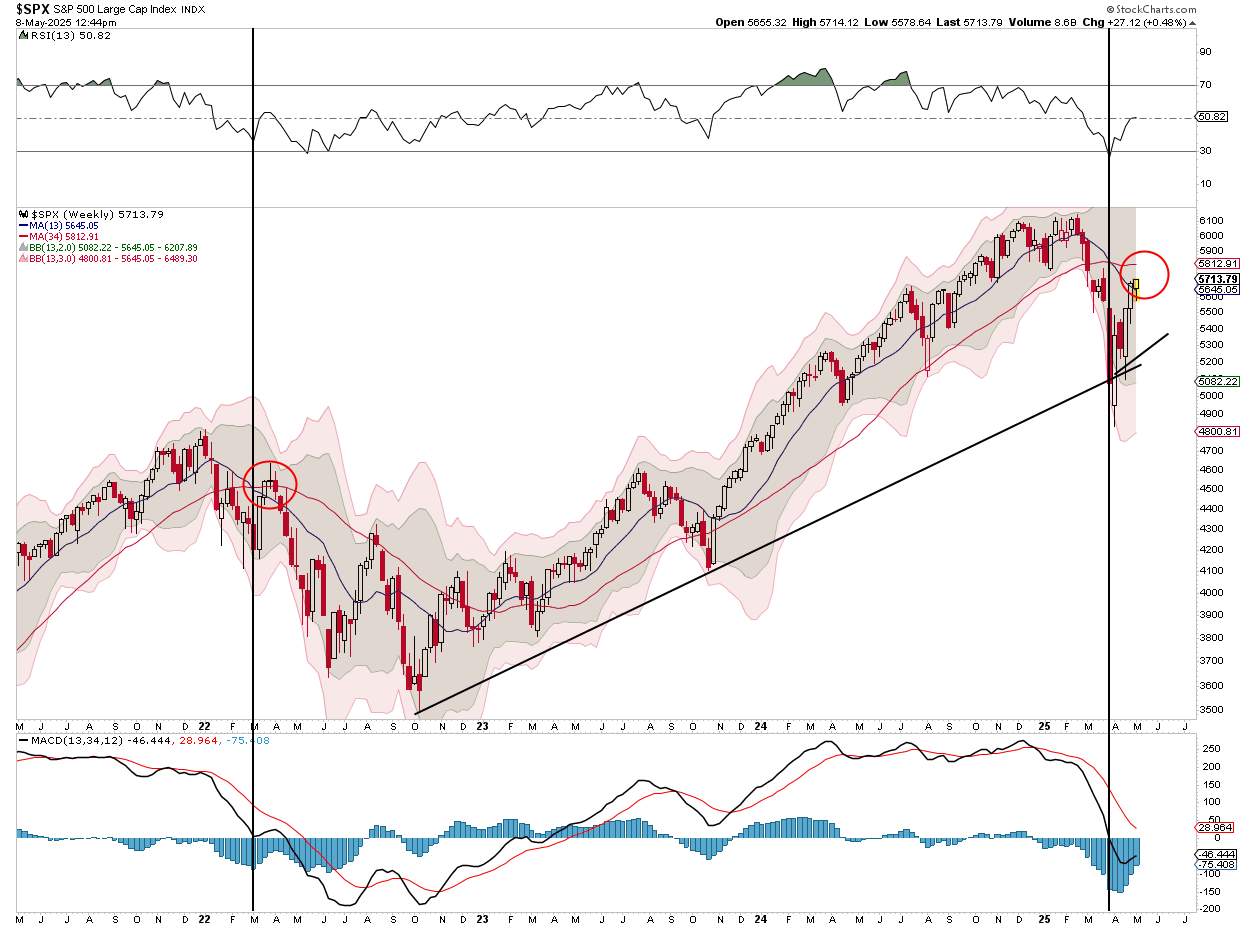
Technically, the market is beginning to repair much of the damage from the “Liberation Day” tariff announcements. However, on Thursday, we made the case that we are still tracing out the 2022 market analogy. As shown in the weekly chart below, in 2022, the market sold off and triggered a weekly moving-average crossover in early March. Immediately following that selloff, the market rallied back to those longer-term moving averages and briefly broke above. That “bear market rally,” sucked investors back into the market, just to “rug pull” from beneath them. Such is how correctional markets work.
You will notice that the recent selloff has also triggered that same moving average crossover, and immediately coincided with a reflexive rally. The market has broken above the first moving average, challenging the second as investors and the media are increasingly bullish on stocks. Will the market “rug pull” on investors once again? I don’t know. However, as stated, if we are in a more protracted market correction, the risk is elevated, and we could see another retracement to support before this correction is complete.
Reasons The Correction Could Be Over, Or Not
It is always difficult to say whether this is a “bear market” rally while you are in the midst of it. In hindsight, these things are easy to identify, and investors have plenty of reasons to play the “could’ve should’ve” game. However, some valid arguments exist about why the recent correction was just that, and may now be over.
- Q1 earnings were above average, which is boosting investor confidence, particularly in the “Mag 7” and related AI stories.
- Investor sentiment is improving from extremely low levels and is not overly bullish.
- Treasury yields are coming down, along with inflationary pressures.
- Uncertainty around tariffs, the main driver of the correction, is rapidly becoming less of a threat.
- Recession risks have fallen sharply with the latest economic data.
- Market valuations have corrected somewhat in recent weeks.
Of course, there are reasons for concern that should also not be dismissed.
- Economic data and consumer confidence are getting weaker.
- Political policy uncertainty remains elevated.
- Despite the recent rally, the market still suffers significant technical damage.
- Investors were not prepared for the recent magnitude of the correction, providing potentially significant sellers wanting to get out. (Trapped longs)
- Monetary policy uncertainty remains elevated.
- Valuations, while reduced, remain well elevated from the long-term median and average.
With balanced risks, investors will likely benefit by remaining cautious and managing risk exposures until a more bullish path is exposed.

The Week Ahead
Inflation data highlights the week, with CPI on Tuesday and PPI on Thursday. The current estimate is for CPI to increase by 0.3% after falling by 0.1% last month. While the updated inflation data will be well followed, it may be too early to see the impact of tariffs. Accordingly, the market may discount any good inflation news. In addition to PPI, retail sales, and a speech by Jerome Powell are also on the calendar for Thursday. Moreover, several Fed members will opine on Fed policy this week.
Employment Data Confirms The Economy Is Slowing
While coming in much stronger than expected, the latest employment data confirmed what we already suspected: the economy is slowing. The reason the employment data is so important is that without employment growth, the economy stalls. It takes, on average, about 200,000 jobs each month to keep up with population growth, which ultimately keeps the economy growing. That is because, as discussed in last week’s #BullBearReport, the consumer comprises about 70% of economic growth. To wit:
“There is currently no evidence that the economy is slipping into a recession. However, if you want to know if an economic decline will evolve into a recession, there is one key factor to consider: consumer spending. Consumer spending comprises nearly 70% of the GDP calculation, and everything else, from business investment to imports and exports, is a function of the consumer’s “demand.” In other words, if the consumer is slowing down or contracting spending, businesses will not “invest” in expansion projects, increasing employment, or buying more products for resale. That relationship is shown in the chart below, which compares PCE to employment and private investment.”

However, most crucially, consumers can not consume without producing something first. Production must come first to generate the income needed for that consumption. The cycle is displayed below.
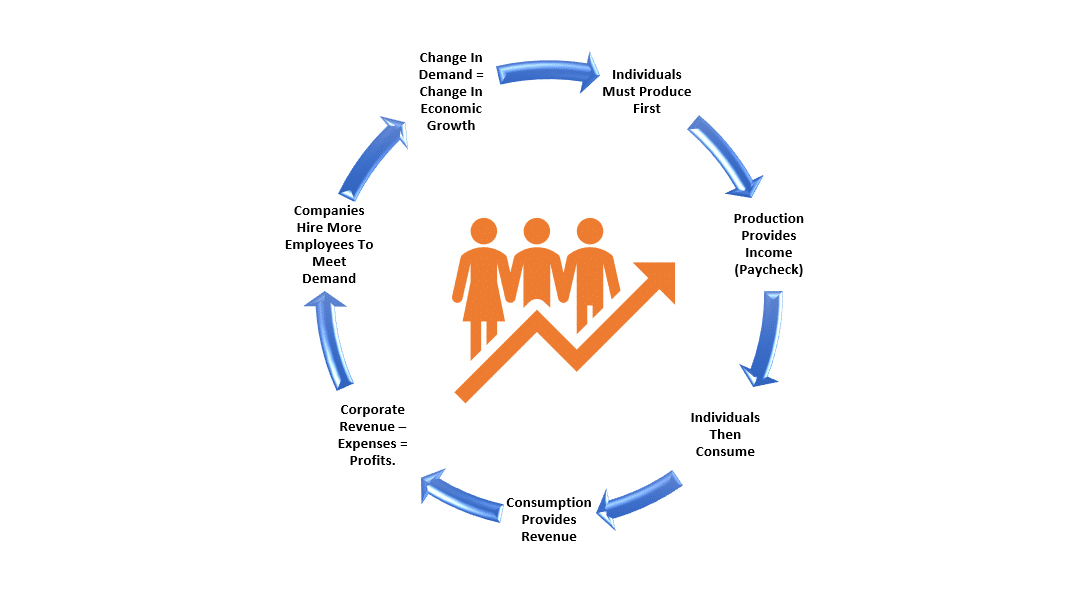
Here is the most critical point. Not all jobs are equal. READ MORE…
Tweet of the Day

“Want to achieve better long-term success in managing your portfolio? Here are our 15-trading rules for managing market risks.”
Please subscribe to the daily commentary to receive these updates every morning before the opening bell.
If you found this blog useful, please send it to someone else, share it on social media, or contact us to set up a meeting.

