
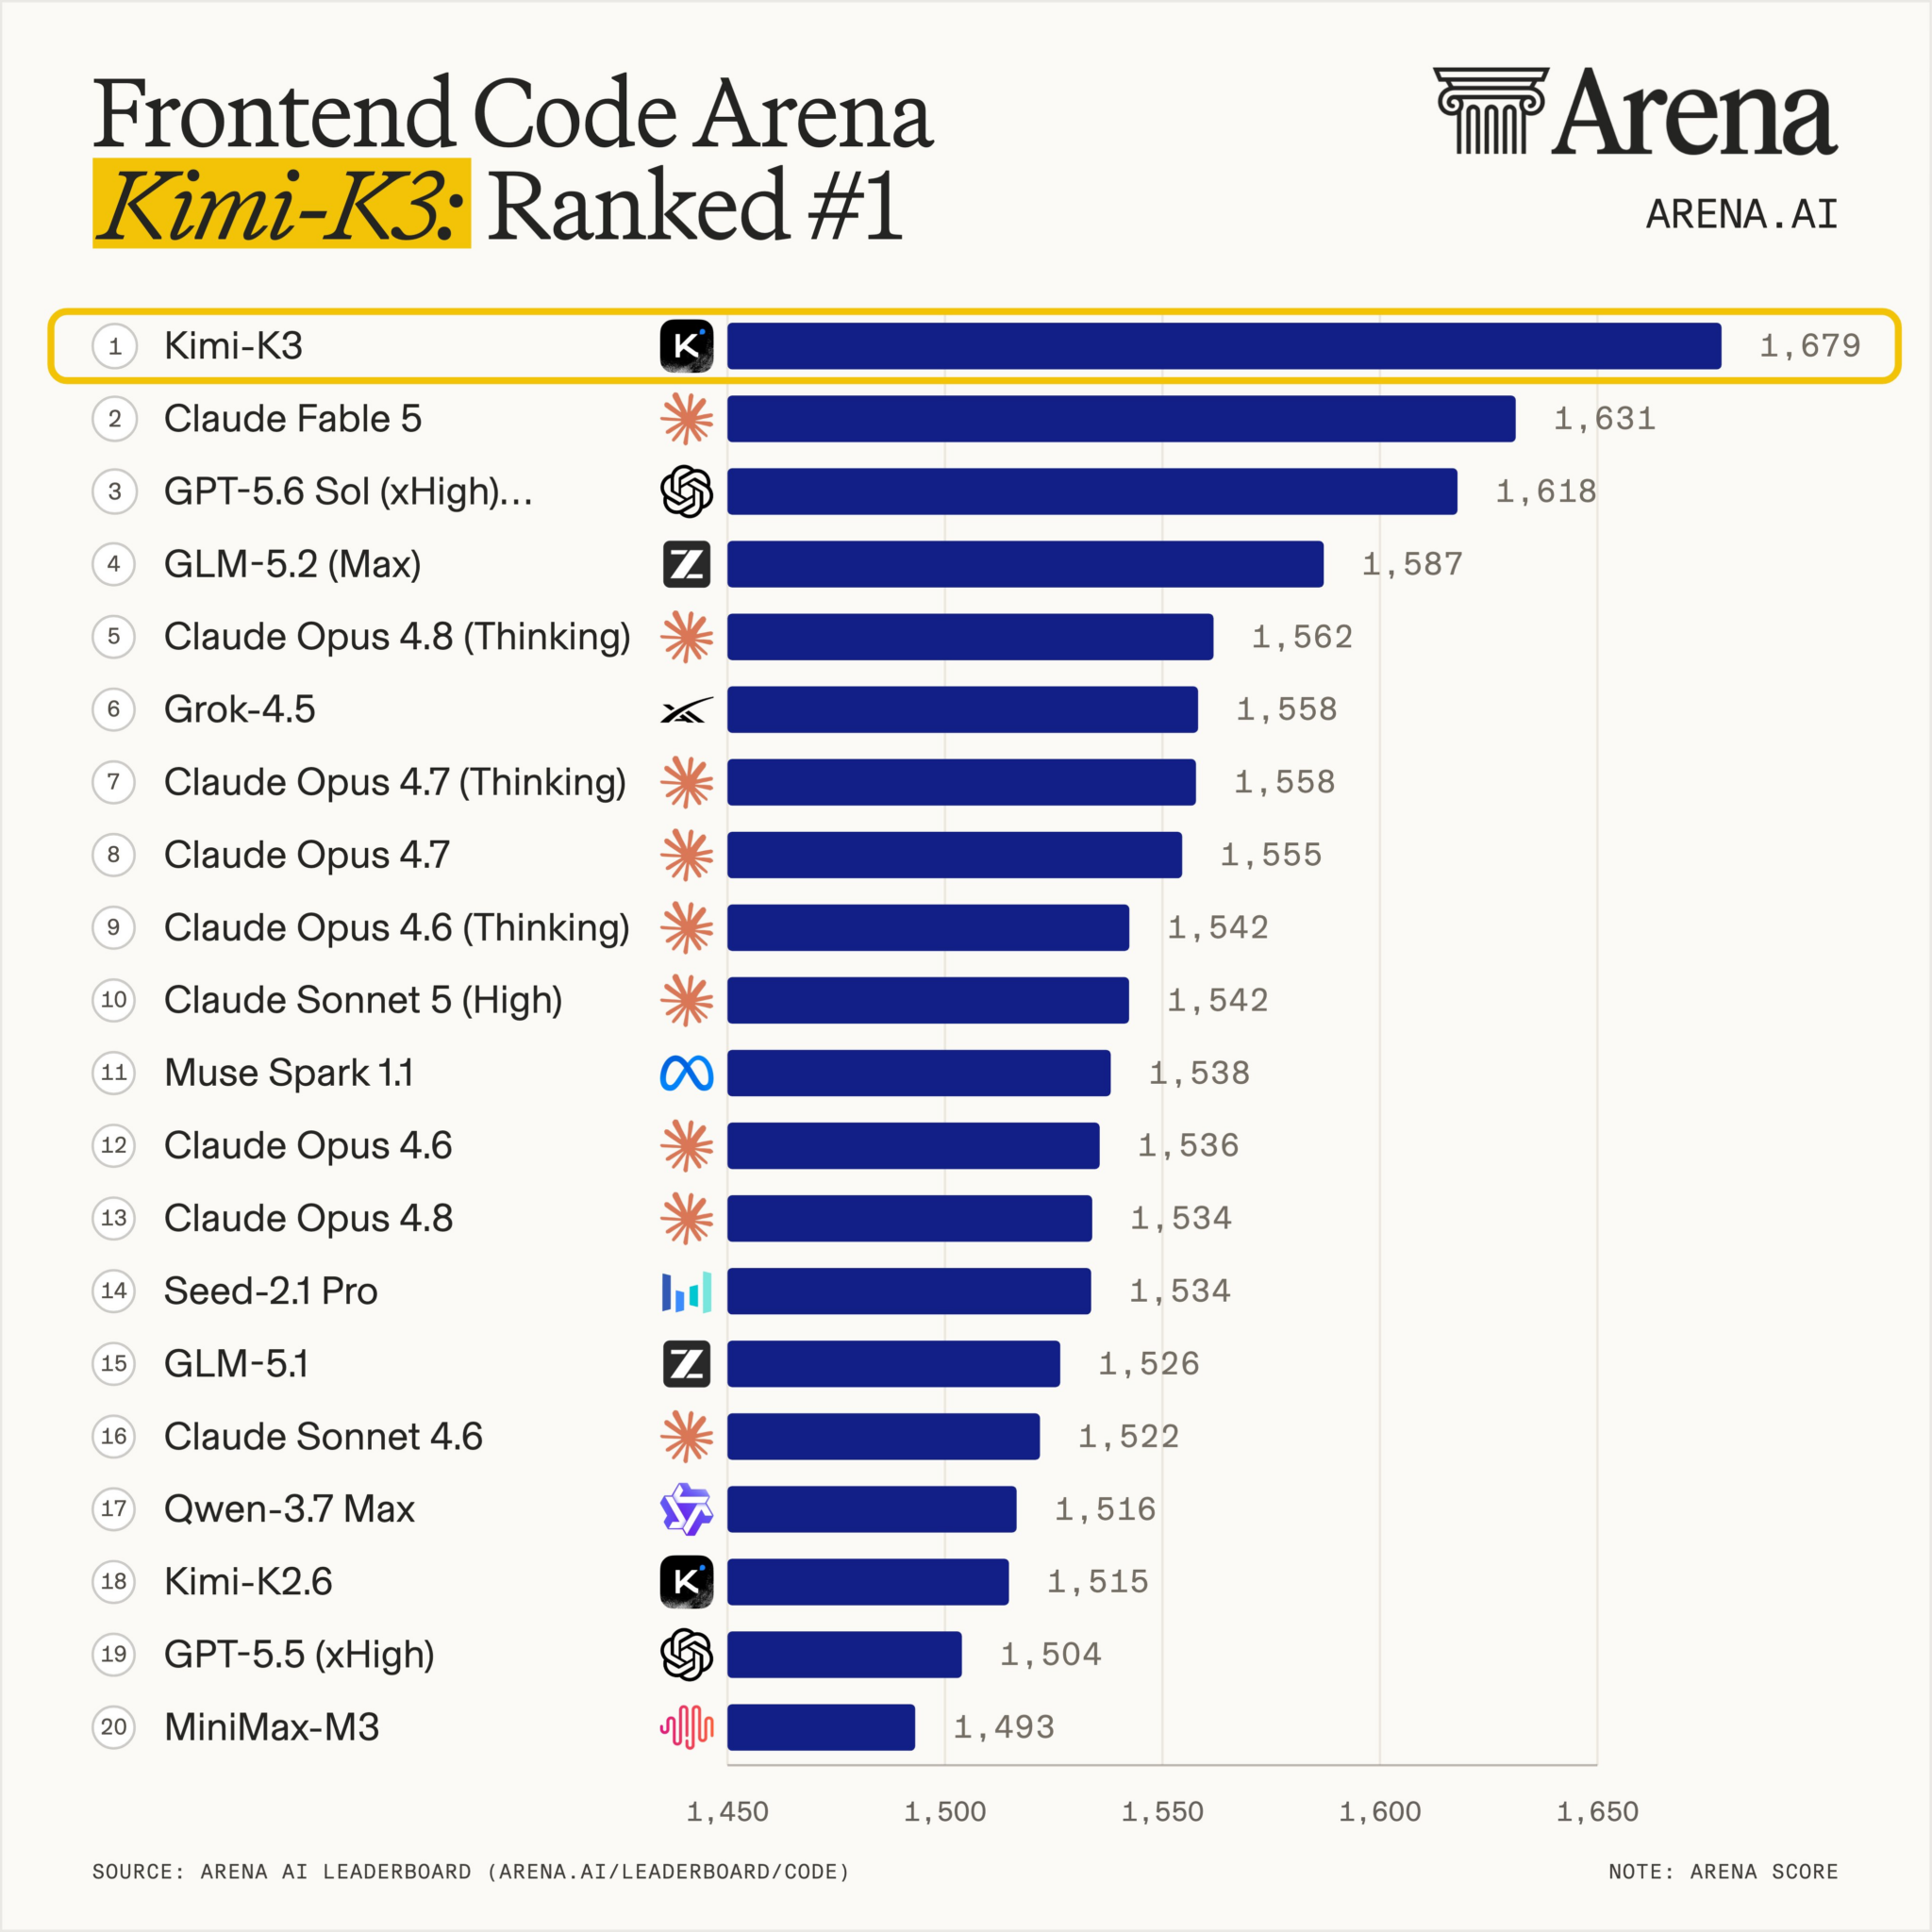
Moonshot AI, a Chinese company, just released AI model Kimi K3. Kimi K3 is a 2.8 trillion-parameter open-source AI model that the company claims is the largest ever built. With Kimi K3, Moonshot AI believes it can compete with Claude Opus 4.8 and GPT-5.5 across several benchmarks, trailing the leading systems only marginally. The news is not about Kimi-3’s capabilities but what open-source models may do to pricing power for the AI industry.
Open source refers to AI models whose underlying weights, architecture, or training code are made publicly available. Thus, users can download, run, modify, or build on them without paying licensing fees to the developer. This contrasts with closed or proprietary models like ChatGPT or Claude, which are only accessible through a paid API or app, with the underlying weights and training methods kept private.
Research from SemiAnalysis warns that “the rising share” of open-source capability “would fundamentally erode” any moat if the gap continues to close. While pricing may be a concern to the AI model industry, MoonShot AI security issues may be a problem for users. For instance, OpenAI disclosed that a supply chain attack linked to North Korea compromised a developer tool used by MoonShot AI. The Atlantic Council has warned that self-hosted open-weight models “can’t be fully tested or inspected,” leaving enterprises exposed.
This is precisely why OpenAI’s $10 billion custom chip partnership with Broadcom is important. Purpose-built, dedicated hardware lets an AI lab control the full stack, model, silicon, and data pipeline, rather than exposing its customers to whatever an open-weight file contains. For chipmakers and data centers, who wins the model war has little impact, as training the MoonShot AI model consumes enormous compute power.
The graphic below is courtesy of Arena.AI via ZeroHedge.
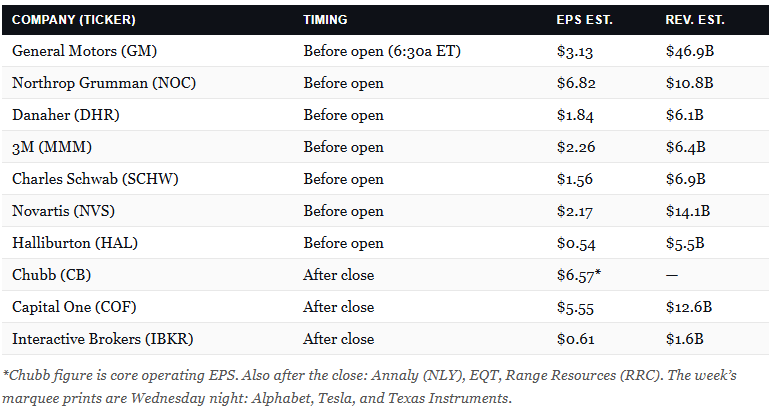
What To Watch Today
Earnings
Economy
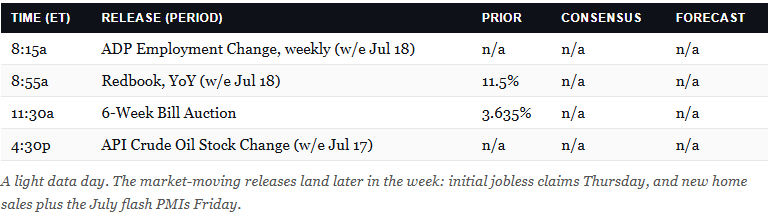
Fed Speakers: None scheduled. The FOMC is in its pre-meeting blackout ahead of the July 28–29 meeting (decision July 29).
Market Trading Update
In yesterday’s report, Michael Lebowitz showed how the cost of borrowing, not the spending itself, has become the real driver of the deficit. Today I want to take that same lens to the corporate side, because borrowing costs are where the AI trade’s biggest risk is now hiding.
Here’s the argument the credit bears are making, and it deserves a fair hearing. Goldman’s derivatives desk, in a widely circulated note from Brian Garrett, argues that the real threat to AI stocks was never in the stock market. It is in the bond market. Hyperscaler spreads have been widening, single-name CDS have been blowing out, and deal concessions are expanding, all while hyperscaler capex has become the single largest source of the global credit impulse. When the market doubts the return on that capex, credit is where it shows up first, and it has led equity drawdowns by two to four weeks in past stress. The strain is already visible in the tape, where implied correlation near 20-year lows tells you the S&P has become a poor proxy for the average stock.
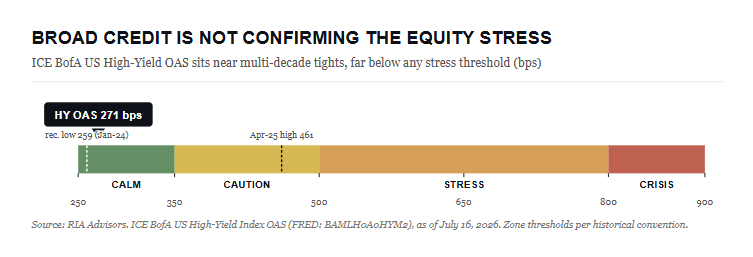
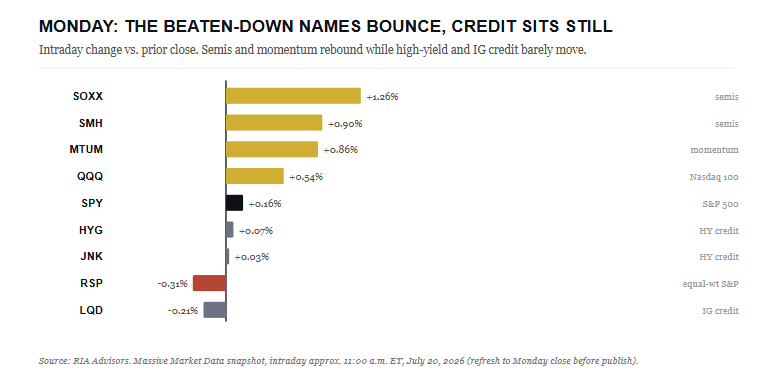
Now here’s the other side, and it matters just as much. The broad credit market is not confirming the warning. The ICE BofA high-yield OAS sits near 270 basis points, within a hair of its multi-decade tights and nowhere near the 3.5% that flags late-cycle stress, let alone the 8% that signals recession. Investment-grade and BBB spreads are near 25-year tight spreads of around 1%. Monday’s tape agreed. The washed-out semiconductors and momentum names caught a bid, the equal-weight index gave a little back, and high-yield credit barely moved. That is NOT what systemic stress looks like.
The positioning data points in the same direction. Goldman’s prime desk shows hedge funds have net sold US technology in six of the past eight weeks, the heaviest stretch in over a decade of their records, cutting tech net exposure to the 2nd percentile of the past year.
The high-beta momentum pair is down 32% from its highs, matching prior washouts. In plain terms, the crowd has already done much of the selling. The stress is idiosyncratic, concentrated in the handful of mega-cap issuers that drive the credit impulse, not systemic. That concentration is the risk. As Howard Marks often noted, the credit cycle turns before the equity cycle, and it turns without asking permission.
For our models, this draws a clean line. In the ETF Sector Rotation and Equity Conservative Growth models, we stay up in quality and hold dry powder, watching two tells into Wednesday night’s Alphabet and Tesla capex referendum: the broad high-yield index and the S&P’s near-term CTA trigger around 7,446. If high-yield breaks above 3.5% and price loses 7,446 on volume, we will start to de-risk. Until then, this is a rotation to manage, not a crisis to flee. Watch credit markets, not the headline. Trade accordingly.

Momentum Mash
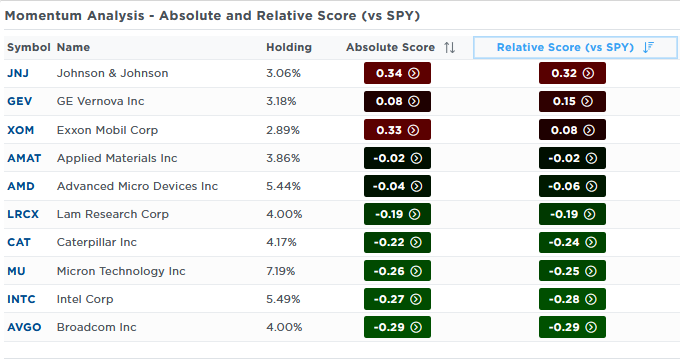
The key momentum ETF (MTUM) has underperformed the S&P 500 by 7% over the last 20 days. Other than gold miners, which have given up over 18% to the market, MTUM is the worst short-term performer. The second graphic shows the top ten holdings of the MTUM ETF. As shown, chip companies such as Micron, AMD, Intel, and Broadcom are the most oversold. However, their scores are not very oversold, indicating that they have more room to fall. The spectacular gains these stocks experienced help explain why the scores remain tame despite the sector’s rout. It’s worth noting that the high-beta ETF (SPHB) holds some of the same stocks as MTUM; thus, it is underperforming, as is MTUM.
Overall market breadth is good, with most sectors clustered within ±25 points of fair value. As the first graphic shows, the rotation is not necessarily value vs growth, as we have typically seen over the last few years; instead, prior underperformers seem to be taking charge.
It’s worth noting that emerging markets are underperforming for the same reason as momentum: chip stocks. SK Hynx and Samsung account for nearly 14% of the ETF. It also helps explain why the sector outperformed during the first half of the year.

Why Retail Traders Constantly Underperform Over Time
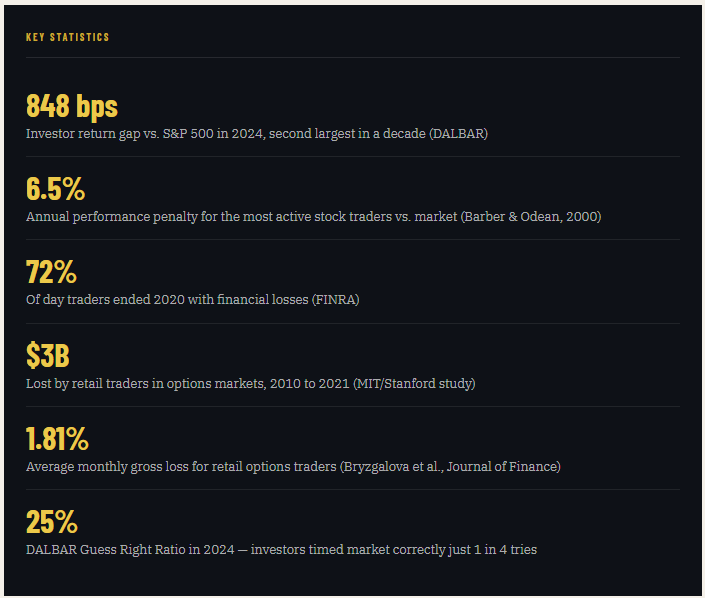
Decades of data across global markets reach the same verdict: the more frequently retail traders trade, the worse they perform. The infrastructure has never been more inviting. The losses have never been more documented. Here are some key statistics we will dive into further.
Retail traders have never had it so easy. Zero commission platforms, options on your phone, social media feeds full of “10 bagger” tips, and a Reddit thread for every stock in the S&P 500. The infrastructure for frequent trading has never been more frictionless, more democratized, or more psychologically seductive.
And the evidence is overwhelming that it is destroying investor wealth at scale.
The data is not subtle. It is not marginal underperformance that can be dismissed as noise. Across decades of academic research, multiple global markets, and every asset class retail traders favor, from stocks to complex options, the conclusion is remarkably consistent: the more frequently retail traders trade, the worse they perform. Not slightly worse. Dramatically, often catastrophically, worse.

Tweet of the Day
New UPDATED Trading Rules With Desktop Printout
“Want to achieve better long-term success in managing your portfolio? Here are our 15-trading rules for managing market risks.”
Please subscribe to the daily commentary to receive these updates every morning before the opening bell.
If you found this blog useful, please send it to someone else, share it on social media, or contact us to set up a meeting.