
Below our Market Trading Update, we share analysis from the Atlanta Fed showing that housing affordability has been at its worst in the last twenty years. This is unsurprising given that potential homebuyers face the highest mortgage rates in 20+ years. Moreover, they must contend with inflated house prices and little housing supply. The news for potential homebuyers is even grimmer when looking at the graph below, courtesy of the Financial Times. Over the last ten years, the average size of existing and new home sales has shrunk by about 10%. So not only are homebuyers, in aggregate, committing almost half of their income to buy homes, but they are getting 10% less than they would have a few years ago.
So, this begs the question: Why is the average square footage of homes for sale declining?
- Affordability: Given the affordability problem, some homeowners are forced to buy smaller houses to cut costs.
- Developers Face Inflation: New home builders are trying to minimize construction costs to keep prices more affordable. Inflation in construction goods has made this a necessity for lower-income housing buildings.
- Demographics: A growing number of single or childless couples want to buy homes. Further, the outsized baby boomer generation is starting to retire and wants smaller homes.

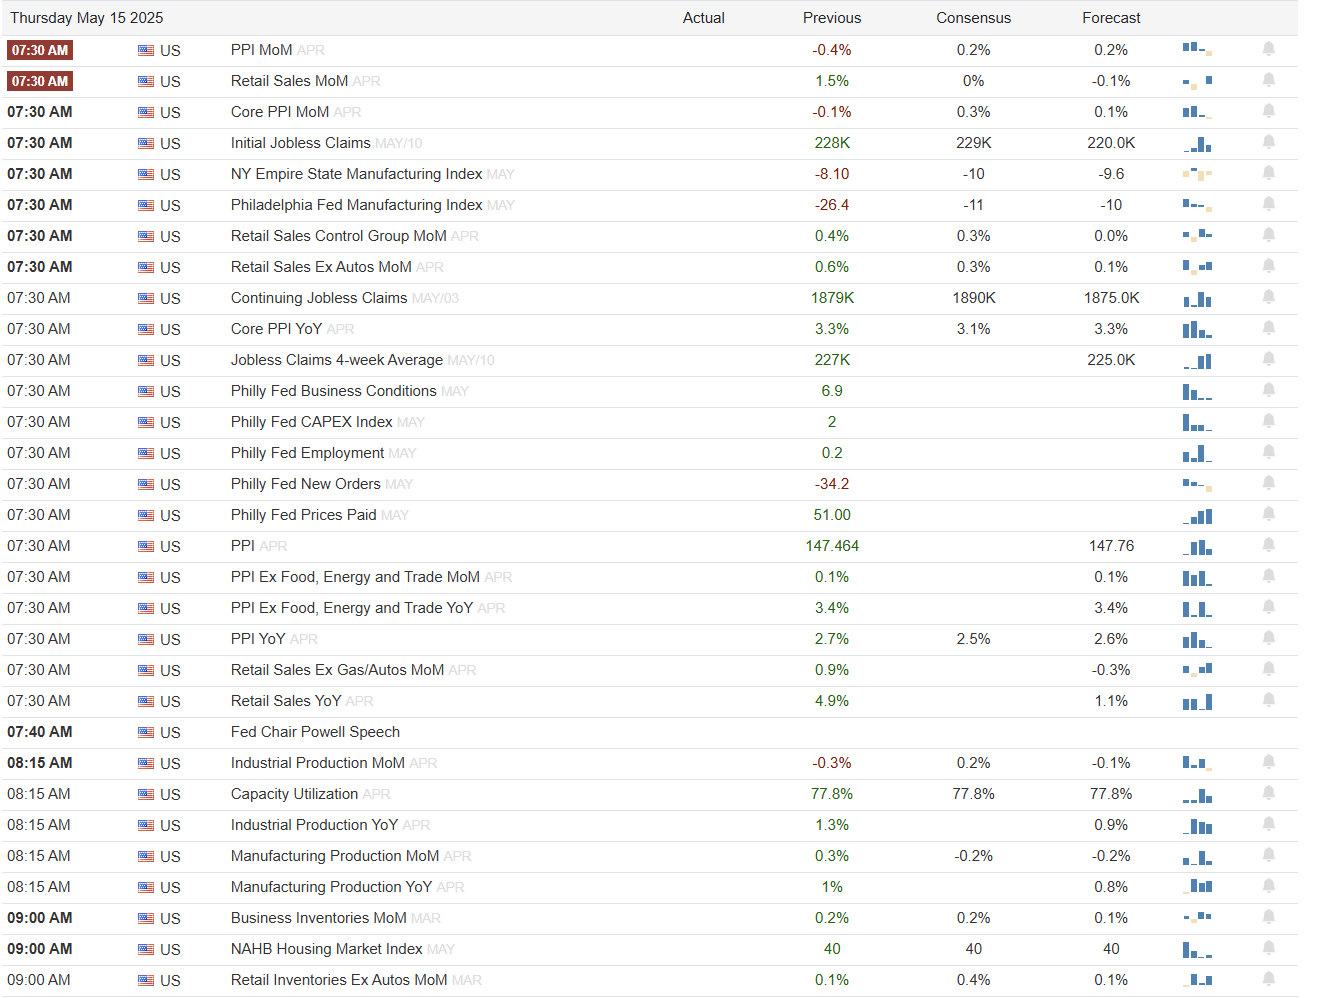
What To Watch Today
Earnings

Economy
Market Trading Update
Yesterday, we noted that buybacks, negative sentiment, and positioning support the recent market rally. However, with markets back to short-term overbought on both a relative strength and momentum basis, where are your entry points on a pullback? We can use trend, support, and retracement levels to define entry points to add equity exposure. However, these levels can also help us determine when the pullback becomes a failed “bear market” rally and lower lows are likely.
As shown, the market has recovered most of its April losses. While it is not uncommon for a market to bottom and rally immediately back to all-time highs, there is a reasonable expectation that the market will take a “pause” before resuming its push higher. As we have discussed over the past few weeks, the market rally has taken out previous levels of resistance at the 50, 100, and 200 DMA, along with those that previously served as support levels during the decline. Therefore, using that same analysis, any “pause” in the advance should find buyers at the following levels.
- The conjunction of the 100 and 200-DMA was also the top of the initial March rally. If the market holds that level and consolidates to work off the overbought conditions, it would provide a decent launch pad for a move from 5900 to 6000.
- A failure at those levels, which would not be surprising, would find initial support at the 23.6% retracement level, followed immediately by the 20 and 50-DMA just below. It is worth noting that the 20-DMA has crossed above the 50-DMA, providing additional support to the market during any pullback. Notably, any pullback to this level of support should have the markets back to decently oversold levels, providing a good entry point to add exposure to equity risk.
- However, a failure at those levels will suggest that the current rally was indeed a “bear market rally” and a more profound decline is forthcoming. Just below the 50-DMA average are the 50% and 61.8% retracement levels. The market should find buyers at those levels, and we would look for the market to start trying to find a bottom. However, the 78.6% retracement level, which coincides with the mid-April pullback, will likely be the absolute bottom. But once we start delving into these levels, something else has gone wrong, so we will deal with that issue if it presents itself.

While there is little reason to be bearish currently, especially with buybacks in full swing as noted yesterday, that does not mean that the market will not have pullbacks along the way. The only thing we want to be aware of regarding risk management is navigating a pullback that allows us to increase risk, versus understanding when “the best laid plans have gone wrong.”
Don’t be overly complacent. There is still an elevated level of risk to the market.

The Atlanta Fed Housing Affordability Index
The Atlanta Fed’s Home Ownership Affordability Monitor (HOAM) Index calculates how affordable housing is based on the median-income household trying to purchase a median-priced home. It compares household incomes to the costs of homeownership, including the mortgage payment, taxes, insurance, and private mortgage insurance. To put the number in context, the Atlanta Fed deems that homes, in aggregate, are unaffordable if the total costs exceed 30 percent of median household income. The index is centered around 100. Thus, an index value below 100 is unaffordable. Conversely, values above 100 indicate affordability.
The first graph below shows that the housing affordability index is at its lowest in 25 years. The second graph shows that it currently takes 46% of median income for homebuyers to purchase a median-priced home.


Recent HOAM data signals persistent affordability challenges. As of August 2024, the national index showed a year-over-year affordability decline of 3.6 percent, milder than the 7.5 percent average drop over the prior year, but still reflecting strain from elevated home prices and mortgage rates. The qualifying income to afford a median-priced home reached $119,640, 40.3 percent above the median household income of $85,255, highlighting a significant affordability gap.
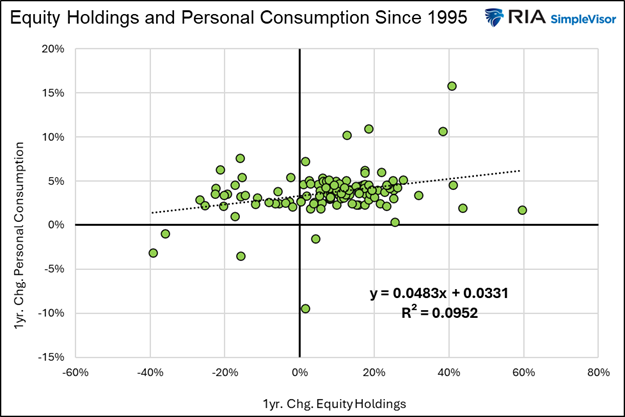
The Wealth Effect Is Not Always Virtuous
Bernanke boasted that by fortifying liquidity in the financial markets via QE and lower Fed Funds, the Fed boosted stock returns and thus greased the wheels of the “virtuous circle.”
Since then, periods of easy monetary policy have correlated well with positive stock market returns. While that relationship is noteworthy, we must also consider the other side of the coin. When the Fed is not providing ample liquidity to the financial markets and stock returns are negative, there must be an adverse wealth effect. Simply, the wheels of Bernanke’s virtuous circle get stuck in the mud.
Accordingly, given the recent market volatility and the possibility of an adverse wealth effect, it’s worth quantifying the relationship between stock returns and economic activity.
Tweet of the Day

“Want to achieve better long-term success in managing your portfolio? Here are our 15-trading rules for managing market risks.”
Please subscribe to the daily commentary to receive these updates every morning before the opening bell.
If you found this blog useful, please send it to someone else, share it on social media, or contact us to set up a meeting.

