
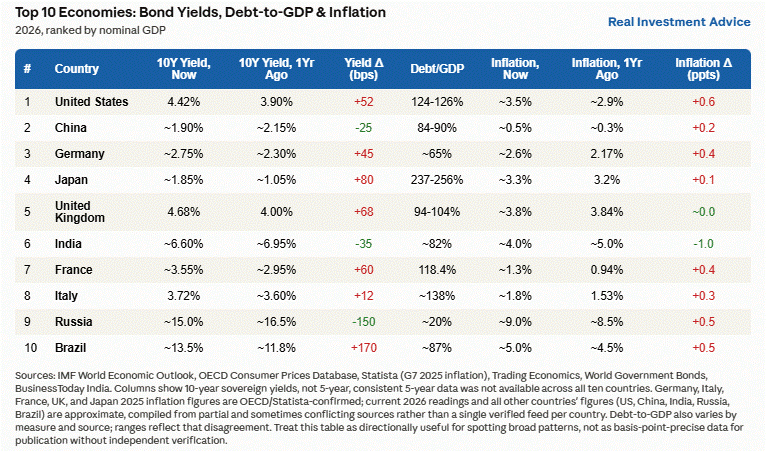
For those worried about the impact of deficits and inflation on US bond yields, it’s worth taking a trip around the world to get a better picture. Global bond yields for many of the world’s ten largest economies are behaving similarly. Across the Globe, the US, Germany, Japan, France, Italy, and Brazil- seven of the ten largest economies- saw both benchmark government bond yields and inflation rates rise simultaneously.
The 10-year Treasury yield has climbed roughly 52 basis points over the past year to 4.42%, while inflation has run near 3.5%, up from 2.9%. UK gilts moved even further, up 68 basis points to 4.68%, with inflation holding near 3.8%. Japan’s yields remain relatively low, but the jump in yields stands out most starkly in percentage terms, more than doubling from roughly 1.05% to 1.85%.
India is the clear outlier, the one major global economy where both bond yields and inflation eased. Indian yields have fallen by roughly 35 basis points as inflation cooled from around 5% to 4%. Russian yields have fallen slightly but remain well above all the other countries listed.
Debt loads and deficits add another layer of complexity to the global rising-yield story. Japan’s debt exceeds 237% of GDP, and every additional basis-point increase in yields raises that country’s financing costs, as it does in the US and other countries. The table below shares global deficit and inflation data, as well as yield changes, to show that what is happening in the US bond markets is generally occurring around the world’s most developed economies.
What To Watch Today
Earnings

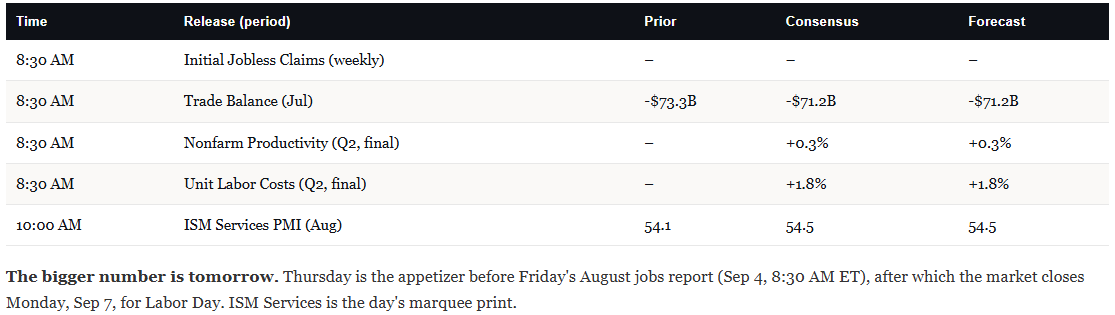
Economy
Market Trading Update
Yesterday, we covered the market testing support as September seasonality, buyback blackouts, and quarter-end repositioning lined up against it. Today, I want to go one level deeper, into why this September downside window carries more teeth than the calendar alone suggests. Scott Rubner at Citadel Securities laid out the case this week, and it is worth your attention.
His point is not that the bull market is over. It is the setup that carried August that is fading cohort by cohort. Retail stays a buyer but historically slows more in September than in any other month. The corporate bid, worth more than $1.1 trillion in fresh buyback authorizations, starts going dark around September 12 as blackouts return ahead of Q3 reporting.
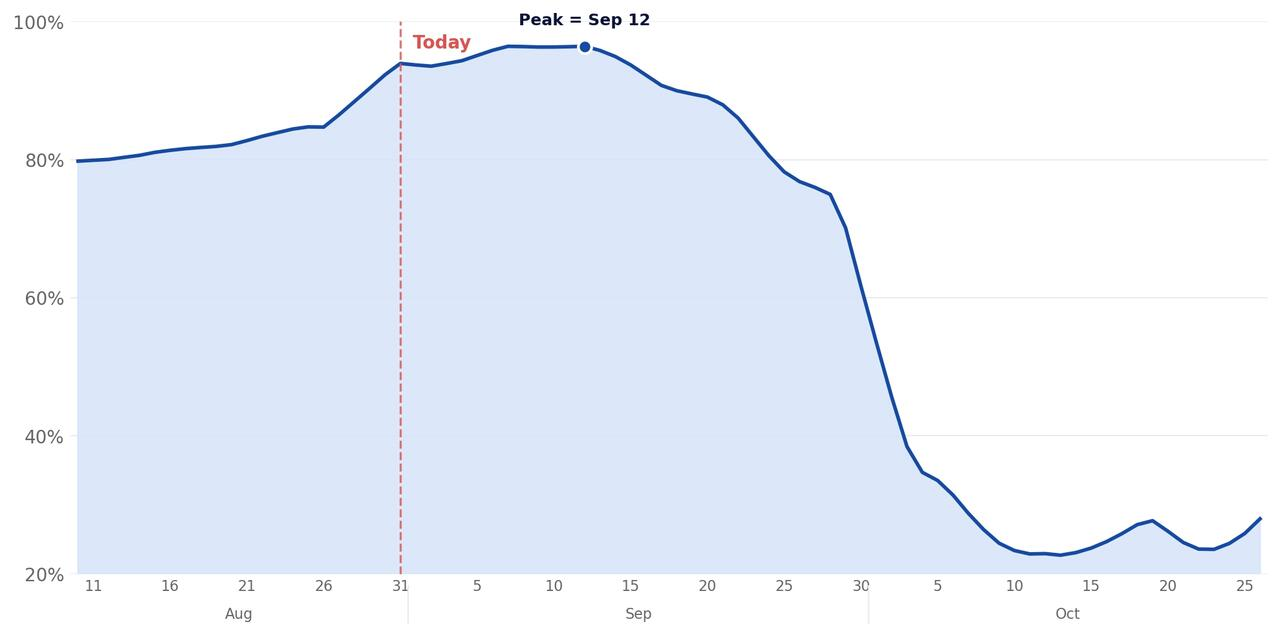
And the systematic crowd, the CTAs and vol-control funds that reloaded off the July lows, has already spent most of its dry powder. When I run the cohorts, the pool of natural buyers is simply smaller than it was a month ago.
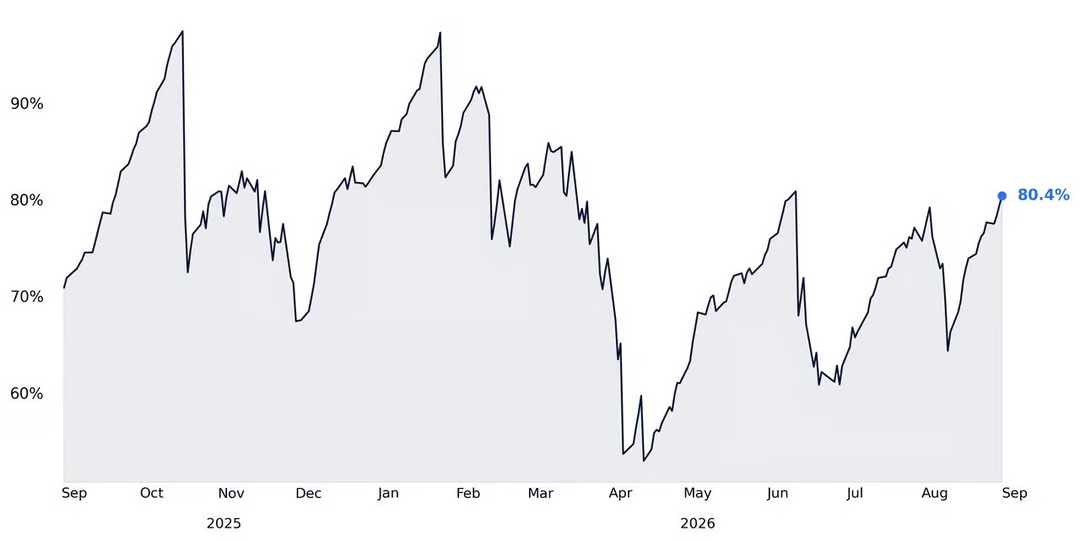
Here is what makes it dangerous: protection is dirt cheap right into the noisiest part of the calendar. The VIX sits near 16, up from the 14.4 close on August 28 that Rubner flags as the second-lowest since December, and puts skew ranks in the first percentile. A garden-variety three-day dip already popped volatility two full points. That tells you how little cushion was priced in.
Anchor it in the tape. The S&P 500 trades near 7,670 as I write, up about half a percent on Wednesday and snapping a three-day skid, yet it sits only 1.4% above its 50-day average near 7,570, and the 14-day RSI reads 52. Neutral. NOWHERE near oversold.
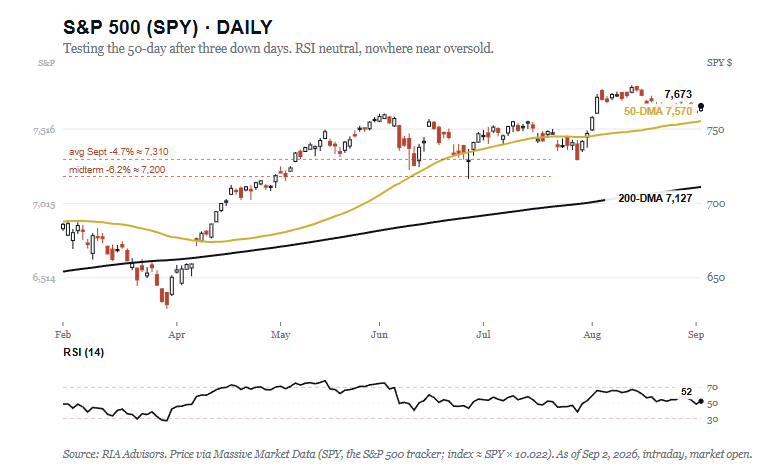
Now the history. Since 1928, September is the only month that closes lower more often than higher, down 1.1% on average and 1.5% in midterm-election years, with the back half the weakest two-week stretch of the year.
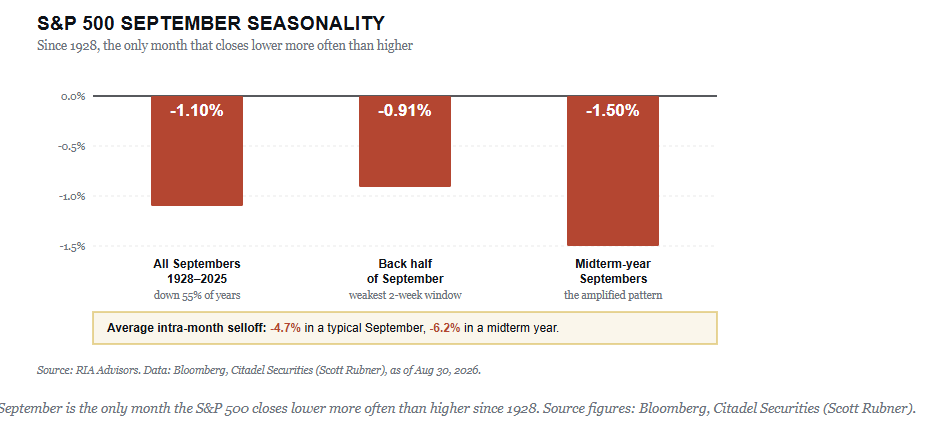
Do the math on Rubner’s numbers. His average September selloff of 4.7% carries the index to roughly 7,310, right through the 50-day. The 6.2% midterm version lands near 7,200, on top of the rising 200-day at 7,127. Neither breaks the bull. Both punish anyone who bought the last leg unhedged.
The market is short-term oversold, so use bounces to rebalance risk and raise cash levels as needed. This is a tactical reset, not a bearish turn. Capital preservation buys the option to be aggressive later. September rarely hands that option out for free.

PwC Data Center Estimates Ignore An Important Caveat
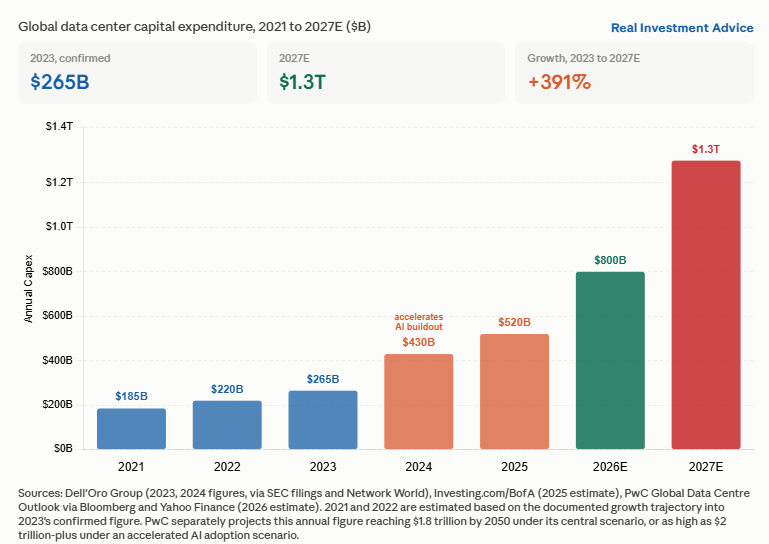
Per PwC, global data center spending is set to reach $31.6 trillion through 2050. Even more optimistically, they note that if AI adoption accelerates beyond their base scenario, spending could rise as high as $50 trillion. That works out to about $1.3 to $2.0 trillion a year. For context, estimates for 2027 AI-related capex sit between $1.2 and $1.3 trillion. While the $31.6 trillion in spending is large in aggregate, it basically assumes today’s massive spending will continue for nearly 25 years. Their forecast is possible, but we think it’s worth asking whether today’s data center infrastructure will be relevant in five years, let alone 25 years. The answer may not affect total spending, but it could strongly influence how that spending is allocated.
Obsolescence risk is the danger that a data center’s physical infrastructure becomes technologically outdated or economically unviable. In this case, smaller, more efficient data centers will likely replace the current ones. This is already occurring. For instance, rack densities have jumped from 8-15 kilowatts historically to 50-100 kilowatts or more for AI workloads, and infrastructure built even five years ago is often no longer fit for high-density AI clusters.
Hyperscalers face a risk of obsolescence, called “obsolescence debt.” Debt may remain outstanding to fund a data center that no longer fits their needs. In such a case, a football-field-sized data center built today for today’s chip generation may require an expensive retrofit or replacement.
None of this means the $32 trillion figure is a poor estimate, but it likely understates how much of that money will be spent tearing out and rebuilding infrastructure that’s already obsolete, rather than adding new capacity.
Market Valuation: Expensive CAPE Or Cheap PEG?
The S&P 500’s Shiller CAPE ratio just hit 41. Since 1881, the market valuation has been more expensive under CAPE only once. That was during the final months of the dot-com bubble. At the same time the CAPE is ringing warning bells, the PEG ratio, which measures price relative to expected earnings growth, is at its lowest level in at least three decades, possibly its cheapest reading ever.
One market valuation says run for cover while another says bargain. Both market valuation tools use data from the same 500 S&P companies but interpret the market completely differently.
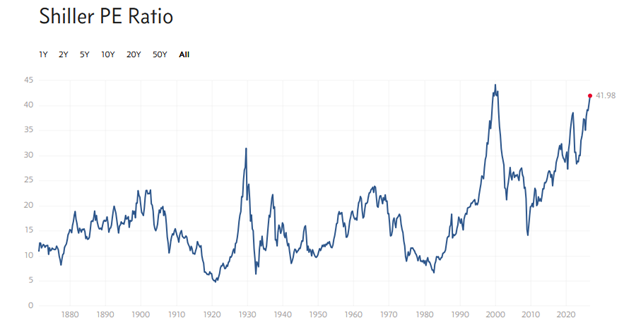
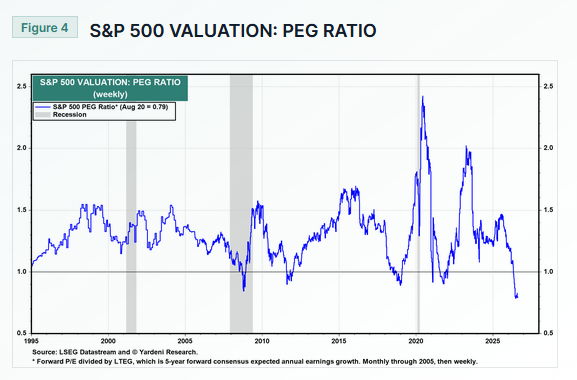
Confusing, yes, but the disagreement between the two charts comes down to one question: Is the past a better predictor of the future than the wisdom of Wall Street?

Tweet of the Day
New UPDATED Trading Rules With Desktop Printout
“Want to achieve better long-term success in managing your portfolio? Here are our 15-trading rules for managing market risks.”
Please subscribe to the daily commentary to receive these updates every morning before the opening bell.
If you found this blog useful, please send it to someone else, share it on social media, or contact us to set up a meeting.