
The BLS reported that payrolls jumped by 162,000, more than tripling estimates of a 50,000 gain. Unemployment held at 4.1%, and wages rose 0.3% for the month. Below, we share a bullish reaction and a more measured one from Wall Street analysts. While helpful to know how analysts view the data, they often contradict one another, creating confusion. Instead, we prefer to know what the world’s largest bond portfolio managers and traders think about the data and how it may impact the Fed and inflation. To understand their view, let’s appreciate what the yield curve tells us.
One month doesn’t make a trend. But for now, the labor market looks steady, not strong, not collapsing – Orphe Divounguy, chief economist at Quantitative Research Group
This is a strong report considering market consensus, and a strong rebound from the previous month. Hourly wages, not a problem. That’s actually positive here. It shows that the labor market is solid. – Peter Cardillo, chief market economist at Spartan Capital Securities
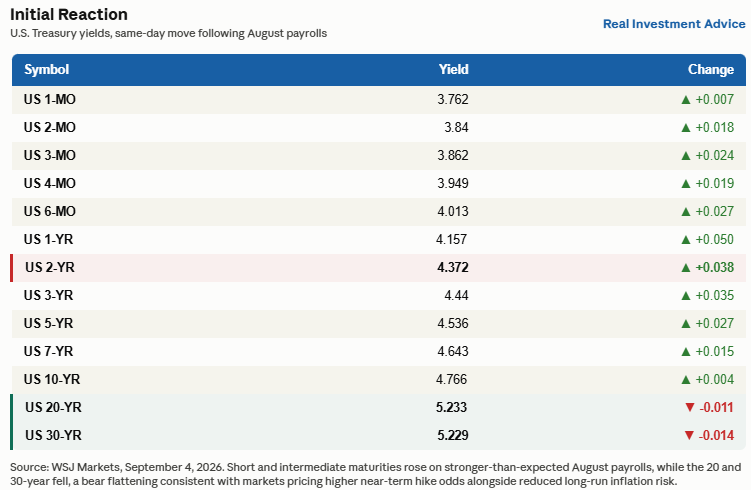
Initial media headlines say interest rates rose on the employment report. While short-term rates did increase, long-term rates were flat or lower. The yield curve tells the full story. As we share below, the 1-year yield jumped 5 basis points, the 2-year rose nearly 4, and the 5-year followed with smaller but still positive moves. That’s the market pricing in higher odds of a rate hike. The strong employment data gives Warsh and other hawks ammunition to raise rates. However, there is more to the story: the 10-year yield was only up marginally, while the 20- and 30-year yields fell.
That divergence- short rates up, long rates down- is called a yield curve bear flattening. The shorter the maturity, the more impact the next few Fed meetings have. The long end cares much more about whether the Fed’s inflation-fighting credibility holds over the long term. Recently, long-term yields had been drifting higher on doubts about the Fed’s resolve. Based solely on today’s yield curve changes, those doubts may have started to ease. Tighter monetary policy now means lower inflation risk later, thus the compensation they demand for holding bonds falls even as near-term hike odds climb.
What To Watch Today
Earnings
Economy
Market Trading Update
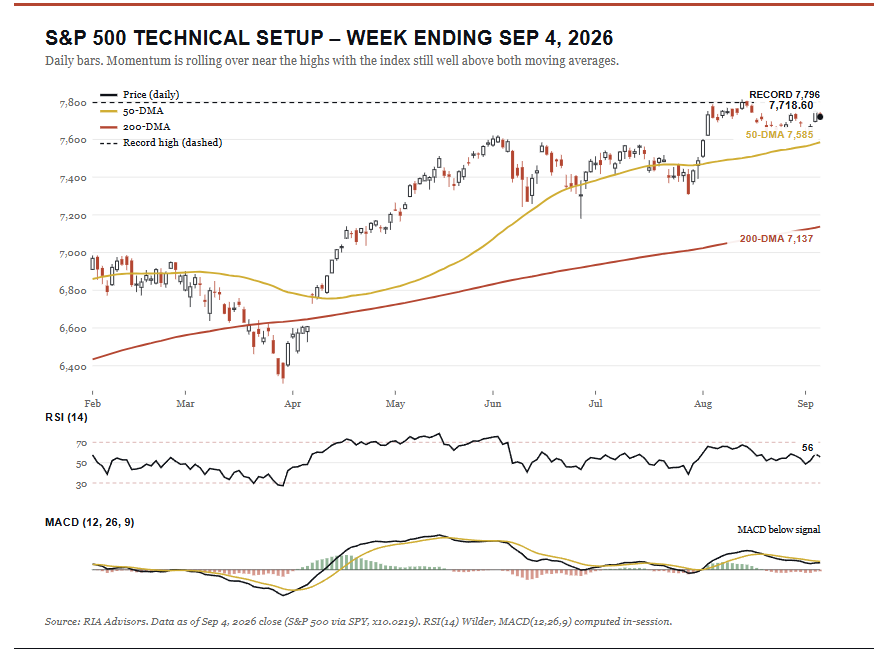
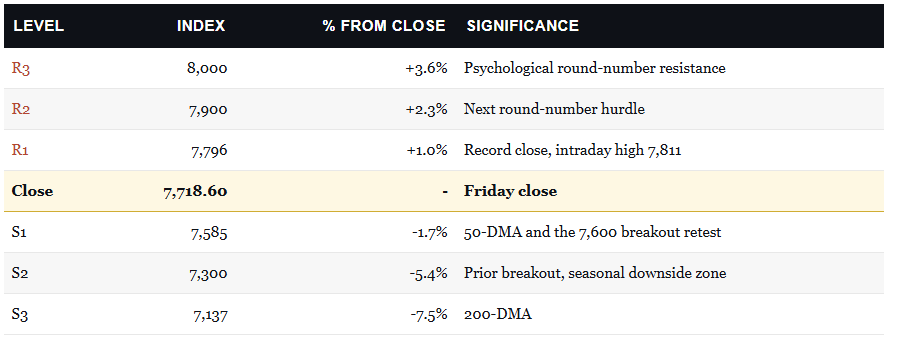
Friday’s close of 7,718.60 leaves the S&P 500 roughly 1% below its record of 7,796 and still comfortably inside its bullish uptrend. The market consolidation this past week certainly weighs on investor sentiment, but the index remains 1.8% above its rising 50-day moving average at 7,585 and 8.2% above its 200-day at 7,137. What does that mean? Well, on the surface, nothing is broken, but underneath, the momentum picture is turning.
From a purely technical perspective, let’s start with the primary oscillators. The 14-day RSI reads 55.7, squarely neutral, but that reading has cooled from the high-50s. However, that leaves the index with no oversold cushion. With that said, there is downside risk into next week.
Furthermore, the bigger tell is the MACD, which rolled over and crossed below its signal line this week, the first real momentum warning the daily chart has flashed since the summer advance began. Neither signal is a sell trigger on its own. However, together they say the easy upside is likely behind us for now.
Lastly, overall market breadth tells the same story, but with a bit louder voice. Seven of eleven sectors fell in the last week, while the index finished flat. Discretionary, industrials, and materials led the retreat while a narrow band of energy and megacap technology held the line. In other words, while the market headline suggested everything was fine, the average stock did worse. That is the “musical chairs” tape we will dig into in detail in this week’s main story. Leadership is rotating rather than broadening, and that is exactly the kind of internal deterioration that tends to precede a real pullback.
So, what does this mean for your portfolio this coming week? First, the support and resistance levels are clean. The first resistance is the record at 7,796, about 1% away. Just above that are the round numbers at 7,900 and 8,000. (Those are year-end targets that sit just above previous all-time highs. Conversely, support starts at the 50-day near 7,585. That level also marks the breakout that a failed retest would expose. Just below that level is the 7,300 zone, then the 200-day at 7,137, the same downside band the seasonal math points toward.
With that setup going into next week, we will want to continue playing defense rather than offense. Next week, we will likely make further risk adjustments in portfolios, particularly a potential reduction to the technology and semiconductor weights we discussed previously. Secondly, investors should consider increasing cash buffers keep stops under the 50-day. Lastly, use any push toward the record market levels to trim rather than chase.
To be fair to the bullish camp, a decisive close back above 7,796 would neutralize the momentum warning and reopen those round-number targets. There are several risks ahead, from the mid-term election cycle to the loss of corporate buybacks, so this is a two-sided setup rather than a directional call. However, pay close attention to the 7,585 next week. If the market can hold that level, the uptrend will remain intact. If it fails, the seasonal downside window opens wide

The Week Ahead
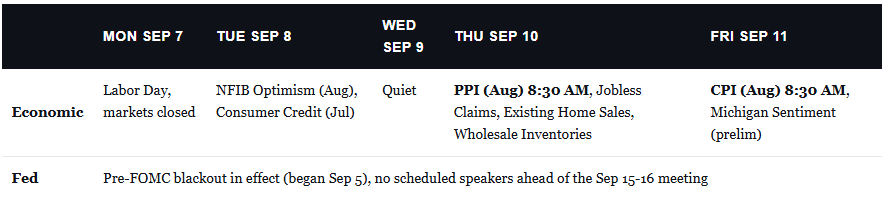
With Friday’s strong employment report bolstering the odds of a Fed rate hike, the market will turn its attention to inflation, the last key data point that will feed into the Fed’s rate decision on September 16th. On Thursday, headline PPI is expected to climb by 0.3% and 0.2% excluding food and energy.
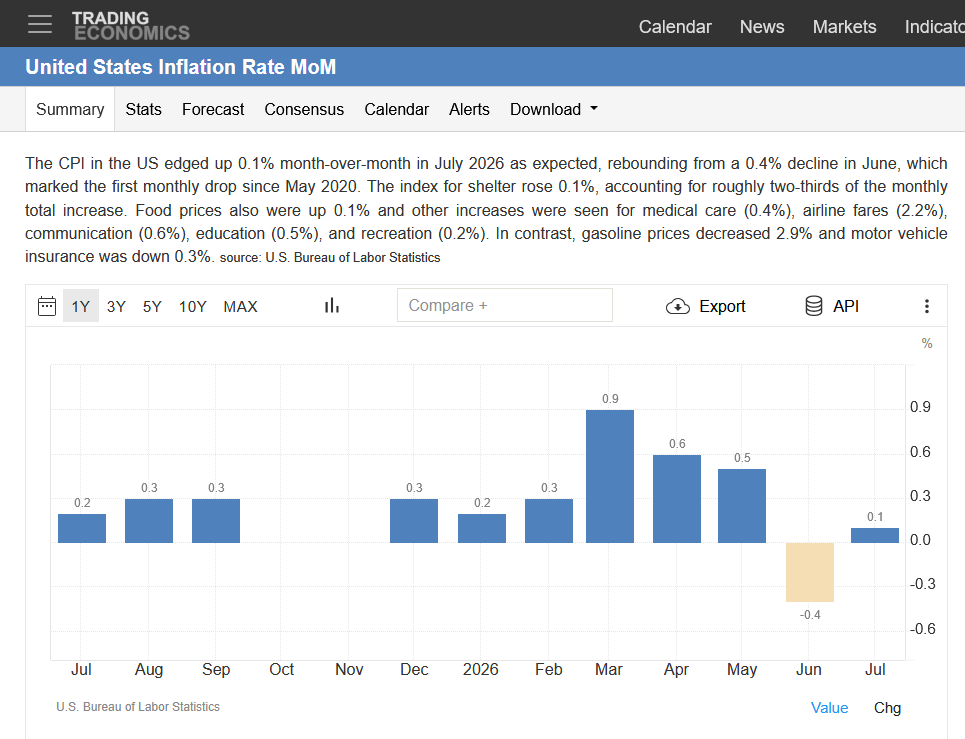
More importantly, Friday’s headline CPI is expected to climb 0.4%, while core rises 0.2%. Because of volatility in energy prices, the market will likely take its cue from Core CPI. A reading of 0.2% or lower would keep core CPI in line with inflation prior to the Iranian conflict. Importantly, that would represent the fourth month in a row of 0.2% core CPI or less. That might provide some comfort to the Fed that the spike due to Iran is not feeding into other prices.
Due to oil prices, headline CPI data has been more volatile than core CPI. While the expected +0.4% headline CPI figure is high, the three-month annualized inflation rate would be near zero. That said, the three-month trend would not be favorable: -0.4% to +.01% to the expected +0.4%, as shown below.
AI Bears: Right About The Excess, May Be Wrong About The Trade
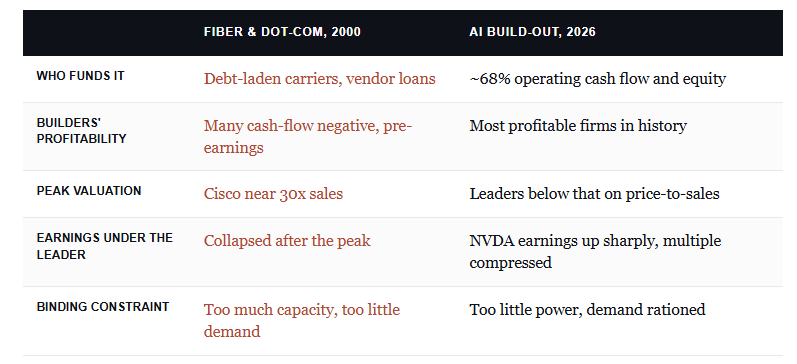
With more than half of managers now calling AI a “bubble” and “long the Magnificent 7” ranked the most crowded trade on the Street for nearly two years, the consensus has already tilted bearish. That does not make the AI bear case wrong, but it does suggest the obvious crash may refuse to arrive on the obvious schedule.
One of my favorite quotes from Howard Marks is that “being too far ahead of your time is indistinguishable from being wrong.” When it comes to investing, timing is critical. Most importantly, notice that Hickey himself holds his AI-bear book at roughly 1% of his portfolio in puts, suggesting he treats it as a hedge rather than a conviction short. That is the posture worth borrowing. Own the compounders, hedge the tail, and let the revenue prove or disprove itself on the tape.
The AI bears will eventually be right about a drawdown, because everyone is eventually right about a drawdown. Whether they are right about the trade depends on a question their favorite analogy cannot answer:
“What happens when the richest companies on earth overbuild with their own money rather than borrowed money?”
Such is the question actually on the table.

Tweet of the Day
New UPDATED Trading Rules With Desktop Printout
“Want to achieve better long-term success in managing your portfolio? Here are our 15-trading rules for managing market risks.”
Please subscribe to the daily commentary to receive these updates every morning before the opening bell.
If you found this blog useful, please send it to someone else, share it on social media, or contact us to set up a meeting.