
According to a recent analysis by the Wall Street Journal, corporate treasurers are fundamentally shifting how they approach the capital markets to navigate record-breaking supply. Rather than offering debt in monolithic blocks, firms are increasingly utilizing multiple corporate debt tranches to better manage investor demand. This strategic shift has pushed the average number of pieces per deal to an all-time high of 3.3.
The rise in corporate debt tranches is a direct response to the staggering $632.3 billion in issuance already this year, the fastest start on record. By breaking massive deals into “bite-size” offerings with maturities ranging from 2 to 50 years, companies can simultaneously appeal to a wide spectrum of the market. For instance, pension funds seeking long-term liability matches can target 40-year notes, while shorter-duration funds soak up the two-year paper.
Beyond expanding the buyer pool, the primary advantage of corporate debt tranches is pricing efficiency. Smaller, targeted segments allow underwriters to fine-tune credit spreads with surgical precision. By avoiding the need to widen spreads to attract a single “marginal investor” for one massive block, bankers can land on tighter pricing, generating significant interest savings for the borrower.
As technology giants continue to tap the markets to fund massive AI and digital infrastructure, the reliance on corporate debt tranches is likely to accelerate. In a market defined by heavy supply, the ability to slice and dice debt is essential for optimizing capital costs in an evolving yield environment.

What To Watch Today
Earnings

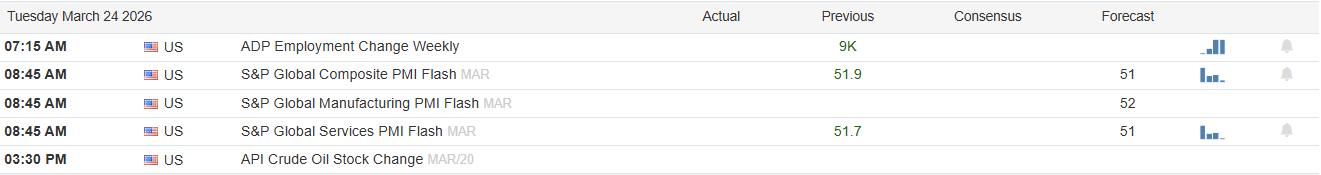
Economy
Market Trading Update
Monday’s bounce felt good, after four consecutive weeks of grinding losses that shaved roughly 8% off the S&P 500 from its February highs. As discussed yesterday, the market was technically oversold and due for a reflexive rally; it just needed a spark. The sharp surge at the open is the kind of move that makes investors want to believe the worst is behind them. I understand the impulse. I just don’t share it yet.
The catalyst was simple: President Trump announced a five-day pause on strikes against Iranian energy infrastructure, citing what he called “constructive talks” with Tehran. On that news, Brent crude initally cratered more than 10% to just above $100 a barrel, yields pulled back, and risk assets ran. However, there are still a lot of risks to what could happen over the next few days, particularly as Iran says that “talks with the US are not true.”
- Iran Foreign Ministry + Parliament speaker say no talks have happened, after Trump said “speaking with a top person in Iran”, says will “just keep bombing” if Iran talks fail
Further headlines also suggest future risk.
- Trump says Hormuz will be “jointly controlled”
- Israel is not seeing an imminent end to the war, and plans to continue operations while avoiding energy assets, an Israeli official said. US says Israel “will be pleased”
- Iran publishes broad list of potential regional targets: threatens “the entire region will go dark.”
- IEA Executive Director warns of 1970s level oil shocks: “No country will be immune to the effects of this crisis if it continues to go in this direction.” Russia mediates in call with Tehran.
Here is the point. The market bounce yesterday morning was not surprising after the sell off we have witnessed as of late. We have suggested that rallies could be sharp and should be used to rebalance risk. We still think that is the case, particularly since Tehran immediately denied that any talks occurred. If yesterday’s rally was built on a five-day ceasefire promise from one side of a conflict, disputed by the other, the risk premium could be priced back in quickly. We’ve seen this script before. The market bounced on March 4 when oil pulled back briefly, then reversed when the conflict dynamics reasserted themselves. One session doesn’t retire a trend.
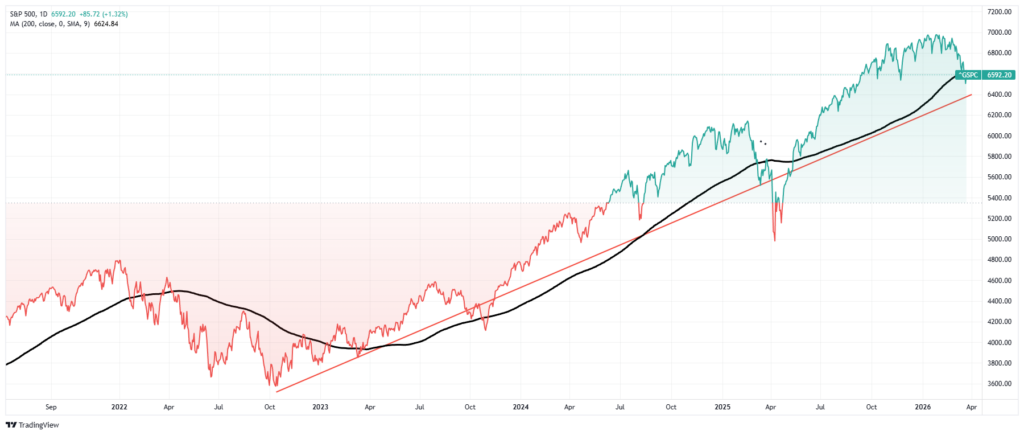
Technically, the S&P 500 remains below its 50-day and 200-day moving averages. Breadth improved Monday, which is constructive, but a single broad-based day of buying doesn’t confirm a floor. We need follow-through, and that follow-through has to survive the back half of the week when the Iran narrative either holds or unravels. However, for now, the market does remain above its longer-term trend line, so this remains a correction in an uptrend for now. But risk is rising the longer that the market remains below the 200-DMA.
How to trade the next few days as Q1 closes:
- Don’t chase Monday’s gap. If you missed the opening move, the risk-reward of buying Tuesday’s open is poor given the unconfirmed Iran narrative.
- Trim into strength. Use this rally to reduce positions that are still underwater from February. The bounce gives you a better exit than you had Friday. We raised an additional 4-5% cash yesterday.
- Watch crude as your leading indicator. If Brent holds below $105, equities have room. If it reclaims $110, expect the risk-off trade to return fast.
- Rebalance, don’t reallocate. Q1 ends March 31. Use this week to rebalance portfolios back to target weights, not to make new directional bets in a headline-driven environment.
- Keep cash elevated. A confirmed bottom requires retesting, ideally on lower volume and with momentum divergences. We haven’t seen that process begin.
Q1 closes out with a bruised market, elevated uncertainty, and a geopolitical overhang that five days doesn’t resolve. Monday was a much-needed exhale, but whether it’s the start of a recovery or a better selling opportunity becomes clear by Friday.

And Then There Was One
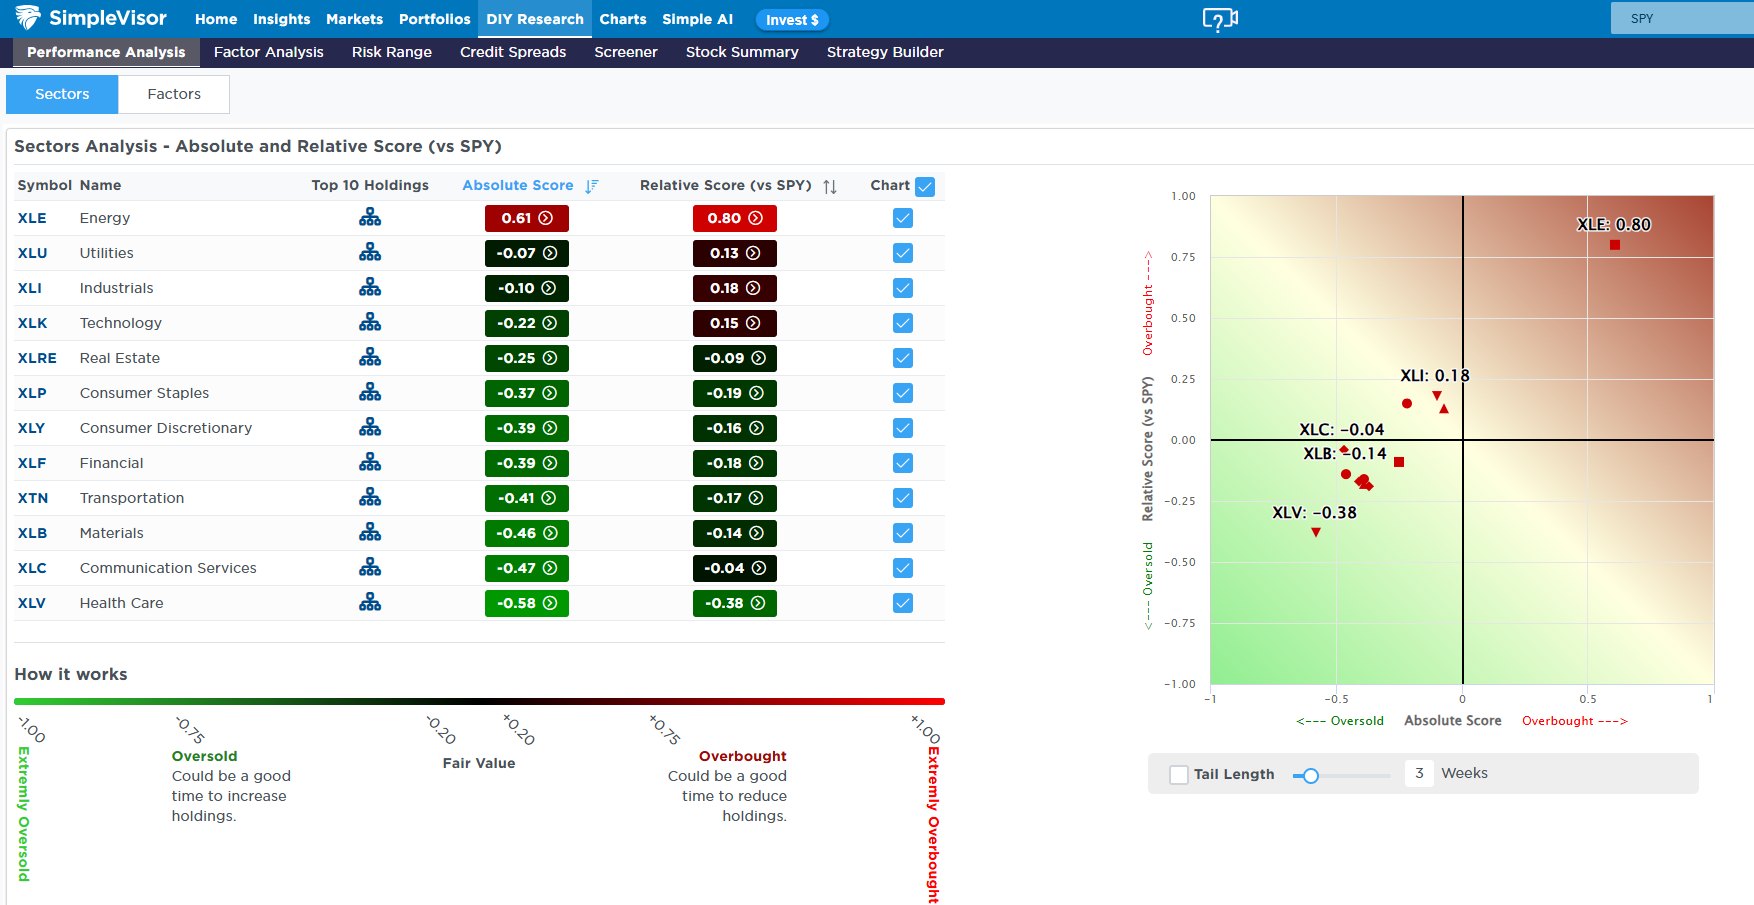
The S&P 500 fell 1.75% over the past week, but it was down nearly 2.8% at its lowest level. The escalating conflict with Iran diminished hopes of a dovish Fed amid elevated energy prices. Accordingly, real estate and utilities, both rate-sensitive sectors, left the top-right quadrant. The first chart below shows that only the energy sector remains with a positive absolute and relative score.
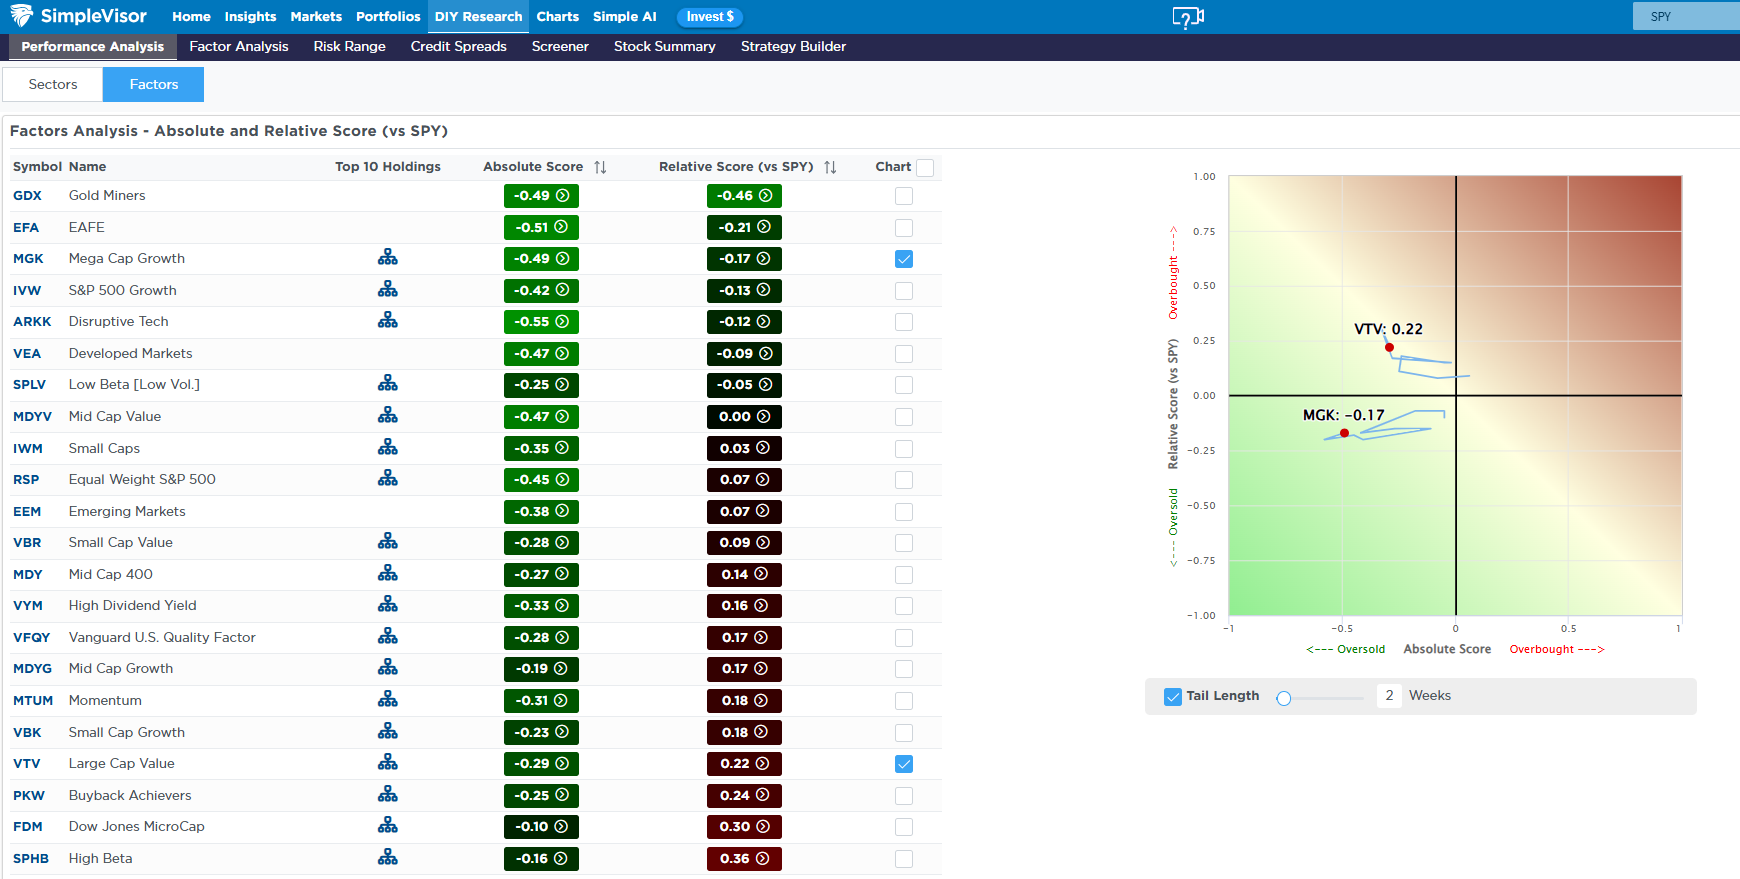
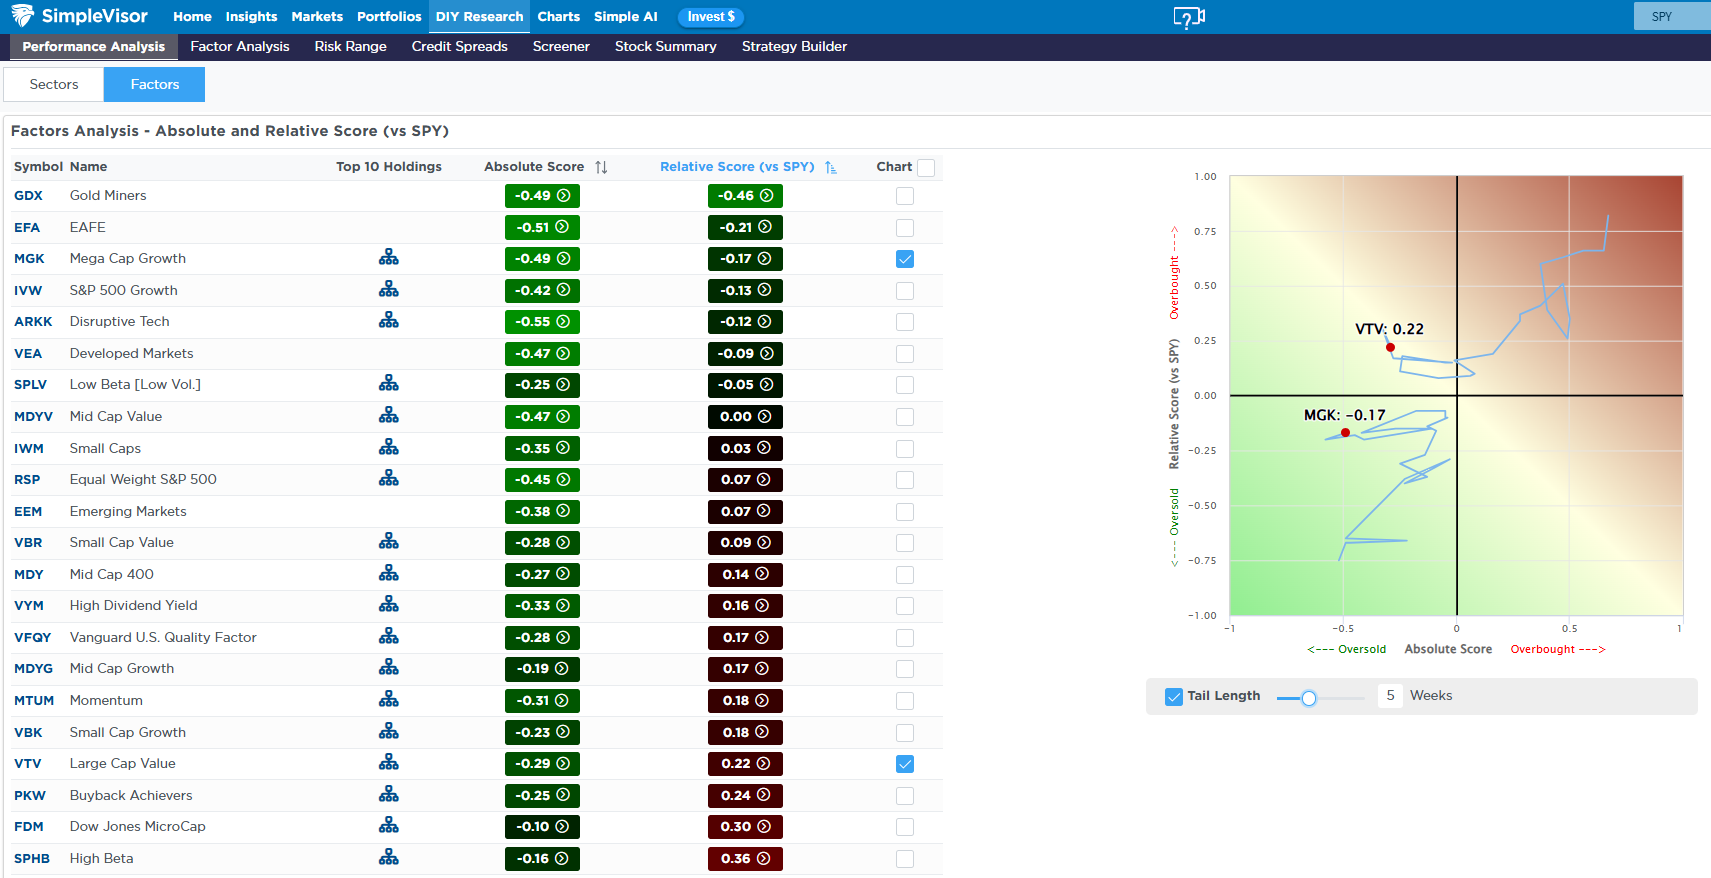
Turning to the factors, the second and third graphics illustrate a concept we have already discussed a few times this year: the value/growth rotation. Looking at the second graphic, we see that there hasn’t been much rotation over the past two weeks. However, a clear trend emerges if we zoom out to focus on the past month, as shown in the third graphic. On a relative basis, growth has increased from oversold to fair value. Meanwhile, value has declined from overbought to fair value. Just like stocks often experience a consolidation phase after a sharp rally, so too do factor rotations after a big move. The last two weeks are likely a temporary consolidation phase before the rotation back to growth continues in earnest.
The 200-DMA Just Broke: What Every Investor Should Know
Since 2000, we have identified 7 instances in which the S&P 500 broke below its 200-DMA on a sustained basis. The most notable, shown in the table below, were the Dot-com crash in 2000 and the Financial Crisis in 2008. However, there were several other, more “minor,” at least compared to the first two events, that occurred. The EU debt scare in August 2011 and the China and oil shock in August 2015 were fairly short. Following those were the Q4 2018 rate scare and the COVID crash in February 2020. In both cases, the Federal Reserve interventions reversed the break rather quickly. The longer-lasting event was the inflation cycle that began in January 2022, which lasted 9 months.
The performance numbers across those seven events are unambiguous. The average one-month return after the break: -5.3%. The average 12-month return: -4.0%. Not a single one of those seven events posted a positive first-month return. Zero for seven. Investors who bought the initial 200-dma break in 2000 and 2008 were still underwater two full years later.

Tweet of the Day

“Want to achieve better long-term success in managing your portfolio? Here are our 15-trading rules for managing market risks.”
Please subscribe to the daily commentary to receive these updates every morning before the opening bell.
If you found this blog useful, please send it to someone else, share it on social media, or contact us to set up a meeting.

