
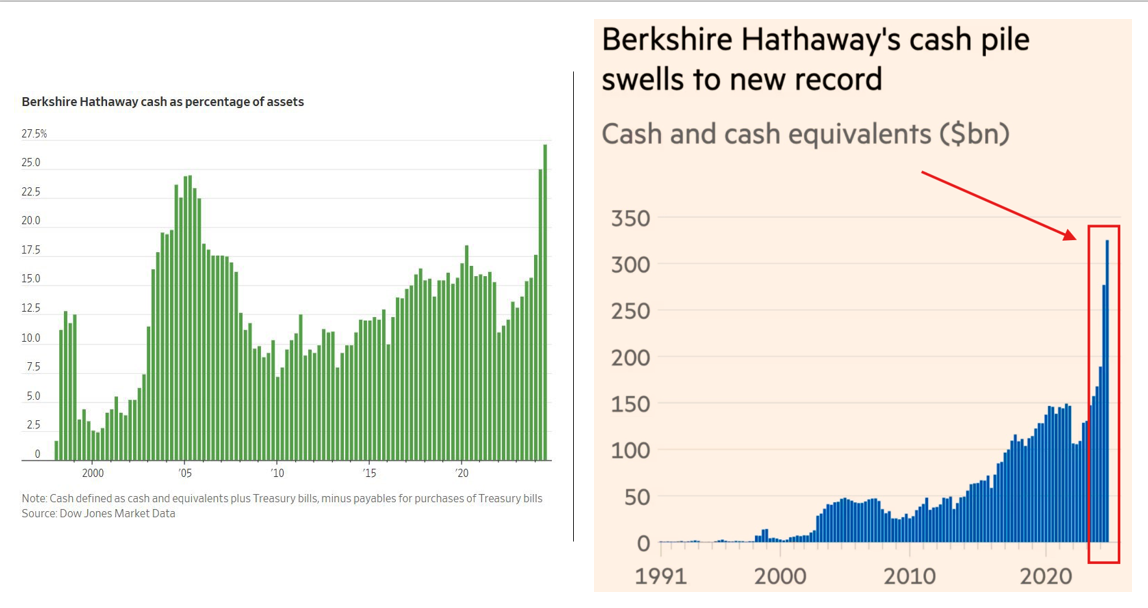
In its annual letter to shareholders this past weekend, Warren Buffett’s Berkshire Hathaway announced that it had increased its cash holdings to $334 billion. As the Financial Times chart on the right shows, Berkshire’s cash balances have more than doubled over the last few quarters to its highest level. Additionally, cash as a percentage of assets, graphed on the left, shows it now holds more cash as a percentage of its portfolio than before the 2008 financial crisis. Warren Buffett must think stocks are expensive, and thus, he prefers the Treasury market’s safety and relatively high yields.
Another interesting fact from the report is that for the second quarter in a row, despite its massive cash holdings, Berkshire did not buy back its stock. Buffet has previously stated that companies should not buy back stock when its price exceeds its intrinsic value—more simply, when it’s expensive. Further supporting that opinion, his favorite market valuation metric, market cap to GDP, is at a record high level.
Lastly, was the following line from the report:
“In 2024, Berkshire did better than I expected though 53% of our 189 operating businesses reported a decline in earnings.”
This fact further confirms that only a few of the largest-cap stocks are driving market earnings growth. Consequently, many S&P 500 stocks have negligible or negative profit growth.
What To Watch Today
Earnings

Economy

Market Trading Update
Yesterday, we commented on Friday’s retest of the 50-DMA. More importantly, the short-term sell signal was triggered, which may temporarily put pressure on the market. This week, Nvidia’s (NVDA) all-important earnings report will likely make or break the market. Given the rush into equities by retail investors, there is a reasonable risk of disappointment, which could lead to lower markets. The risk now, if markets do decline, is the triggering of our longer-term money flow indicator.
As shown, three components comprise the more crucial weekly signal. The bottom two weekly MACD indicators registered sell signals from decently high levels. While the market has not yet confirmed those sell signals, the negative divergence between the market’s momentum and the market itself is noticeable. Secondly, the most important trigger is the moving average crossover of the short and long-term indicators. While that trigger has not occurred yet, which would warrant a more considerable reduction in portfolio equity risk, the risk is increasing. While there is no guarantee that the three measures will trigger, given the length of the current advance and the more narrow trading range of late, that risk is building.
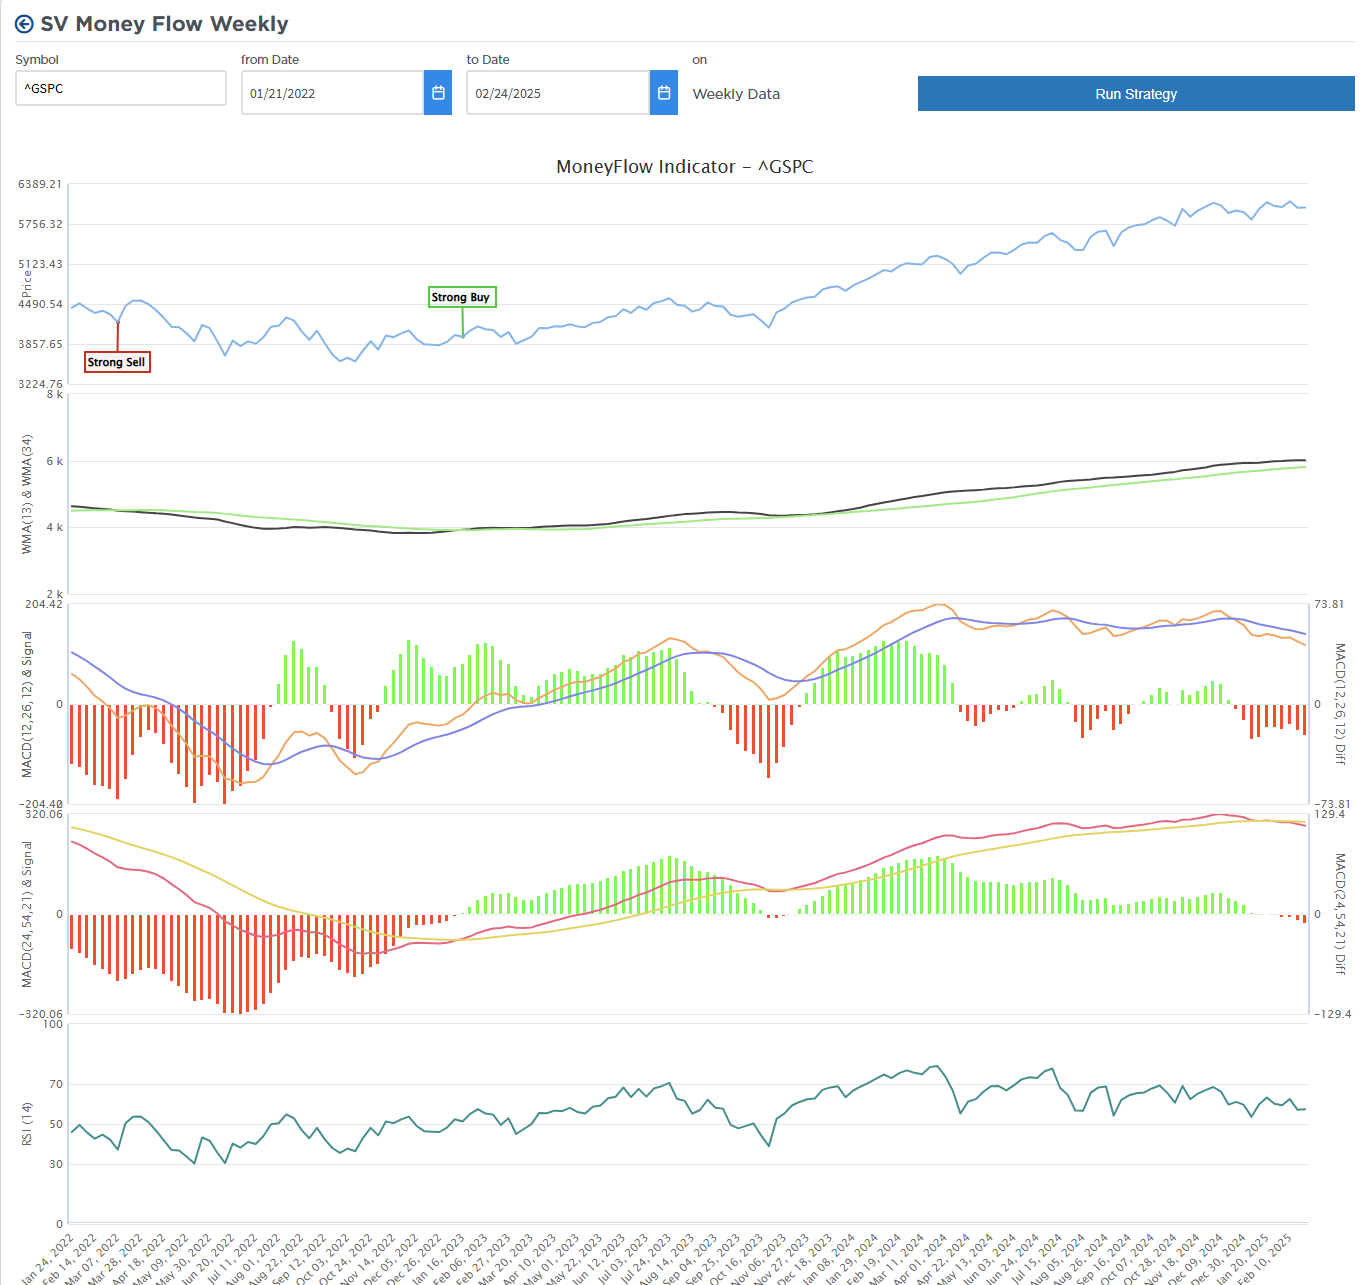
While no single indicator is perfect, the weekly indicators have a good track record of helping investors avoid capital losses when all three are aligned. Could this time be different? Sure. However, given current market dynamics, increasing leverage, and weakening economic data, the need for being more cautious about risk exposure is clearly increasing.

Microsoft Refutes Data Center Claim
Last Friday, some of the energy infrastructure stocks took a hit on claims that Microsoft would cut its planned spending on data centers. Consider the following from Bloomberg:
Microsoft, $MSFT, has begun canceling leases for a substantial amount of datacenter capacity in the US, a move that may reflect concerns about whether it’s building more AI computing than it will need over the long term.
On Monday morning, during an investor road show in Australia, Microsoft seems to be refuting the claims. The following is a summary from Jefferies:
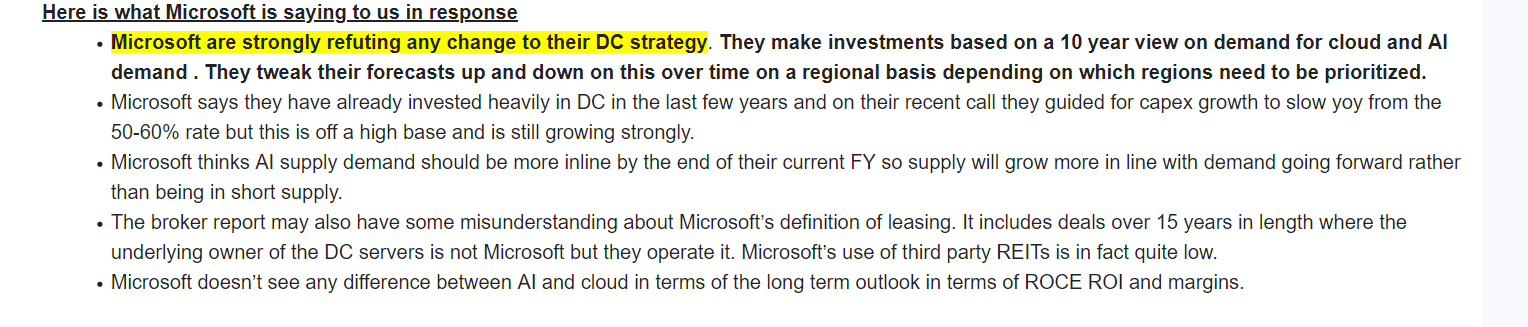
Furthermore, the company states:
While we may strategically pace or adjust our infrastructure in some areas, we will continue to grow strongly in all regions. Our plans to spend over $80B on infrastructure this FY remains on track as we continue to grow at a record pace to meet customer demand.
As we show below, the news implying weaker cloud demand has pushed MSFT shares to a key support line. This occurs with its MACD at low levels and possibly nearing a buy signal. Furthermore, its RSI is low, albeit not at “washed-out levels.”

Large Cap Value Stocks
A trend developed this year that is worth discussing. On Tuesday’s Daily Commentary, we discuss the most oversold or overbought sectors and factors using SimpleVisor relative and absolute analysis. The rationale is to assess how the underlying groups within the broader market behave versus each other and the market. Accordingly, this helps us anticipate sector and stock factor rotations.
This year, several sectors and factors have rapidly rotated from overbought to oversold. Therefore, it’s been tough to nail down a sector or factor to buy for consistent outperformance. However, on the SimpleVisor home page (as shown below), we point out another one of our tools that has been very clear about which types of stocks are leading the way. As we share below, large-cap value stocks have outperformed the other fundamental classes of large, mid-, and small-cap stocks over all periods this year. Large-cap value excludes more volatile stocks within the S&P 500 and S&P 500 growth ETF. These include META, NVDA, TSLA, and Google. Other stocks, such as AAPL, XOM, PG, and BRK.B, have a higher weighting than the S&P 500.
The takeaway from the analysis is that investors seem to be gravitating toward value but within the large-cap sector. Thus, they are not ready to reduce market exposure, but they seem to be taking on a more conservative stance.

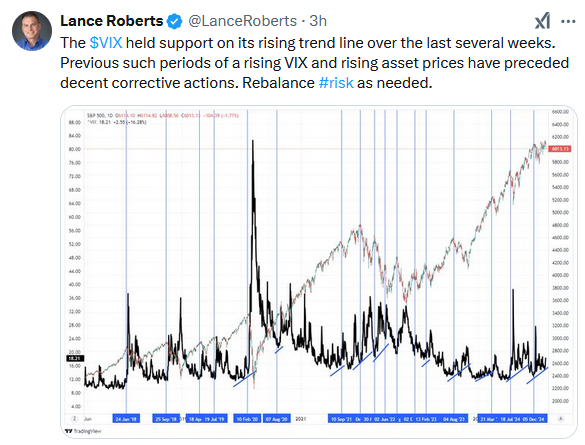
Tweet of the Day
“Want to achieve better long-term success in managing your portfolio? Here are our 15-trading rules for managing market risks.”
Please subscribe to the daily commentary to receive these updates every morning before the opening bell.
If you found this blog useful, please send it to someone else, share it on social media, or contact us to set up a meeting.

