
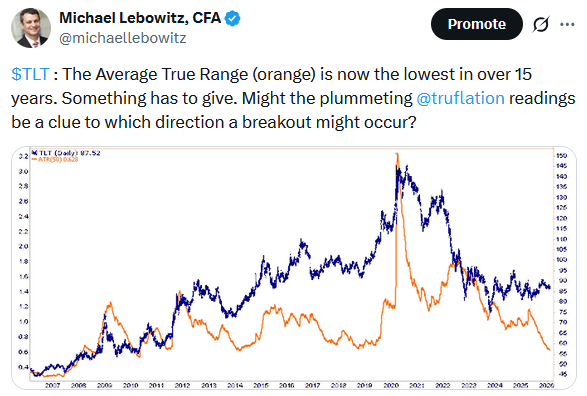
The top graph below, courtesy of Bloomberg, shows that the price of TLT, the 20+ year Treasury bond ETF, has been drifting sideways for the last couple of years. Often, when a security trades in a tight range over an extended period, as we see with bonds currently, a breakout from the range can be strong. Accordingly, we present five factors suggesting a significant breakout could favor higher prices and lower yields.
- As we share in the Tweet of the Day, the average true range (ATR) on TLT, which measures the average daily difference between each day’s high and low over 50-day periods, is at its lowest level since 2010. The range is extremely tight; thus, the odds increasingly favor a breakout.
- The bottom graph below, courtesy of Bloomberg and Bianco Research, shows that the short position on TLT has been steadily climbing over the last few years. If these short traders need to cover their positions, their purchases could send bond yields much lower.
- While job growth continues, the employment situation is weakening. The ratio of job openings to the number of unemployed people is now below 1.0, the lowest level since 2021. Weak employment should cool the economy and inflation, pushing yields lower.
- As we have noted in a few recent Commentaries, the Truflation real-time inflation index is plummeting. Given the strong correlation between bond yields and inflation, this index portends much lower bond yields.
- Fannie Mae and Freddie Mac are buying mortgages again. This will remove fixed income supply from the market, providing a bid for all bonds.

What To Watch Today
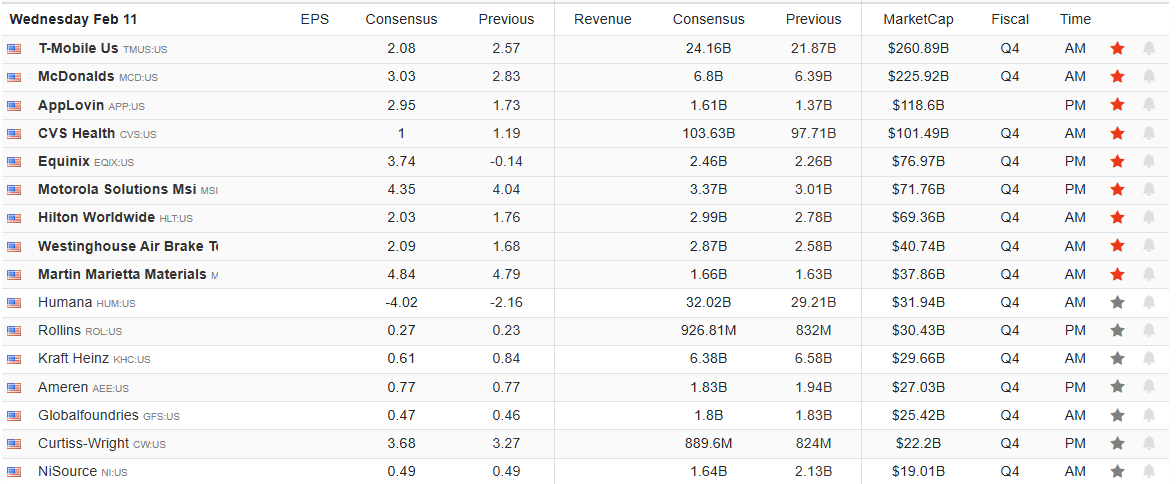
Earnings
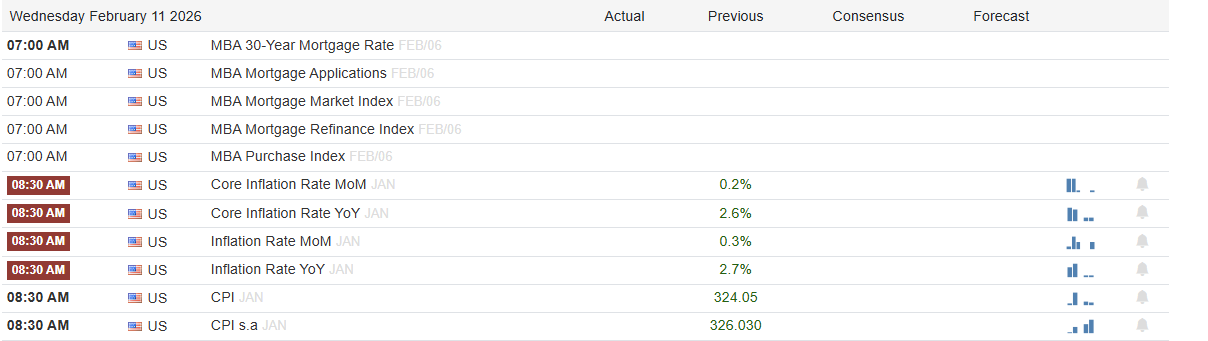
Economy
Market Trading Update
Yesterday, we discussed the improved valuations of the big technology stocks that have been overlooked by the “everything is going to crash” crowd. While “perpetual doom” certainly attracts clicks and views, as investors, our job is to capitalize on market misalignments. Speaking of narratives, another is on the rise as of late, suggesting that “bitcoin is going to zero.” For example:
“Well, I think eventually it will be at zero…” – Peter Schiff
Of course, this is coming from the guy who, over the last 20 years, has repeatedly stated that everything will crash and go to zero… except for gold, of course, which you can buy directly from him. But let’s discuss this a bit further.
Bitcoin trades with high volatility. As shown in the chart below, while early investors made a lot of money in Bitcoin over the years, it has been a nauseating ride at times. However, sharp drawdowns define the asset, and volatility alone does not imply a path to zero. (50-80% drawdowns are not for the faint of heart.)

It is humorous that when Bitcoin is rising, investors say prices can only go higher, but when it falls, it is going to zero. In reality, a move to zero requires a collapse in network function, user demand, and security incentives simultaneously. So far, history shows repeated price collapses without network failure. Bitcoin’s continued block production through every major bear market since 2009 continues, and that operating record matters. Functional networks with global settlement utility rarely drop to zero even as usage persists.
Furthermore, the Bitcoin network operates on a “proof-of-work” basis, where miners commit capital to energy and hardware, and those costs force rational behavior. Therefore, when the price falls, inefficient miners exit, difficulty adjusts downward, and the remaining miners continue securing the chain. This adaptive design prevents a death spiral. As Fidelity Digital Assets noted in a 2023 report,
“Bitcoin’s incentive structure aligns security spend with market value, allowing the network to survive periods of stress.”
In other words, security responds to price and does not disappear unless participation disappears, and for now, participation continues.
Demand and innovation also show durability beyond speculation. Stablecoins are on the rise and are enabling real-time global transaction settlement. That function attracts users in unstable monetary systems and capital control regimes. BlackRock wrote in a 2024 research note, “Bitcoin represents a unique monetary network with no sovereign issuer and a fixed supply schedule.” Assets with differentiated utility tend to retain a residual value even during long bear markets. While demand can compress, it does not tend to vanish.
Another support for Bitcoin, and cryptocurrencies in general, is that the market structure has changed. Bitcoin trades across regulated exchanges, futures markets, and exchange-traded funds, has institutional custody and clearing, and reporting now exists. Furthermore, liquidity did not vanish during recent drawdowns as risk was repriced. Bloomberg noted during the 2022 collapse, “Bitcoin continued trading with deep order books despite severe volatility.” Deep markets reduce the risk of a total price vacuum, and broad market adoption provides the support of a two-sided market where participants hedge, arbitrage, and rebalance.
While the narrative of “Bitcoin going to zero” is great for clickbait, the reality is that zero outcomes require terminal events. Those events include sustained hash rate collapse, permanent liquidity loss, or a fatal protocol flaw. None appear in the current data.
Yes, Bitcoin carries price risk, it has regulatory risk, and Bitcoin is not a zero-risk investment – but going to zero seems to be a very low probability event.

Market Concentration- Beware
Two weeks ago, we published AI Bubble: History Says Caution Is Warranted. The article helps readers appreciate whether we are in an AI bubble.
The book is based on the work of innovation economist Carlota Perez and her acclaimed book, Technological Revolutions and Financial Capital: The Dynamics of Bubbles and Golden Ages. Per her research, one of the hallmarks of financial bubbles forming around major technological innovations is market concentration. To wit, we wrote the following:
Speculative bubbles are also characterized by market concentration. Capital flows disproportionately into a small number of perceived winners. As market breadth narrows, index performance becomes more dependent on a handful of stocks.
This has been incredibly obvious over the last few years, as shown below courtesy of Visual Capitalist. A small number of mega-cap companies, including many of the Magnificent Seven, dominate AI-related investment narratives, index returns, and capital flows. Investors assume these firms will capture most of the future profits simply because they are early leaders.
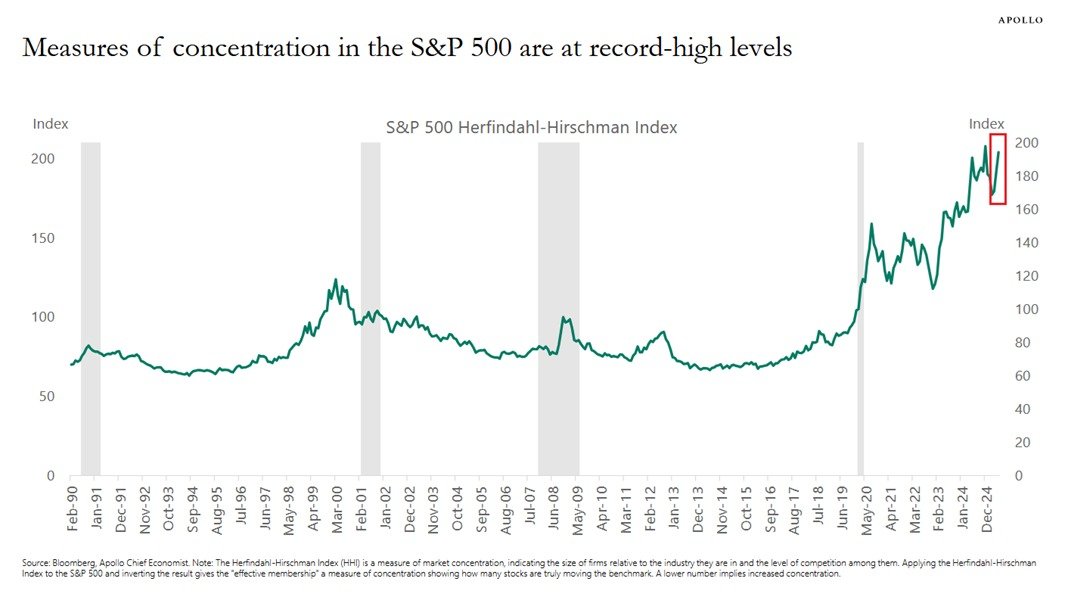
To help put her message into the current context, we share the graph below, courtesy of Apollo. The Herfindahl-Hirschman Index measures the distribution of market caps of an index’s underlying stocks. The higher the number, the greater the concentration, meaning fewer stocks are driving market performance. As the graph shows, this index has risen significantly since the pandemic. Similarly, it increased before the dot-com crash, albeit not by as much. The current high concentration is not only a common trait of innovation-led financial bubbles but also highlights the systemic risk if the largest stocks reverse sharply.
Tweet of the Day
“Want to achieve better long-term success in managing your portfolio? Here are our 15-trading rules for managing market risks.”
Please subscribe to the daily commentary to receive these updates every morning before the opening bell.
If you found this blog useful, please send it to someone else, share it on social media, or contact us to set up a meeting.

