Inside This Week’s Bull Bear Report
- Basis Trade Sends Yields Soaring
- How We Are Trading It
- Research Report – Stock Market As Recession Indicator
- Youtube – Before The Bell
- Market Statistics
- Stock Screens
- Portfolio Trades This Week
Tariff Reprieve Sends Stocks Surging
Last week, we noted that the market was not expecting retaliation from China.
“Rather than coming to the table to negotiate, China responded with a reciprocal 34% tariff on the U.S. plus export controls on rare earth metals needed for technological production. China is playing “hardball” negotiating tactics with Trump. This was a smart move from a negotiating standpoint by China, allowing President Xi to open tariff discussions from a point of strength. However, without some resolution to the extraordinary tariffs, the market will remain in turmoil for quite some time.”
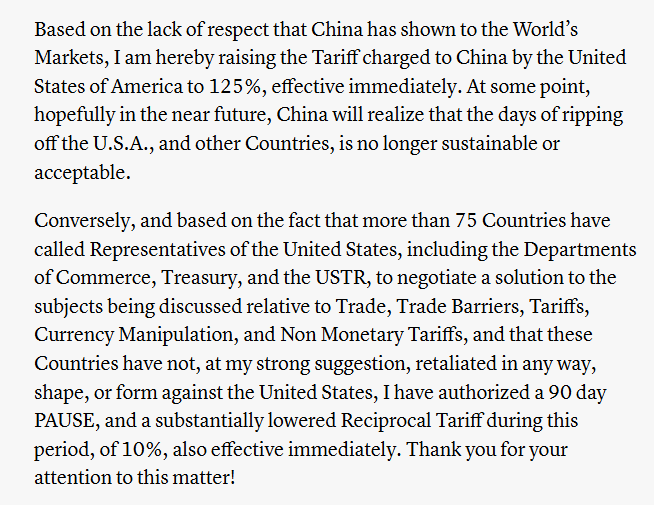
That battle persisted this week as Trump raised tariffs on China to 104%, and China then retaliated with a further tariff increase of 84%. However, as we said last week, any good news would cause the market to rally sharply. On Wednesday, President Trump announced a 90-pause on the full effect of new tariffs. Interestingly, the same headline sent stocks surging on Monday but was quickly deemed “fake news” by the White House. I suspect that Monday was a “leak” by the White House to test the market response, and President Trump kept that announcement handly to stave off a further decline in the markets. Whatever the reason, the markets needed the break. Here is Trump’s full statement:
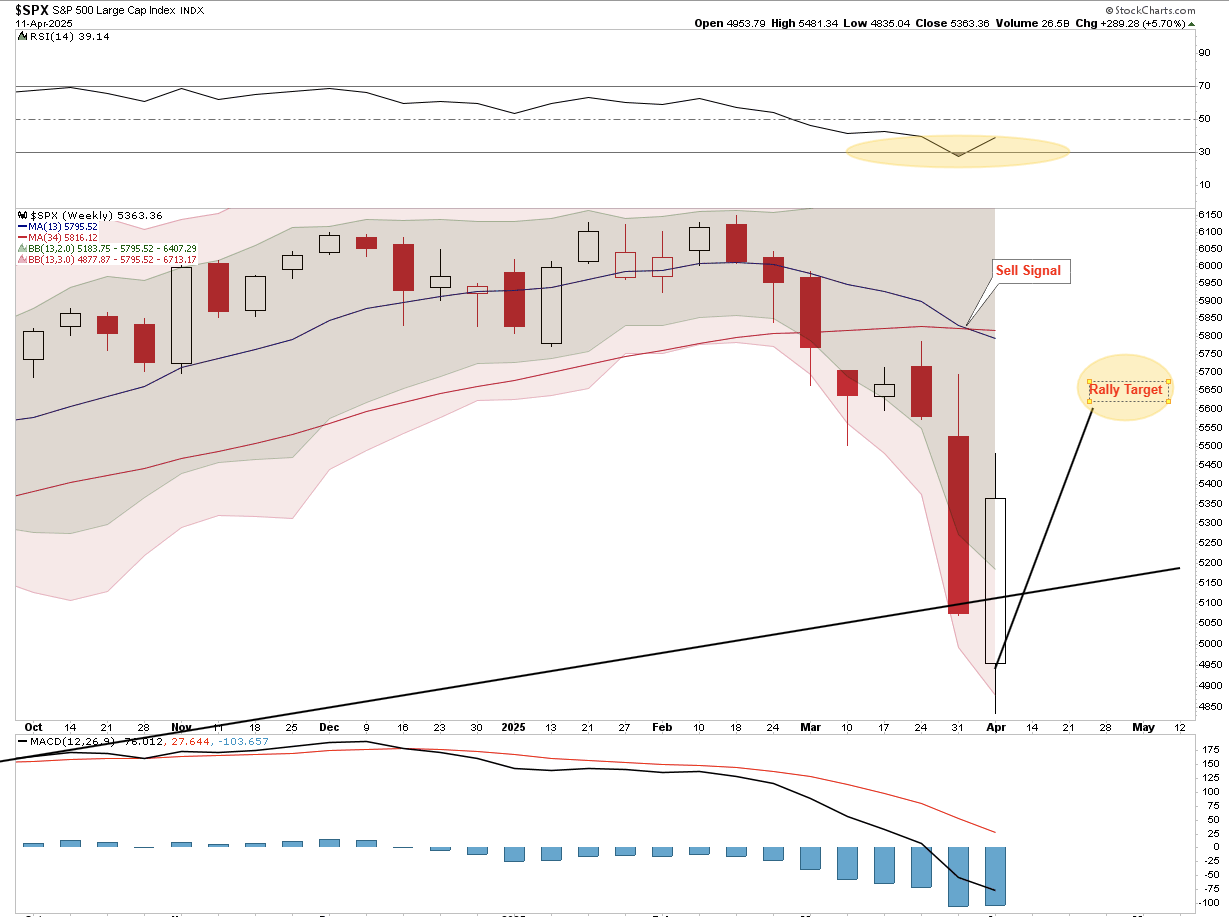
From a technical view, the market completed an expected retracement from the October 2022 lows. Last week, we laid out the potential correction levels.
- The recent lows are around 5500. (That level was violated)
- Immediately below that is the 38.2% retracement level at 5134 (Is being challenged)
- Lastly, the 50% retracement level at 4816 should hold, barring the onset of a fiscal event or recession.
Notably, we stated that:
“The market should be able to find some support at this level and muster a short-term rally next week. However, there is a downside risk to 4816, which would be a 50% retracement of the bull market rally. Any positive announcements over the weekend could spark a relatively robust reversal rally, given the more than three-standard deviation gap between where the market closed and the 50-DMA.“
That 38.2% retracement level, using the bull market from October 2022 lows, was broken early Monday morning as stocks plunged lower amid rising tariff concerns and a blowup in the bond market. However, the market finally tested the 50% retracement level on Wednesday morning. Given the deep oversold condition, President Trump’s announcement to pause tariffs led to the 3rd largest single-day rally since WWII. For now, the market should be able to hold support at the previous lows and hopefully find a bit more relief into next week.

As I noted in the previous two weeks, we strongly lean toward the potential of the markets beginning a more extensive corrective process, much like in 2022. We will revisit that analysis in this weekend’s newsletter. However, while we are concerned about a continued correction process as markets realign prices to forward earnings expectations, there will still be strong intermittent rallies. As noted last week, nothing in the market is guaranteed. Therefore, we continue managing risk accordingly, and as we stated last week and executed on Wednesday, we are now in “sell the rally” mode until the markets find equilibrium. When that will be, we are uncertain, so we continue to watch the technicals, make small moves within portfolios, and reduce volatility risk as needed.
This week, we will revisit the 2022 scenario and the “basis trade,” which threatens the financial markets.
Need Help With Your Investing Strategy?
Are you looking for complete financial, insurance, and estate planning? Need a risk-managed portfolio management strategy to grow and protect your savings? Whatever your needs are, we are here to help.

Credit Spreads Sending A Warning
As discussed in “Credit Spreads,” the one market signal worth your attention is “credit.”
Credit spreads reflect the perceived risk of corporate bonds compared to government bonds. The spread between risky corporate bonds and safer Treasury bonds remains narrow when the economy performs well. This is because investors are confident in corporate profitability and are willing to accept lower yields for higher risks. Conversely, during economic uncertainty or stress, investors demand higher yields for holding corporate debt, causing spreads to widen. This widening often signals investors are growing concerned about future corporate defaults, which could indicate broader economic trouble.

The two charts above show that credit spreads are essential for stock market investors. Watching spreads provide insights into the health of the corporate sector, which is a major driver of equity performance. When credit spreads widen, they often precede liquidity events, reduced corporate earnings, economic contractions, and stock market downturns. Widening credit spreads are commonly associated with increased risk aversion among investors. Historically, significant widening of credit spreads has foreshadowed recessions and major market sell-offs. Here’s why:
- Corporate Financial Health: Credit spreads reflect investor views on corporate solvency. A rising spread suggests a growing concern over companies’ ability to service their debt. Particularly if the economy slows or interest rates rise.
- Risk Sentiment Shift: Credit markets tend to be more sensitive to economic shocks than equity markets. When credit spreads widen, it typically indicates that the fixed-income market is pricing in higher risks. This is often a leading indicator of equity market stress.
- Liquidity Events: As investors become more risk-averse, they shift capital from corporate bonds to safer assets like Treasuries. The flight to safety reduces liquidity in the corporate bond market. Less liquidity potentially leads to tighter credit conditions that affect businesses’ ability to invest and grow, weighing on stock prices.
The recent market disruption caused by Trump’s trade war has undoubtedly widened spreads between “risk-free” treasury yields and corporate bonds. However, while those spreads have widened, they remain well below the long-term averages. With inflation and economic growth slowing, this week’s violent turmoil in the Treasury bond market is a signal of more than just recession concerns. As we noted in our Daily Market Commentary:
“On Monday, Treasury bonds had a sharp decline far beyond what the economic or tariff data suggested would be the case. We suspect that on Monday, there was forced liquidation through either margin calls or demand redemption of an institutional fund. The outsized selling and volume on a single day for bonds is highly unusual. The media excuses of “tariffs” or “economic concerns” are issues the bond market has known about for quite some time.”
That type of sharp liquidation has historically been the issue of some liquidity events in the bond market. In this case, it appears to be the heavily leveraged arbitrage trade used by hedge funds.
The “Basis Trade” – A Near LTCM Moment
For a simple explanation of the basis trade, I asked Grok:
“The “basis trade” in the Treasury bond market is a strategy commonly used by hedge funds to profit from small price discrepancies between Treasury bonds (the cash market) and Treasury futures contracts. Here’s how it works: hedge funds buy Treasury bonds while simultaneously shorting Treasury futures (or vice versa), betting that the price gap, or “basis,” between the two will converge. This trade relies heavily on leverage—often 20 to 56 times the initial investment—borrowed through the repurchase (repo) market, where Treasuries are used as collateral. The goal is to capture small, consistent profits from this arbitrage, amplified by the leverage while assuming the relationship between cash bonds and futures remains stable.”
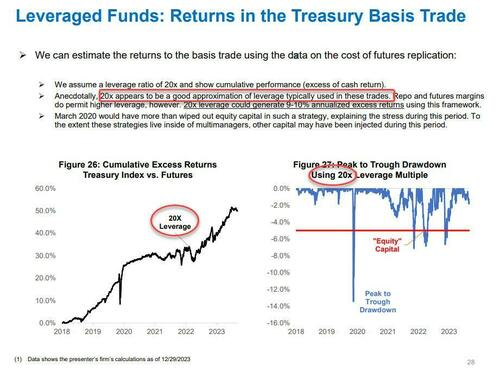
While the Fed suggests that the hedge fund basis trades leverage is above 50x, the Treasury Borrowing Advisory Committee wrote in January that “20x appears to be a good approximation of leverage typically used in these trades.”
If you don’t understand that math, it simply means that a 5% loss at 20x leverage is a 100% loss on the trade.
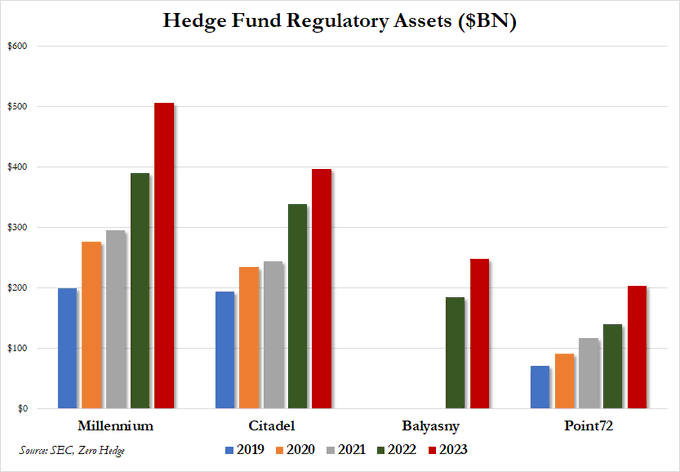
Furthermore, just for context, when Long Term Capital Management (LTCM) blew up over an unexpected move in interest rates, it cost the Fed $100 billion to keep financial markets afloat. As shown below, the current magnitude of today’s hedge fund giants running these “basis trades” are multiples of LTCM.
As of this past week, the market liquidity event appears to be the “basis trade” unraveling. This turbulence is driven by hedge funds being forced to unwind their basis trade positions as Treasury prices drop (and yields rise.) That change in the value of the collateral backing those leveraged bets decreases, triggering margin calls from lenders. To meet those margin calls, hedge funds must sell their Treasury holdings, which exacerbates the downward pressure on bond prices, increasing yields, which triggers more liquidations.
This “liquidation event” in the bond market is very reminiscent of the “Repo Crisis” in 2019 and the “Dash For Cash” during the COVID-19 pandemic. It also reminds us of the “Silicon Valley Bank Crisis” in 2023. In all three events, the Federal Reserve stepped in to provide liquidity to the Treasury market. As Deutsche Bank noted on Wednesday:
“As far as the market circuit-breakers go, if recent disruption in the US Treasury market continues we see no other option for the Fed but to step in with emergency purchases of US Treasuries to stabilize the bond market (“emergency QE”). This would be very similar to the Bank of England intervention following the gilt crisis of 2022. While we suspect the Fed could be successful in stabilizing the market in the short-term, we would argue there is only one thing that can stabilize some of the more medium-term financial market shifts that have been unleashed: a reversal in the policies of the Trump administration itself.”
For a deeper dive into the “basis trade,” watch the following excerpt from the RealInvestmentShow:
The reversal of Trump’s tariffs on Wednesday was not a “master class in negotiation.” It was the admission that a terrible mistake was made, and the bond market drove that reversal.
However, is the problem resolved? It does not appear to be due to yields continuing to rise. Both credit spreads and interest rates are sending warning signs but are not yet at levels suggesting the entire funding market is broken. The bond market is functioning, and the 10-year auction on Wednesday went well. Furthermore, hopefully, the administration’s 90-day pause on tariffs is the first step in the right direction to end the trade war entirely or at least reduce it significantly.
Regardless, I doubt that we are done with market volatility. The damage done to the bond market so far is likely not over yet, and while we may get a short-term reprieve, I suspect there will be another round of bond market stress before we are done.
That is particularly the case given the recent triggering of our most crucial risk-management signal.
Despite The Tariff Reprieve – Sell Signal Triggers
Last Tuesday, I posted “Failure At The 200-DMA” which discussed the importance of the weekly “risk management” signal.
The chart below is a long-term weekly chart of RSI and MACD indicators. I have denoted when the indicators are trading in bullish and bearish trends. The primary signal is the crossover of the weekly moving averages, as noted by the vertical lines. While the MACD and RSI indicators provided early warning signals, the moving average crossover confirmed a market correction or consolidation. These indicators will not necessarily cause a risk reduction precisely at the top. However, they generally provide sufficient indications to reduce risk ahead of more significant market corrections and consolidations.
I have updated the chart for this week’s market close. The massive rally on Wednesday completed the 50% retracement from the low, which allowed us to reduce portfolio risk in portfolios. Most likely, the correction process that started with the break of the 200-DMA is likely not yet complete. We will discuss those actions in the “How We Are Trading It” section below.

The market tells us that the risk of a more significant correction or consolidation process is increasing, particularly as economic growth slows and valuations are repriced for reduced earnings growth expectations. As we noted in that article two weeks ago:
“While such does not preclude a significant counter-trend rally in the short term, the longer-term risks seem to be growing.”
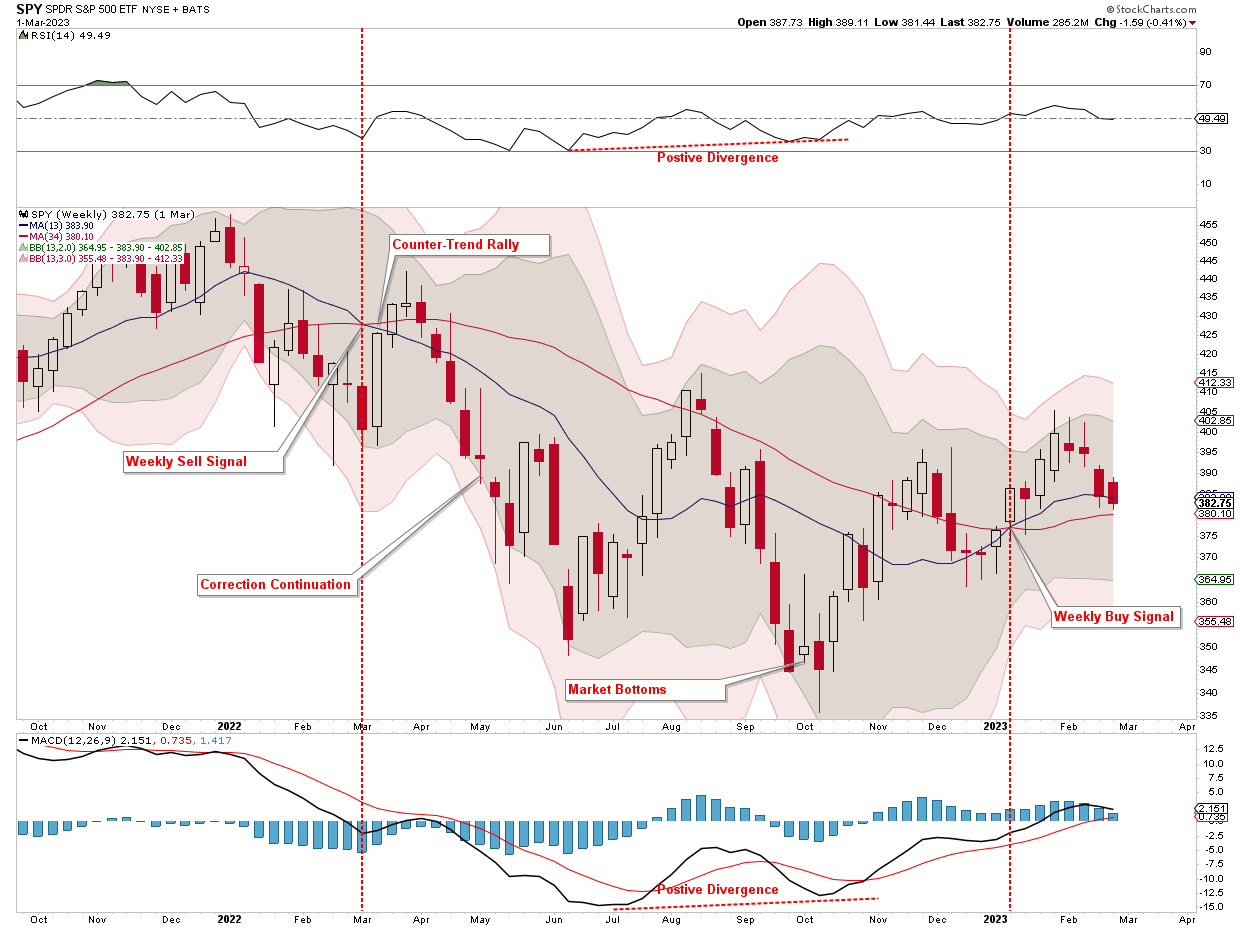
So far, the current corrective cycle, including the massive reflexive rally this week, remains very reminiscent of the 2022 correction. If we enter another corrective period like 2022, given some of the same technical similarities, there is a decent “playbook” to follow despite substantial differences. In 2022, the Fed was hiking rates, inflation was surging, and economists were convinced a recession was on the horizon. As noted above, earnings estimates were revised lower, causing the markets to reprice valuations. Today, the Fed is cutting rates, and inflation is declining; however, due to Trump’s trade policies, the risk of recession is rising, and earnings estimates likely remain overly optimistic. We must realize that the analysis can change as time passes.
However, let’s review the 2022 correction process. In March 2022, the market triggered the weekly “sell signal” as it declined. Notably, the market rallied sharply after the “sell signal” was initially triggered. Much to the same degree as we saw on Wednesday. Such a rally is unsurprising, as when markets trigger “sell signals,” they are often profoundly oversold in the short term. However, that rally was an opportunity to “reduce risk,” as the failure of that rally brought sellers back into the market. The “decline, rally, decline” process repeated until the market bottomed in October. One of the defining things we will be looking to identify where the current market will bottom is the positive divergence of momentum and relative strength. Even though markets continued to struggle in the summer or 2022, the positive divergences suggested that market lows were near.
In that article two weeks ago, we stated:
“With the market approaching decently oversold levels, I expect a rally to start as soon as this week or next.”
That rally occurred, and we are starting to track the initial “sell signal” process as of 2022. Such suggests we could see a further rally over the next week.
We used the rally this week to reduce portfolio risk and raise cash levels, and we will continue that process on a further rally. While no two corrections are the same, it is essential to understand that corrections do not occur in a straight line. With the weekly sell signal in place, investors should expect that we will likely see further declines, which will likely be punctuated by short-term rallies that allow investors to rebalance portfolio allocations and reduce risk as needed.
With that understanding, this is what we did this past week.
How We Are Trading It
Last week, we stated:
“As noted, we expect a sizable rally soon. While such a rally will undoubtedly make investors more bullish on the markets, we will use that rally to reduce portfolio volatility until a more durable market bottom is identified. Furthermore, we are triggering an important weekly sell signal. Still, the markets are simultaneously three standard deviations below their longer-term moving average, challenging the rising trend line from the October 2022 lows. Such oversold conditions typically precede short-term rallies, allowing us to reduce exposure to equities between 5500 and 5700. While the rally could be more significant, we will use those levels to begin risk reductions.”
We followed our instructions from last week, which stated that we would:
- Reduce current positions by 1/4 to 1/2 of their current target weights.
- Increase cash levels
- Raise stop loss levels on long-term positions.
- Sell positions that have technically violated previous support levels or exceeded risk tolerances.
- Add to positions that are positioned to benefit from further market stress.
All the trades are listed at the bottom of this week’s newsletter.
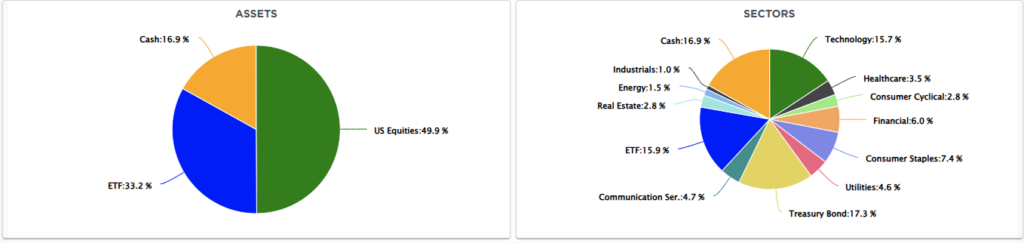
Those actions reduced equity exposure to 50% and increased cash to 17%. However, the portfolio has a 2.5% short-S&P 500 position, which brings the actual equity allocation to 47.5%.
Note: We expect the market to rally more from current levels over the next week or so and could challenge the 200-DMA. However, that is likely the point where sellers will re-enter the market. Markets rarely bottom without retracing toward the previous lows or setting new lows. Given the technical damage to the market, we suspect we will see a pullback before this correction process is over.
We will continue to monitor and adjust the portfolio accordingly. At some point, the valuation reversion will be complete, allowing us to reconfigure portfolio allocations for a more bullish environment. When that event occurs, we will reduce fixed income, shift income allocations to corporate bonds rather than government bonds, and overweight equity allocations in portfolios.
However, that is a conversation we will have in more detail in the future. For now, market conditions remain uncertain. Preparing and adjusting strategies can help investors navigate volatility confidently. As technical indicators flash warning signs, a well-structured risk management approach will protect capital and preserve long-term gains.
I hope this helps.
Feel free to reach out if you want to navigate these uncertain waters with expert guidance. Our team specializes in helping clients make informed decisions in today’s volatile markets.
Have a great week.
Research Report
Subscribe To “Before The Bell” For Daily Trading Updates
We have set up a separate channel JUST for our short daily market updates. Please subscribe to THIS CHANNEL to receive daily notifications before the market opens.
Click Here And Then Click The SUBSCRIBE Button
Subscribe To Our YouTube Channel To Get Notified Of All Our Videos
Bull Bear Report Market Statistics & Screens

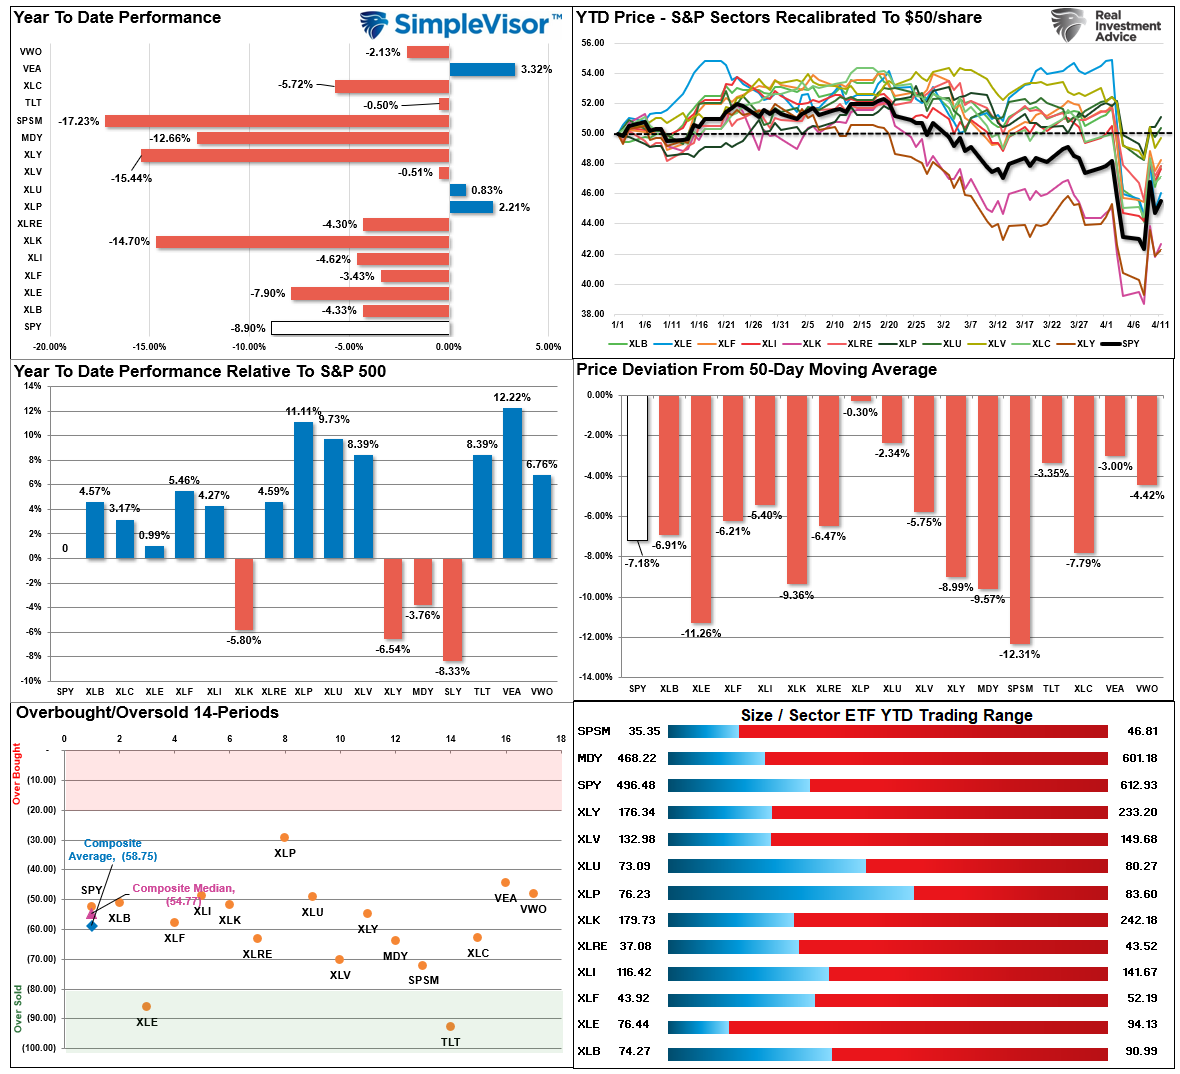
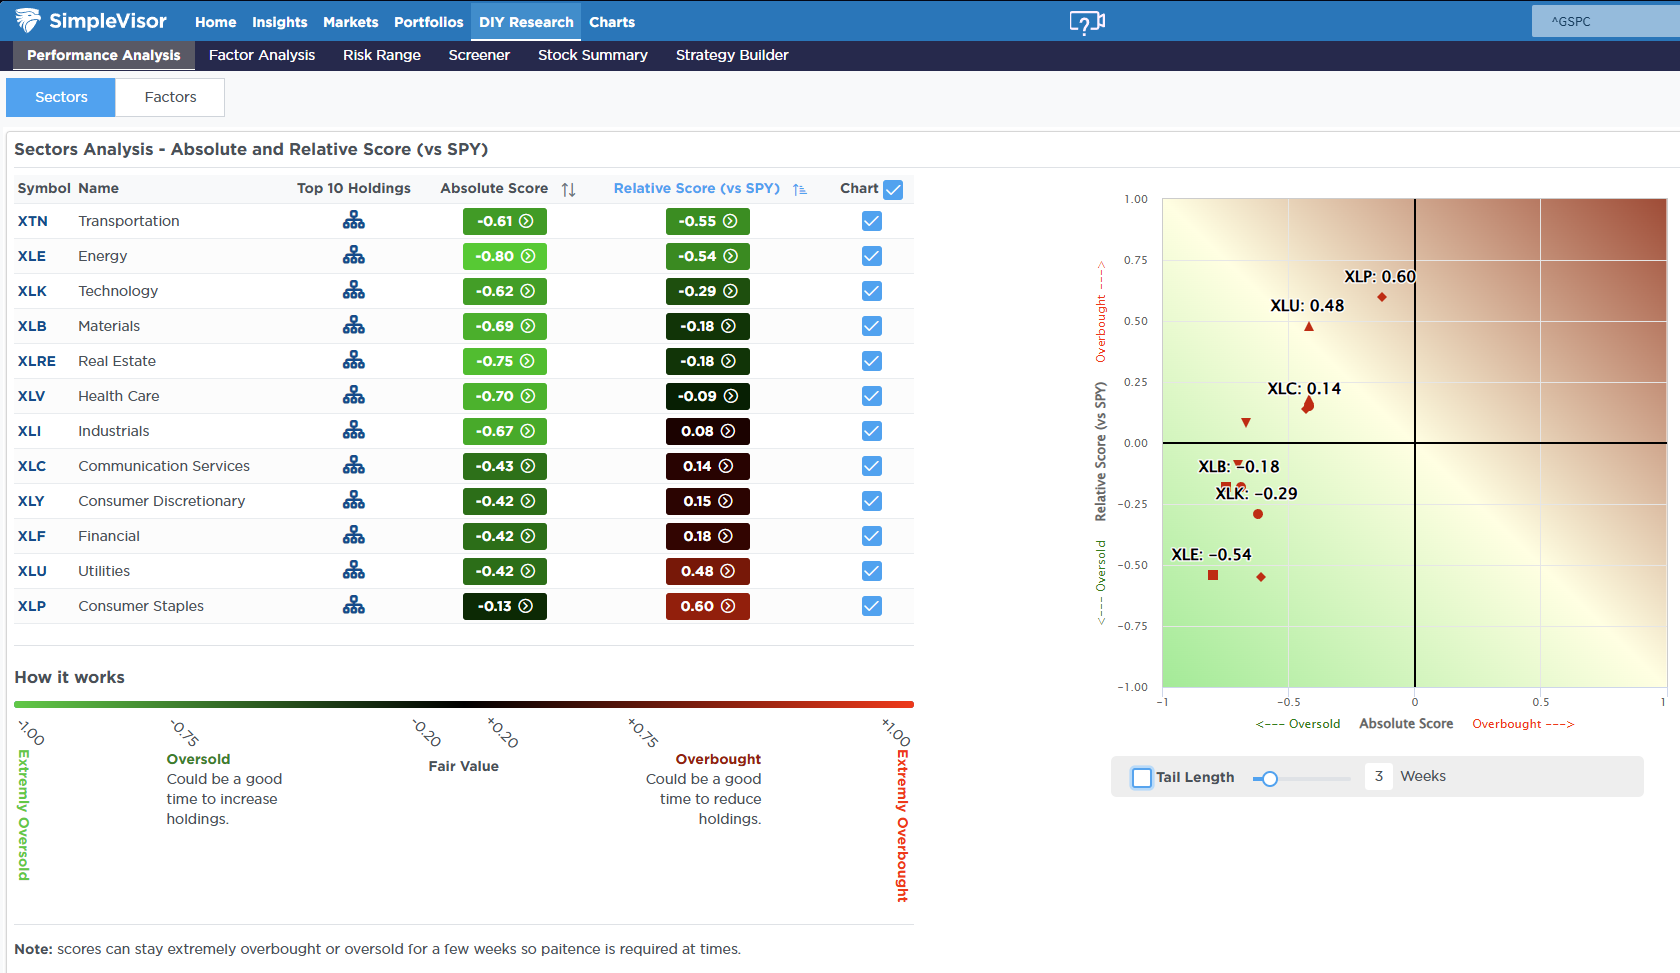
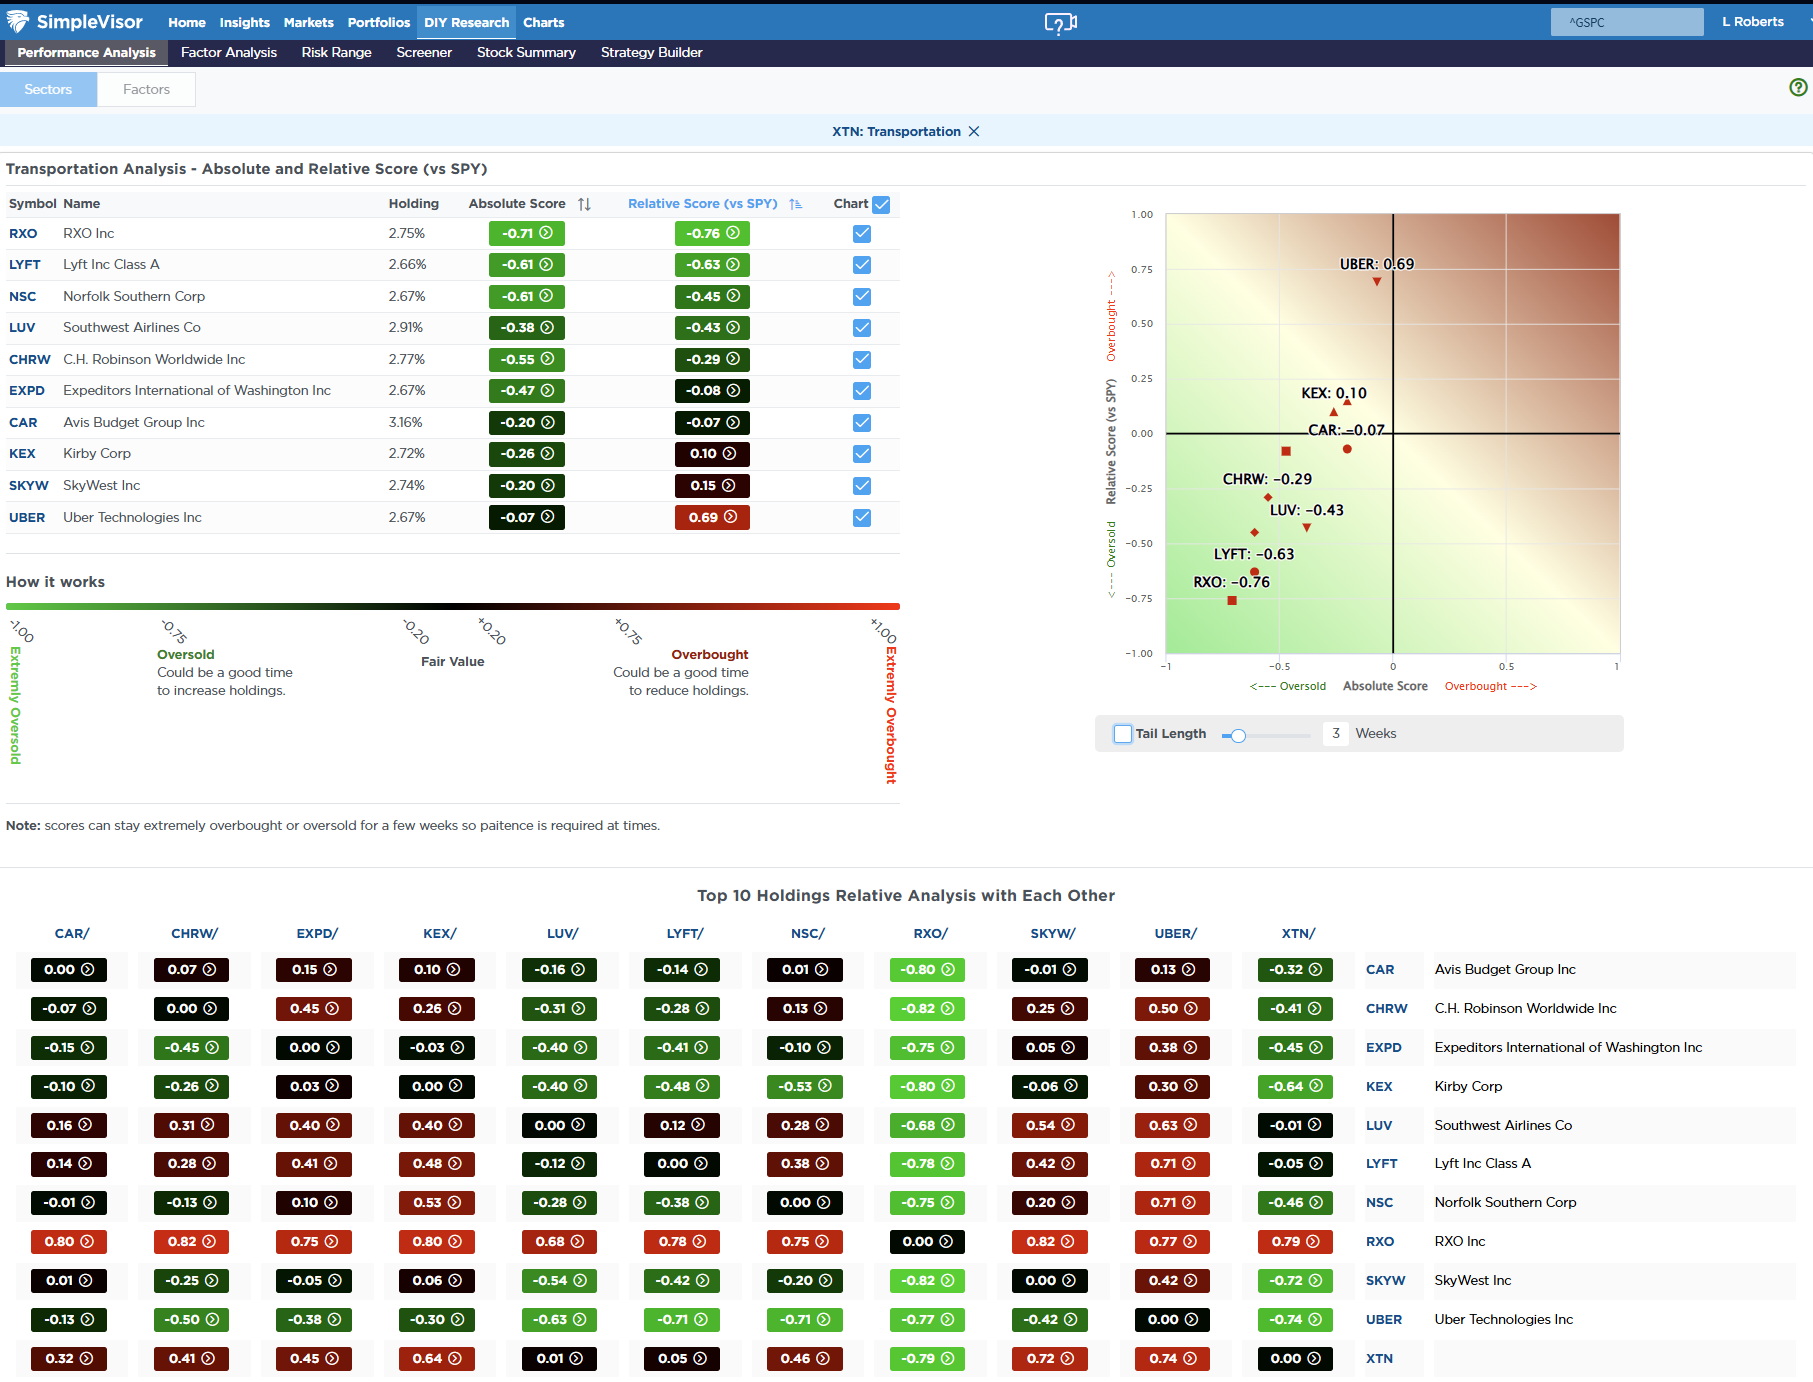
SimpleVisor Top & Bottom Performers By Sector

S&P 500 Weekly Tear Sheet
Relative Performance Analysis
Stocks had another very volatile week, with the bond market getting crushed as forced selling erupted over the “basis trade.” Such was quite the reversal from last week when bonds were the shining star of the markets. Nonetheless, as we stated last week:
“Given the extremely deep oversold of every sector and market, I would expect a tradeable rally early next week, barring any more antics from the White House. As you will note in our Risk/Reward ranges below, while markets and sectors are well outside of normal tolerances, suggesting a rally is likely, the number of bearish divergences will keep markets contained for quite some time. Use rallies to reduce risk and rebalance exposures as needed.”
That remains the case this week. More upside is likely as the markets are not overbought yet, but we will want to continue to rebalance and reduce equity risk on that rally as needed.
Technical Composite
The technical overbought/sold gauge comprises several price indicators (R.S.I., Williams %R, etc.), measured using “weekly” closing price data. Readings above “80” are considered overbought, and below “20” are oversold. The market peaks when those readings are 80 or above, suggesting prudent profit-taking and risk management. The best buying opportunities exist when those readings are 20 or below.
The current reading is 27.88 out of a possible 100.

Portfolio Positioning “Fear / Greed” Gauge
The “Fear/Greed” gauge is how individual and professional investors are “positioning” themselves in the market based on their equity exposure. From a contrarian position, the higher the allocation to equities, the more likely the market is closer to a correction than not. The gauge uses weekly closing data.
NOTE: The Fear/Greed Index measures risk from 0 to 100. It is a rarity that it reaches levels above 90.
The current reading is 28.80 out of a possible 100.

Relative Sector Analysis
Most Oversold Sector Analysis
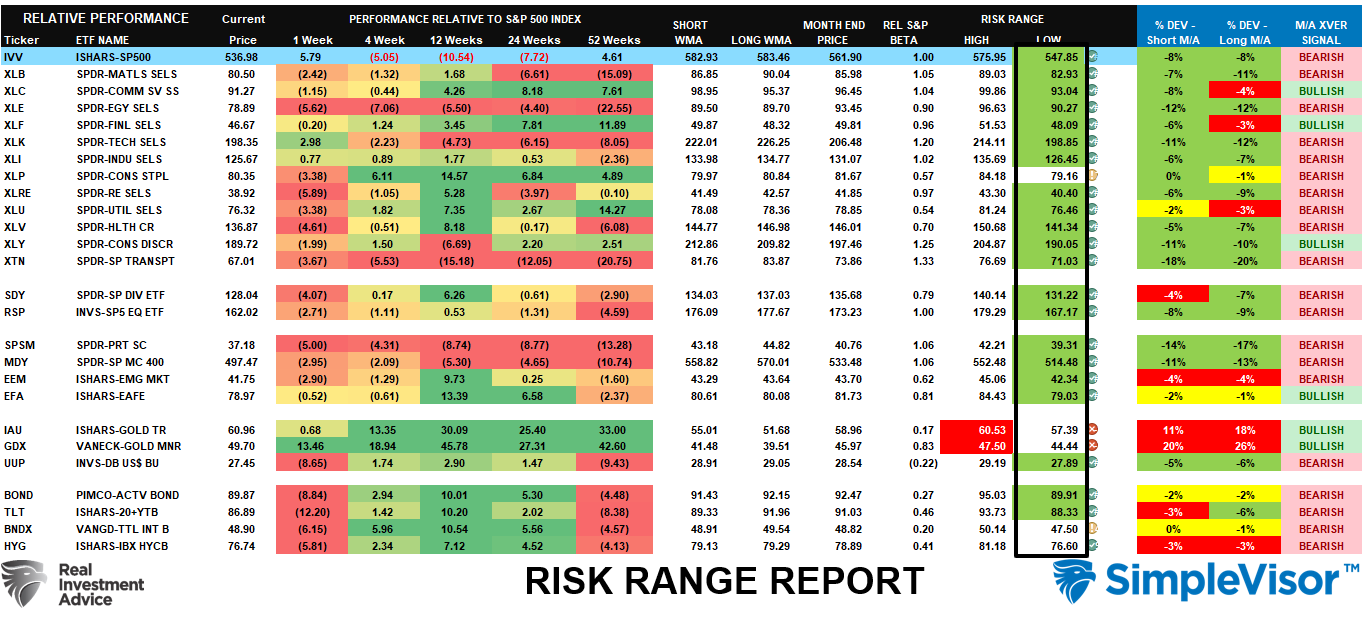
Sector Model Analysis & Risk Ranges
How To Read This Table
- The table compares the relative performance of each sector and market to the S&P 500 index.
- “MA XVER” (Moving Average Crossover) is determined by the short-term weekly moving average crossing positively or negatively with the long-term weekly moving average.
- The risk range is a function of the month-end closing price and the “beta” of the sector or market. (Ranges reset on the 1st of each month)
- The table shows the price deviation above and below the weekly moving averages.
As noted last week:
“The crash this past week sent every market and sector below normal monthly risk ranges. The only other time I have seen something like this was during the 2020 pandemic shutdown of the economy. Notably, these deviations provide opportunistic entry points for investors in the short term. More opportunities to add exposure now reside in Financials, Technology, Discretionary, and Communications. Take profits in Bonds after their recent run higher.“
That advice worked, as bonds crashed and stocks made a decent move higher off their lows. The situation is reversing, with bonds very oversold and equities moving higher. Use the rally to reduce equity risk as needed, and watch the bond market for signs the “basis trade” is rectifying itself. There is a very good opportunity to add long-duration bonds to the portfolio coming soon.
Weekly SimpleVisor Stock Screens
We provide three stock screens each week from SimpleVisor.
This week, we are searching for the Top 20:
- Relative Strength Stocks
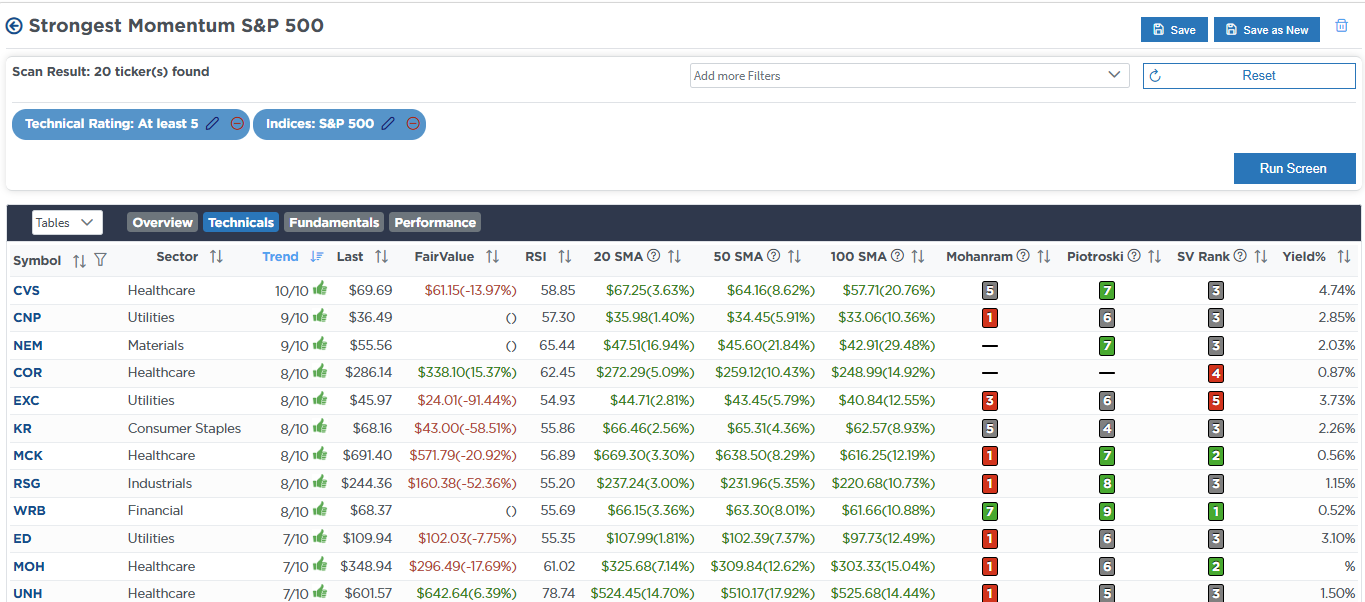
- Momentum Stocks
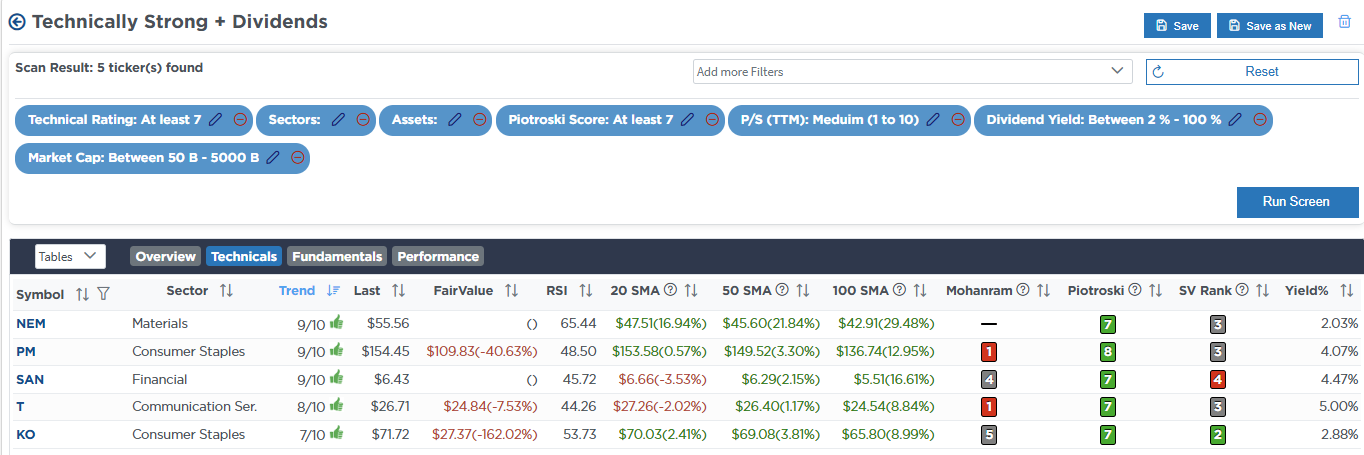
- Technical Strength W/ Dividends
(Click Images To Enlarge)
RSI Screen

Momentum Screen
Technically Strong With Dividends
SimpleVisor Portfolio Changes
We post all of our portfolio changes as they occur at SimpleVisor:
Apr 9th
“This week’s sell-off triggered our weekly sell signals, historically suggesting a much larger potential corrective cycle is in place. However, when this signal is triggered, markets tend to be very oversold and set up for a near-term rally where we can reduce risk at a better level. At the same time, a more critical liquidity event is brewing in the bond market.
The recent spike in bond yields starting Monday is a forced liquidation event in the bond market. It suggests rising credit risk, particularly in hedge funds’ highly leveraged arbitrage trades. In 2019 and 2020, we saw similar events where the Federal Reserve was forced to step in and become a “buyer of last resort.” While that hasn’t happened yet, if rates keep rising as sharply as they have been, the Fed will be forced to maintain financial stability in the credit markets. As such, we are shortening our bond duration sharply until this crisis passes and shifting exposure from stocks most impacted by credit risk increases.
Once this crisis is over, we will rebalance portfolios and increase duration to take advantage of slower economic growth and a potential recession.”
Equity Model
- Reduce ABBV to 2% of the portfolio.
- Reduce LLY and JPM to 1.5% of the portfolio.
- Increase BRK.B, NVDA, and PLTR to 3% of the portfolio
- Increase PANW to 2.5% of the portfolio
- Add to GOOG to bring it up to weight at 4.5% of the portfolio
- Reduce EDV to 5% of the portfolio and increase IEI to 13.5%.
ETF Model
- Reduce XLV to 6% of the portfolio.
- Reduce XLF to 4% of the portfolio.
- Increase MGK to 5% of the portfolio.
- Reduce EDV to 5% of the portfolio and increase IEI to 13.5%.
Dividend Equity Model
- Sell 1/2 of TFC, FRT, SPG, MDT, O, JPM, and GS
Apr 10th
“As we have discussed over the last two weeks, the deep oversold condition of the market would lead to a sharp reflexive rally that should be sold into to reduce risk and rebalance portfolios. That rally came yesterday, and we are reducing risk across all models this morning. The first step is to reduce exposure to positions, reduce target weights, and increase cash levels. The next step, if needed, will be to add a short position in portfolios. Today is step one.”
Equity Model
We are reducing the following stocks to new portfolio target weights:
- COST – 3.5%
- AAPL – 3.25%
- PLTR – 3.0%
- PG – 3.0%
- AMZN – 2.75%
- NVDA – 2.5%
- PANW – 2.5%
- WMT – 1%
- ABBV – 2%
- RTX – 1%
ETF Model
We are adjusting the following ETF holdings to new portfolio target weights.
- XLK – 10.0%
- XLC – 6.5%
- MGK – 6%
- XLP – 6%
- XLI – 1.5%
- XLY – 2.0%
- XLU – 5% (Increase)
- REM – 1%
- XLRE – 1%
Dividend Growth Model
- Reduce META, AAPL, GOOG, AMZN, NVDA, and MSFT to 4% of the portfolio each.
- Reduce MMM, KO, MO, DUK, KMI, AEP, NLY, AMLP, VZ, IBM, ABBV, XOM, and KMB to 2.5% of the portfolio each.
Apr 11th
“With the bond market in turmoil and volatility running at elevated levels, we are reducing equity exposure today in both models by adding 2.5% of an S&P 500 Short Position (SH). This temporary risk reduction measure will be removed once the bond market crisis passes. We will likely increase this position to 5% of the portfolio if the market musters a near-term rally to overhead resistance.“
Equity Model
- Add 2.5% of the S&P 500 Short ETF (SH)
ETF Model
- Add 2.5% of the S&P 500 Short ETF (SH)
Lance Roberts, C.I.O., RIA Advisors

