Inside This Week’s Bull Bear Report
- Q3 Earnings Estimates Remain Optimistic
- How We Are Trading It
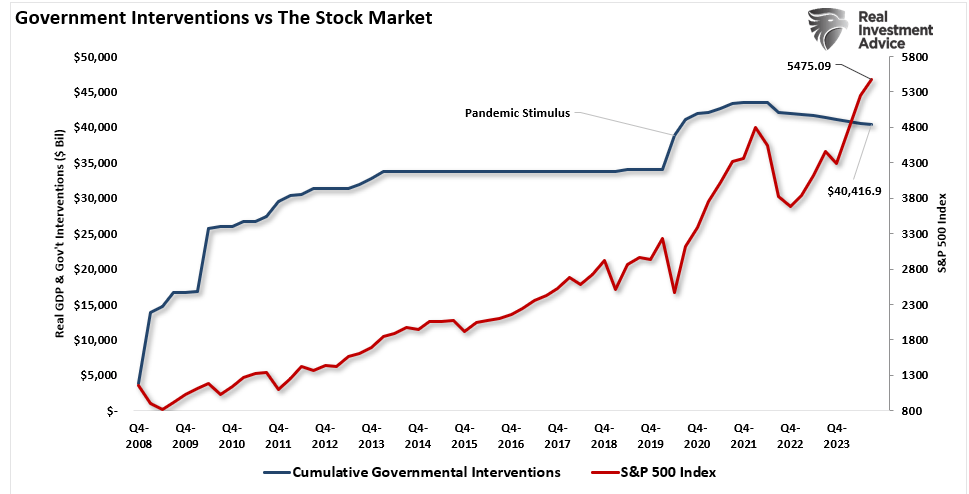
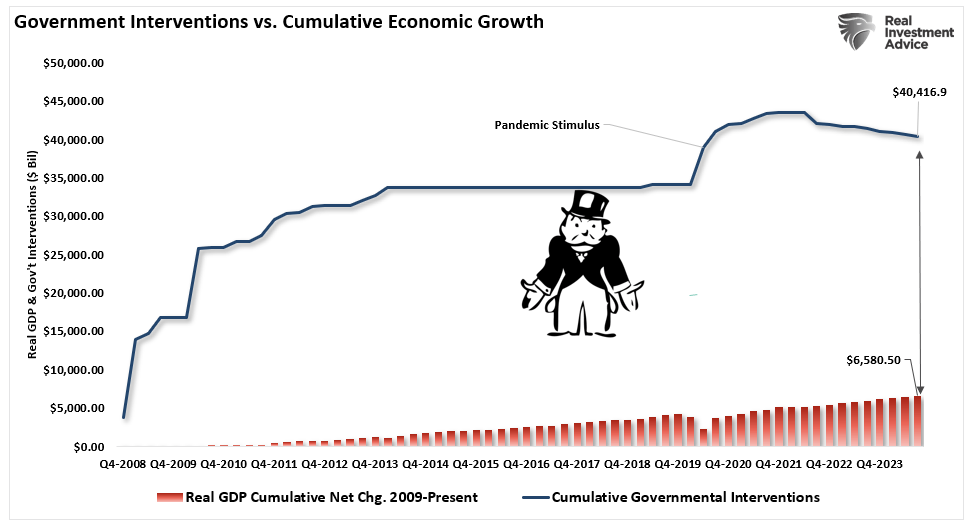
- Research Report –Bastiat And The Broken Window Fallacy
- Youtube – Before The Bell
- Market Statistics
- Stock Screens
- Portfolio Trades This Week
Seasonal Buy Signal Triggered
Last week, we discussed the triggering of the seasonal MACD buy signal. To wit:
“On Friday, the market broke out to the upside of that wedge pattern, triggering a “seasonal MACD buy” signal. Notably, that buy signal also marks the beginning of the seasonally strong 6 months of the year. The series of high lows, now combined with higher highs, remains a significant bullish backdrop for investors. With earnings season starting in earnest this coming week, the bias remains to the upside, but risk management protocols should not be abandoned.”
The chart below is the WEEKLY S&P 500 chart, with three different signals to confirm the start of the seasonal period. With Friday’s close in the green, keeping the week broadly positive, all three seasonal buy signals have been triggered.
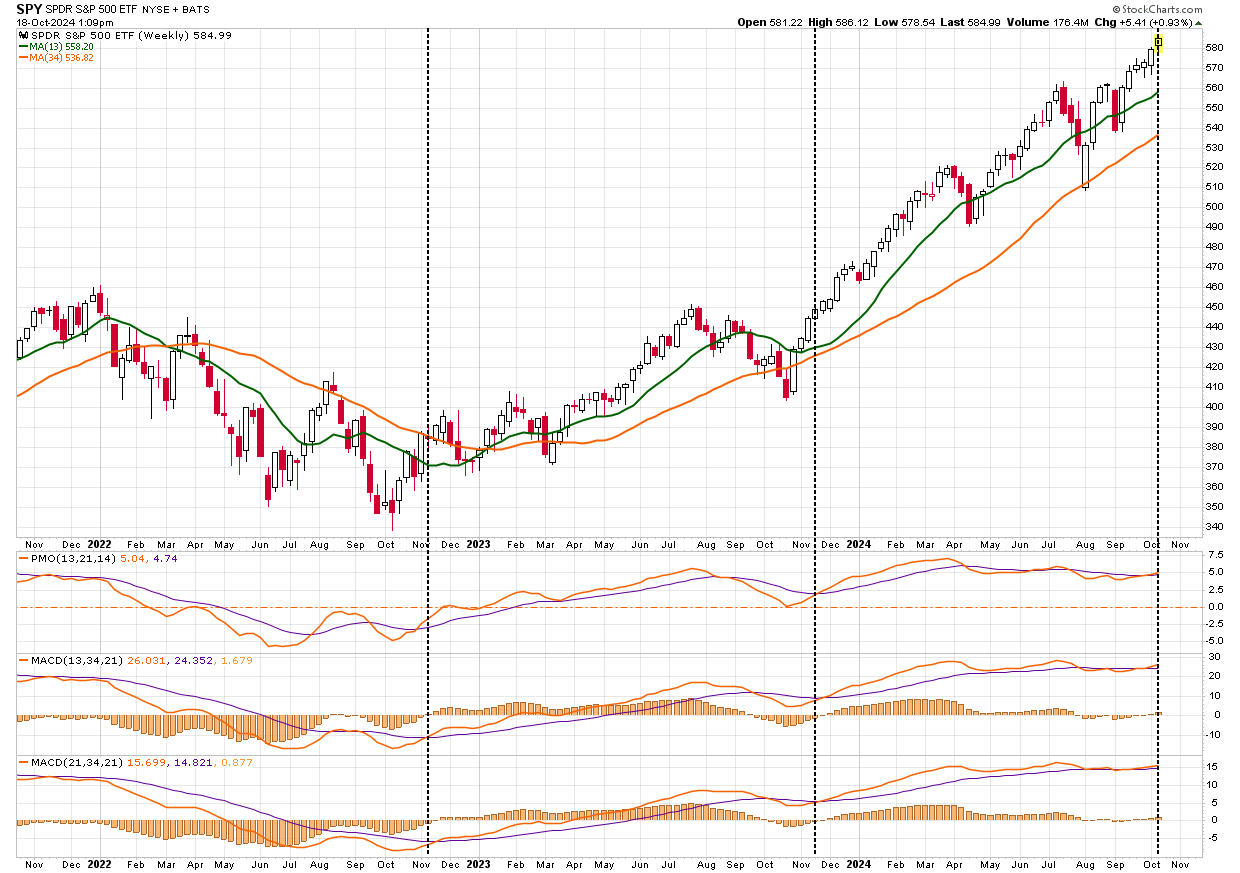
However, as noted last week, just because the seasonally strong period of the year has technically started, it doesn’t mean that the markets won’t have corrections along the way. Notably, we have already had 6-straight weeks of gains, which is a long stretch without a pullback. Secondly, while the market is on a weekly “buy signal,” the market is both deviated and overbought short-term. When the market breadth is very elevated, combined with overbought and deviated markets from the 50 and 200-DMA, corrections and consolidations tend to be more prevalent.
We expect that the market will experience a short-term consolidation or correction. However, there are three reasons why such will likely provide a better entry point to add exposure.
- The current bullish trend remains intact, and bullish sentiment is very strong. This has led to significant and continuing inflows into the market, which will support asset prices.
- Corporate buybacks will resume at the end of the month and will amount to roughly $6 billion per day into year-end.
- Many managers lag in the market and must play catch-up by year-end for reporting purposes.
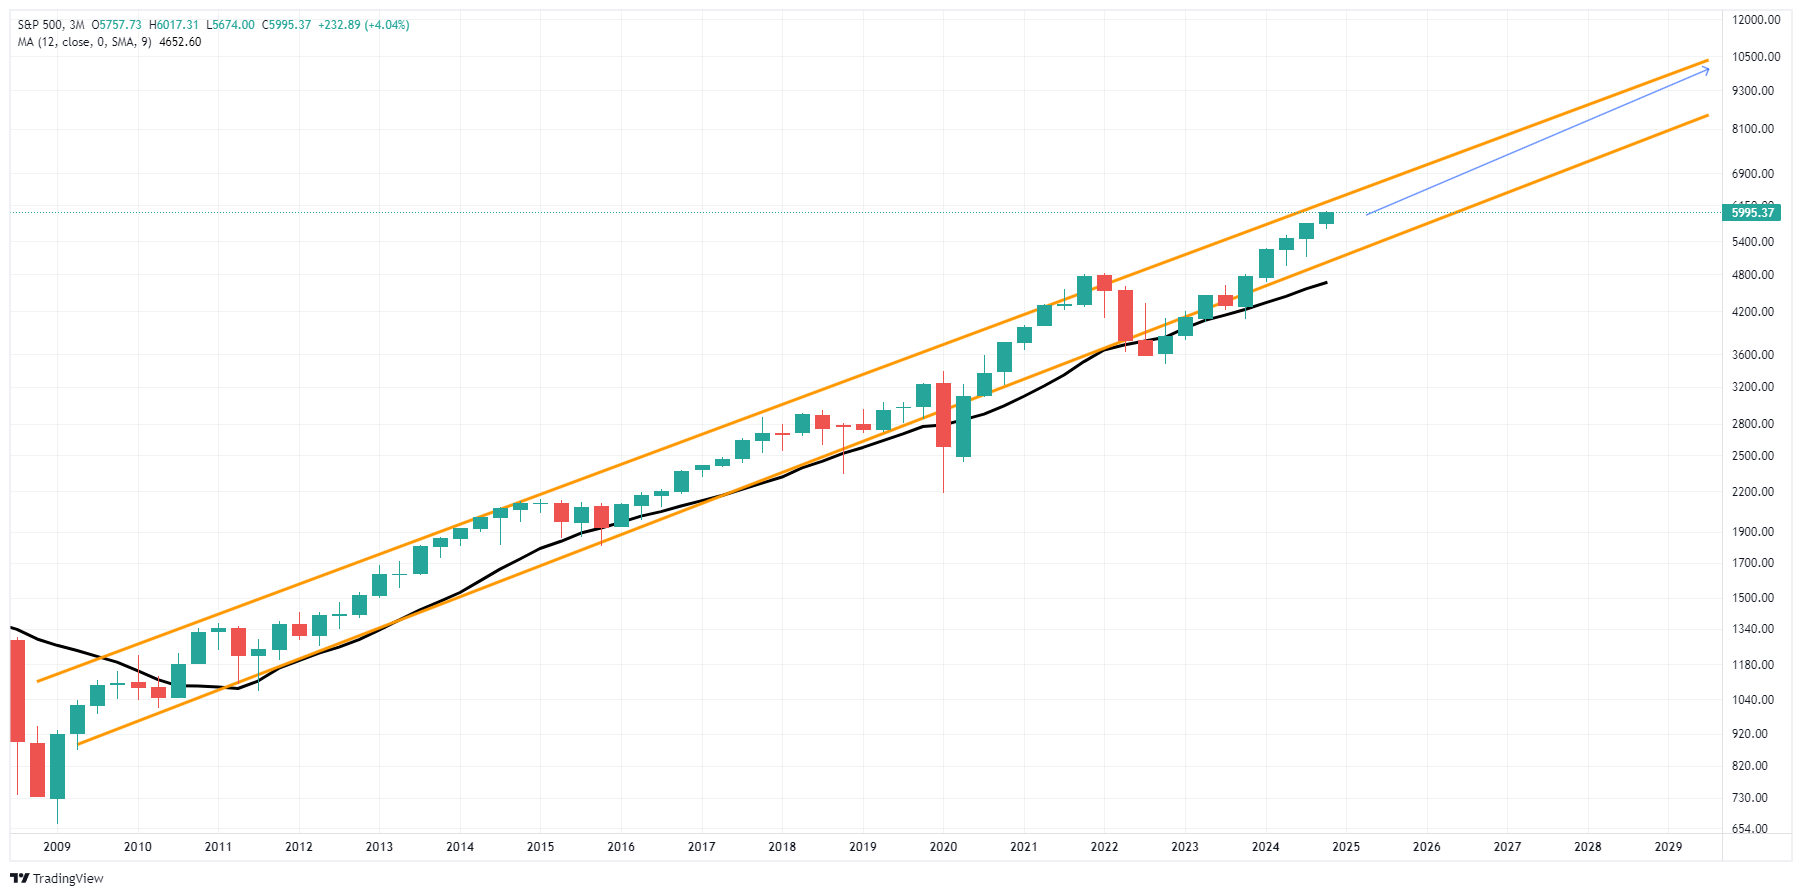
These three reasons will likely push asset prices to our target of 6000 on the index by year-end. However, do not get too complacent, as 2025 will be a year of increased volatility.
This week’s discussion will examine Q3 earnings, which will pick up lots of steam next week.
Need Help With Your Investing Strategy?
Are you looking for complete financial, insurance, and estate planning? Need a risk-managed portfolio management strategy to grow and protect your savings? Whatever your needs are, we are here to help.

Q3-Earnings Estimates Remain Optimistic
As the Q3 earnings season approaches, market participants are eyeing the outlook for S&P 500 companies amid economic uncertainty. After a challenging year for corporate profits in 2022, many investors look to Q3 earnings as a barometer of where the market might head next. However, current consensus estimates from analysts have seen notable downward adjustments, raising questions about whether the market has priced in all the potential risks.
Current Consensus Estimates and Adjustments
According to analysts’ consensus, Q3 earnings for S&P 500 companies are expected to grow moderately. However, compared to earlier in the year, these projections have been revised downwards domestically and globally. Interestingly, despite rather exuberant optimism about the stock market, there have been very few analysts’ earnings upgrades.

Currently, the Q3 earnings season is starting with a fairly low bar.
- Consensus Earnings Growth: Analysts estimate that S&P 500 earnings will increase by around 3-4% year-over-year in Q3. This represents a significant decline from earlier expectations of 7-8% growth.
- Revenue Growth Projections: Revenue growth is expected to remain subdued, with consensus estimates forecasting a 2-3% increase, down from earlier projections of 5%.
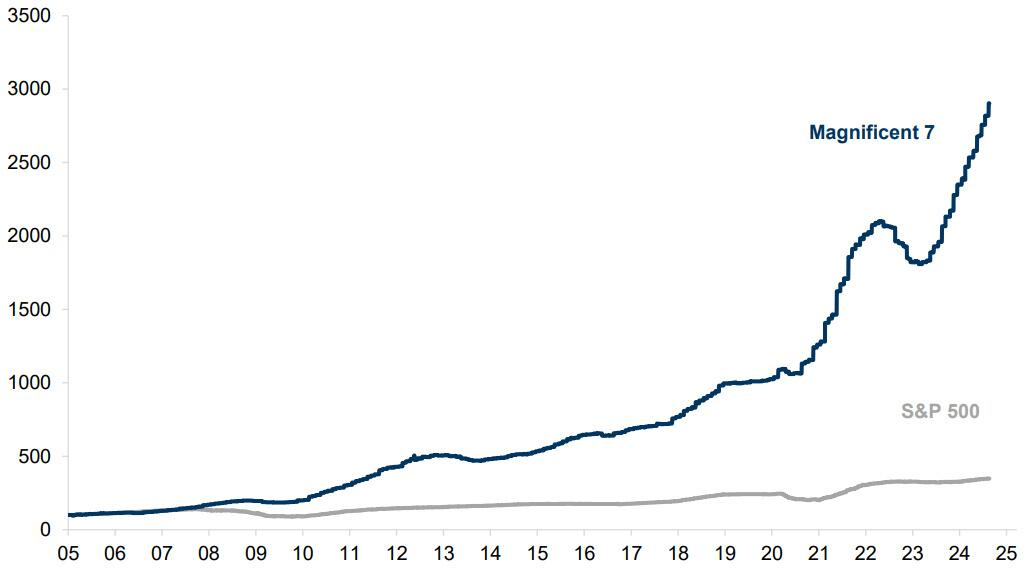
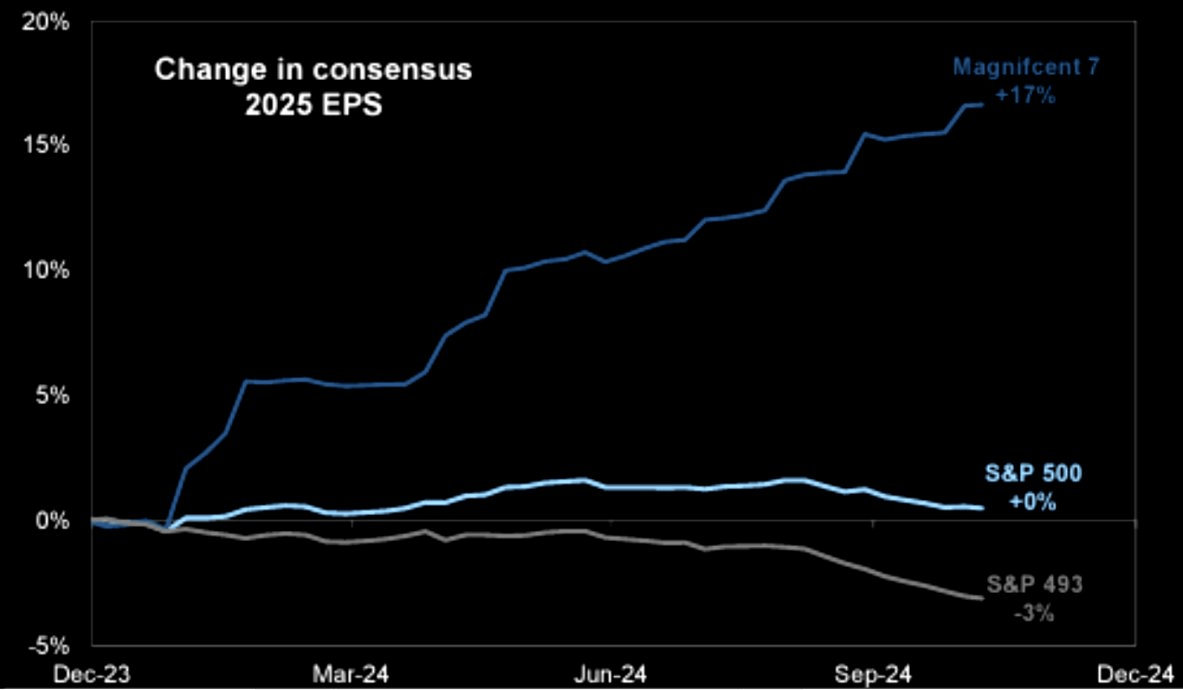
Notably, there is a stunning lack of earnings growth outside the top 10 largest companies in the S&P 500 index. According to Bank of America, while overall Q3 earnings growth was expected to be a modest 3-4%, this would be entirely due to a 19% increase in the “Magnificent 7” earnings. However, even those earnings are down from 37% in Q2 and down from 55% a year ago. The rest of the S&P500, some 493 companies, are expected to post another quarter of flat earnings.
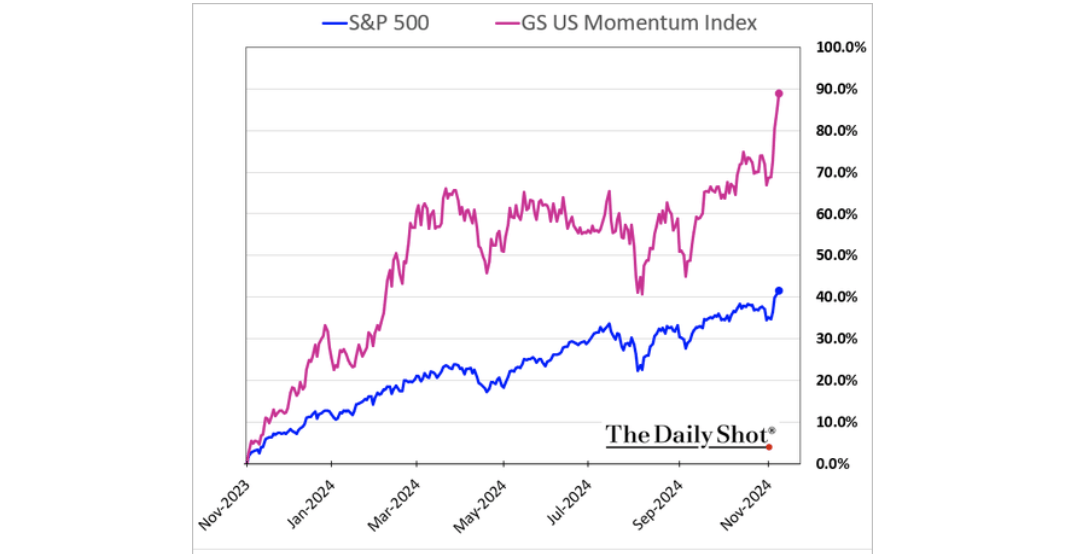
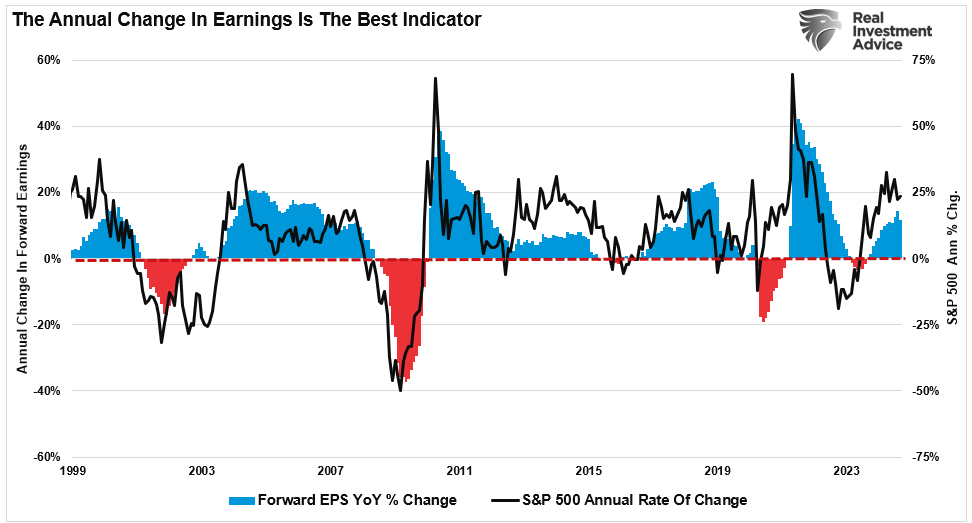
If that isn’t quite apparent, here is the problem more succinctly. Since 2009, virtually all of the earnings growth in the S&P 500 index has come from just seven (7) stocks.
Therefore, it should be relatively unsurprising that downward revisions to estimates come in response to several factors, including weakening consumer demand, tighter monetary policy, and rising geopolitical tensions, which impact those bottom 493 companies the most. As shown, Q3 earnings have seen the largest negative revisions since 2022.
Given the prevailing economic headwinds, this has led to concerns that earnings estimates may still be too optimistic.
Drivers Behind the Downward Revisions
Despite the Federal Reserve’s recent shift toward cutting interest rates, analysts have lowered Q3 2024 earnings estimates. Several factors are driving these downward revisions.
First, although lower interest rates aim to stimulate growth, the economy still grapples with slowing consumer demand and job growth. Companies are struggling with softening sales and rising labor costs as unemployment increases. These pressures outweigh the potential boost from cheaper borrowing costs, potentially limiting near-term profit improvements. Furthermore, as noted by Albert Edwards this week:
“When we say US profit margins are absurdly high, the chart below rams home the point. These are whole economy BEA data and so include unquoted companies, and the BEA ‘scrubs’ the data clean. Until Greedflation emerged in the aftermath of the pandemic, 15% of GDP was typically top of the pops. The even larger share of GDP comes at the expense of workers.”

In other words, further profitability improvements will likely be much harder. Businesses also face lingering uncertainty about the strength of future economic recovery, prompting cautious guidance. The Fed’s recent pivot reflects concerns about maintaining labor market stability and addressing economic slowdown risks, not just inflation reduction. Additionally, while inflation has moderated, input costs remain elevated, potentially further squeezing corporate margins.
The benefits of rate cuts could take several quarters to materialize, leaving Q3 results particularly vulnerable to macroeconomic headwinds this year. However, analysts are highly optimistic that results will improve markedly, double-digit growth, following the Q3 earnings season.
Be wary of the exuberance.
Historical Overestimation by Analysts
The pattern of analysts overestimating corporate earnings is commonplace. Every year, going back to 1994, when “operating earnings” became a thing, analysts‘ forecasts were consistently too optimistic at the beginning of each quarter. Historically, that overestimation has been approximately 30% higher than the eventual reality.
This tendency to overshoot earnings growth has been attributed to several factors:
- Delayed Reaction to Macroeconomic Signals: Analysts have tended to underestimate the lag effect of monetary tightening on corporate profits. While initial forecasts are often based on historical growth patterns, they do not always reflect sudden economic or policy changes.
- Corporate Optimism: Companies often guide higher during earnings calls, buoying analyst expectations. However, as the actual economic environment proves more difficult, earnings often fail to meet these expectations, resulting in post-reporting season disappointments.
- Investment Banking Needs: Wall Street is in the business of selling products. Therefore, increased estimates lower forward valuations, improving investor appetites, particularly for high-growth companies. A previous study showed that the accuracy and timeliness of earnings forecasts are the LEAST important for analysts. (Read: The Truth About Wall Street Analysis)
Given these historical trends, it’s reasonable to question whether current and future earnings forecasts are too high. Should economic conditions worsen, the risk of further downward revisions could increase.
Market Expectations and Return Outlook
Despite the potential challenges for Q3 earnings, market expectations remain relatively stable. Analysts forecast a double-digit return for the S&P 500 through the end of the year, and investors are increasingly optimistic. In October, investors raised their equity allocation by the largest amount since June 2020. Currently, 31% of the investors surveyed by BofA are overweight equities, up from just 11% overweight last month.
Notably, the composite allocation (professional and retail) “fear/greed” index, while not yet at extremes, is beginning to reach levels more associated with market peaks than bottoms.
However, the relationship between earnings and market returns is complex. In recent quarters, the stock market has often rallied on the hope of easing monetary policy, even when earnings have disappointed. However, sustained market returns are heavily tied to earnings growth over the long term. If Q3 earnings fall short, it could cap gains and increase volatility in the year’s final months.
Risks to the Q3 Earnings Outlook
Several key risks could impact the Q3 earnings season and the broader market:
- Inflation Rebounding: While inflation has moderated, there’s a risk that energy prices or wage growth could reignite inflationary pressures. This could cause the Federal Reserve to “pause” on rate cuts, disappointing investor sentiment.
- Geopolitical Tensions: Ongoing conflicts, particularly in Eastern Europe and the Middle East, could exacerbate supply chain disruptions and drive up commodity prices, putting additional strain on corporate margins.
- Consumer Weakness: Should consumer spending continue to decline, particularly in the critical holiday season, many companies may find themselves cutting profit forecasts for Q4, further dampening the outlook for 2024 and into 2025.
- Stronger-than-Expected Economic Slowdown: A significant risk to analysts’ estimates is that economic growth could slow more sharply than currently anticipated, particularly if corporate investment and hiring pull back more aggressively in response to higher interest rates.
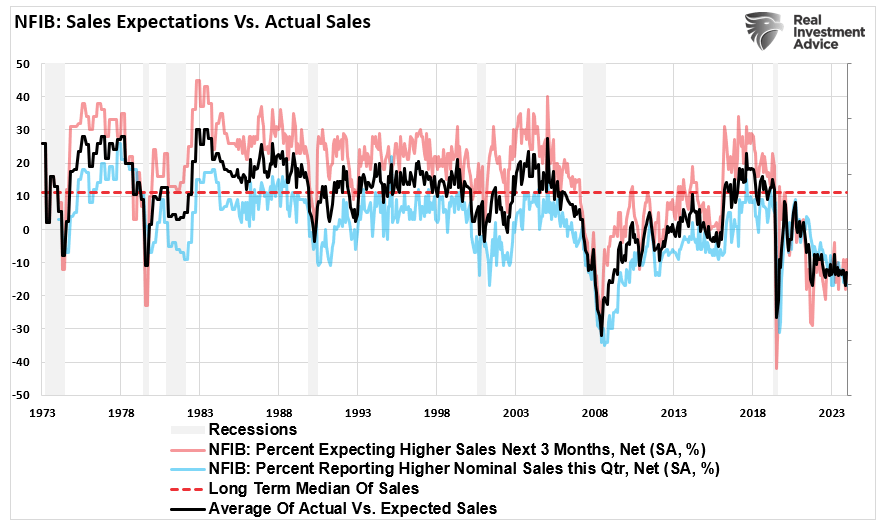
As discussed last week, we think #4 is probably the biggest risk to the market currently.
“One of the more troubling components of the NFIB survey is the outlook for future sales. According to the data, many small business owners expect sales to decline over the next six months. This pessimism is particularly pronounced in the retail and service sectors, where rising costs and shrinking profit margins force many businesses to scale back their operations.
While consumer spending has remained robust so far, many small businesses are not seeing the same level of demand that Wall Street analysts expect. If sales expectations continue to weaken, it could signal a broader slowdown in economic activity, particularly among the smaller enterprises that drive job creation and innovation. Unsurprisingly, as sales demand slows, the expectation for capital expenditures has plunged to some of the lowest levels on record. This is certainly not a sign of a robust economy, and historically, it suggests that GDP will weaken into next year.”
A slowdown in economic growth typically results in weaker corporate earnings as businesses experience declining demand for goods and services.
As Q3 earnings season kicks off, the S&P 500 faces a mixed outlook. Downward revisions to earnings estimates suggest that analysts are increasingly cautious about corporate profitability in the face of persistent economic headwinds. However, historical trends of overestimation, coupled with the possibility of unexpected economic shocks, could lead to further downward revisions.
Investors should approach Q3 earnings with a balanced perspective, recognizing both the opportunities for selective gains and the risks of broader market volatility. Staying diversified, managing risks, and rebalancing allocations will likely be the best strategy for navigating the market into year-end.
How We Are Trading It
Let me conclude with what we wrote last week.
“We continue to manage our portfolios in a manner that allows us to participate in the market increase but still hedge against underlying risk. As such, we suggest rebalancing risk as necessary and adjusting portfolio holdings to provide some hedge against a sudden pickup in volatility. While the number of stocks making new 52-week highs is rising, indicating strong breadth and participation in the market also serves as a warning. As shown, previous high levels of participation also coincide with market peaks and corrections.
The trick to navigating markets is not trying to “time” the market to sell exactly at the top. That is impossible. Successful long-term management is understanding when “enough is enough” and being willing to take profits and protect your gains. For many stocks currently, that is the situation we are in.”
That advice remains relevant this week as we head into the heart of earnings season. A pickup in volatility, some surprises and disappointments will be the nature of the market next week as the mega-cap companies report their results. The trick will be to navigate the outcome without making emotionally driven decisions.
Continue to follow the rules and stick to your discipline. (Read our article on “What Is RIsk” for a complete list of rules)
Feel free to reach out if you want to navigate these uncertain waters with expert guidance. Our team specializes in helping clients make informed decisions in today’s volatile markets.
Have a great week.
Research Report

Subscribe To “Before The Bell” For Daily Trading Updates
We have set up a separate channel JUST for our short daily market updates. Please subscribe to THIS CHANNEL to receive daily notifications before the market opens.
Click Here And Then Click The SUBSCRIBE Button
Subscribe To Our YouTube Channel To Get Notified Of All Our Videos
Bull Bear Report Market Statistics & Screens

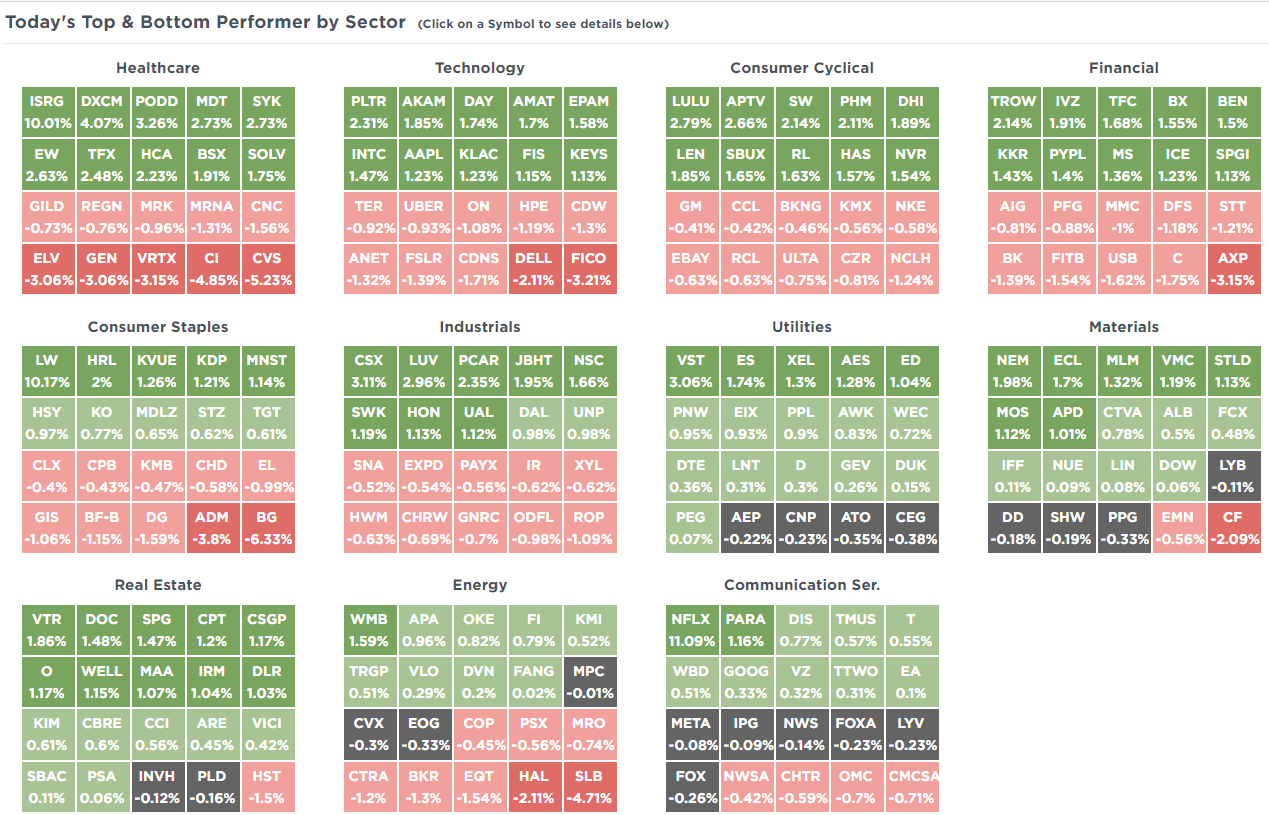
SimpleVisor Top & Bottom Performers By Sector
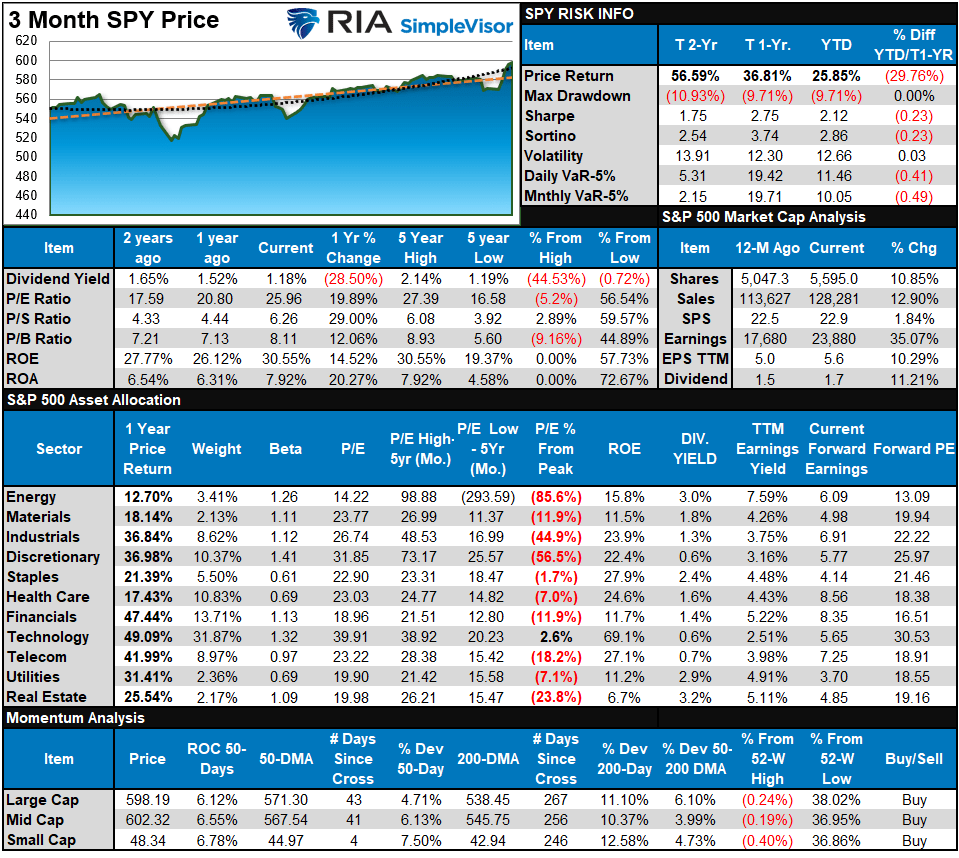
S&P 500 Weekly Tear Sheet
Relative Performance Analysis
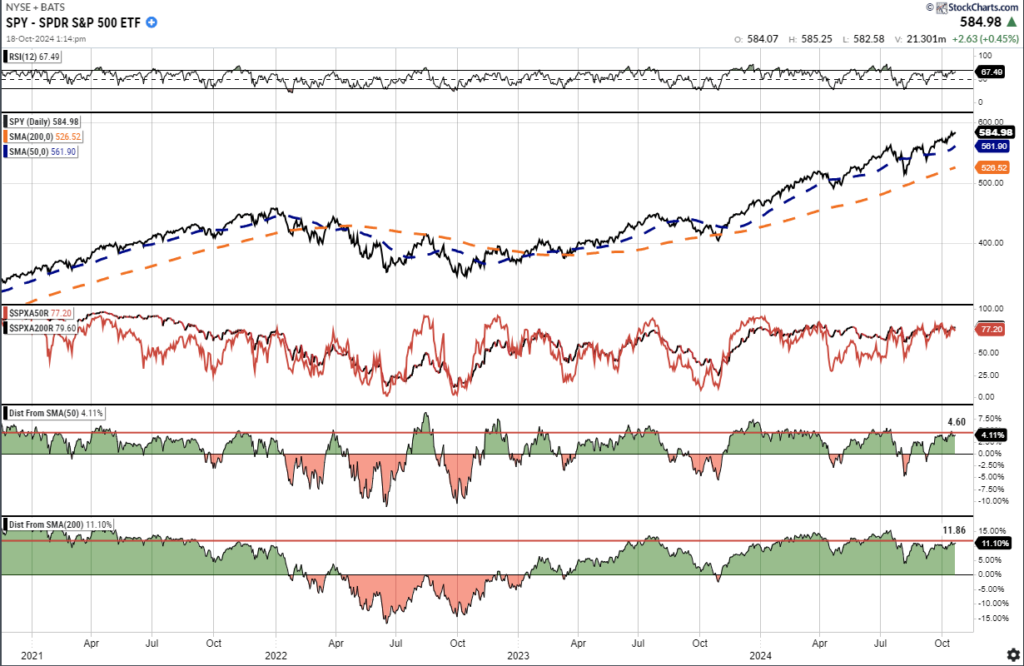
Last week, we noted that the bullish trend continues, and the market continues to reach new highs. The overbought/sold analysis on the bottom left shows that the average and median stock is now overbought. The broad market is solidly overbought, with many sectors and markets pushing for more extreme overbought conditions. Such is a good setup for the market to “rest” briefly before moving higher into year-end. Use pauses and corrections to rebalance portfolios for a post-election advance into year-end, assuming the outcome is not a “highly contested mess,” which may muck things up.

Technical Composite
The technical overbought/sold gauge comprises several price indicators (R.S.I., Williams %R, etc.), measured using “weekly” closing price data. Readings above “80” are considered overbought, and below “20” are oversold. The market peaks when those readings are 80 or above, suggesting prudent profit-taking and risk management. The best buying opportunities exist when those readings are 20 or below.
The current reading is 84.31 out of a possible 100.

Portfolio Positioning “Fear / Greed” Gauge
The “Fear/Greed” gauge is how individual and professional investors are “positioning” themselves in the market based on their equity exposure. From a contrarian position, the higher the allocation to equities, the more likely the market is closer to a correction than not. The gauge uses weekly closing data.
NOTE: The Fear/Greed Index measures risk from 0 to 100. It is a rarity that it reaches levels above 90. The current reading is 78.67 out of a possible 100.

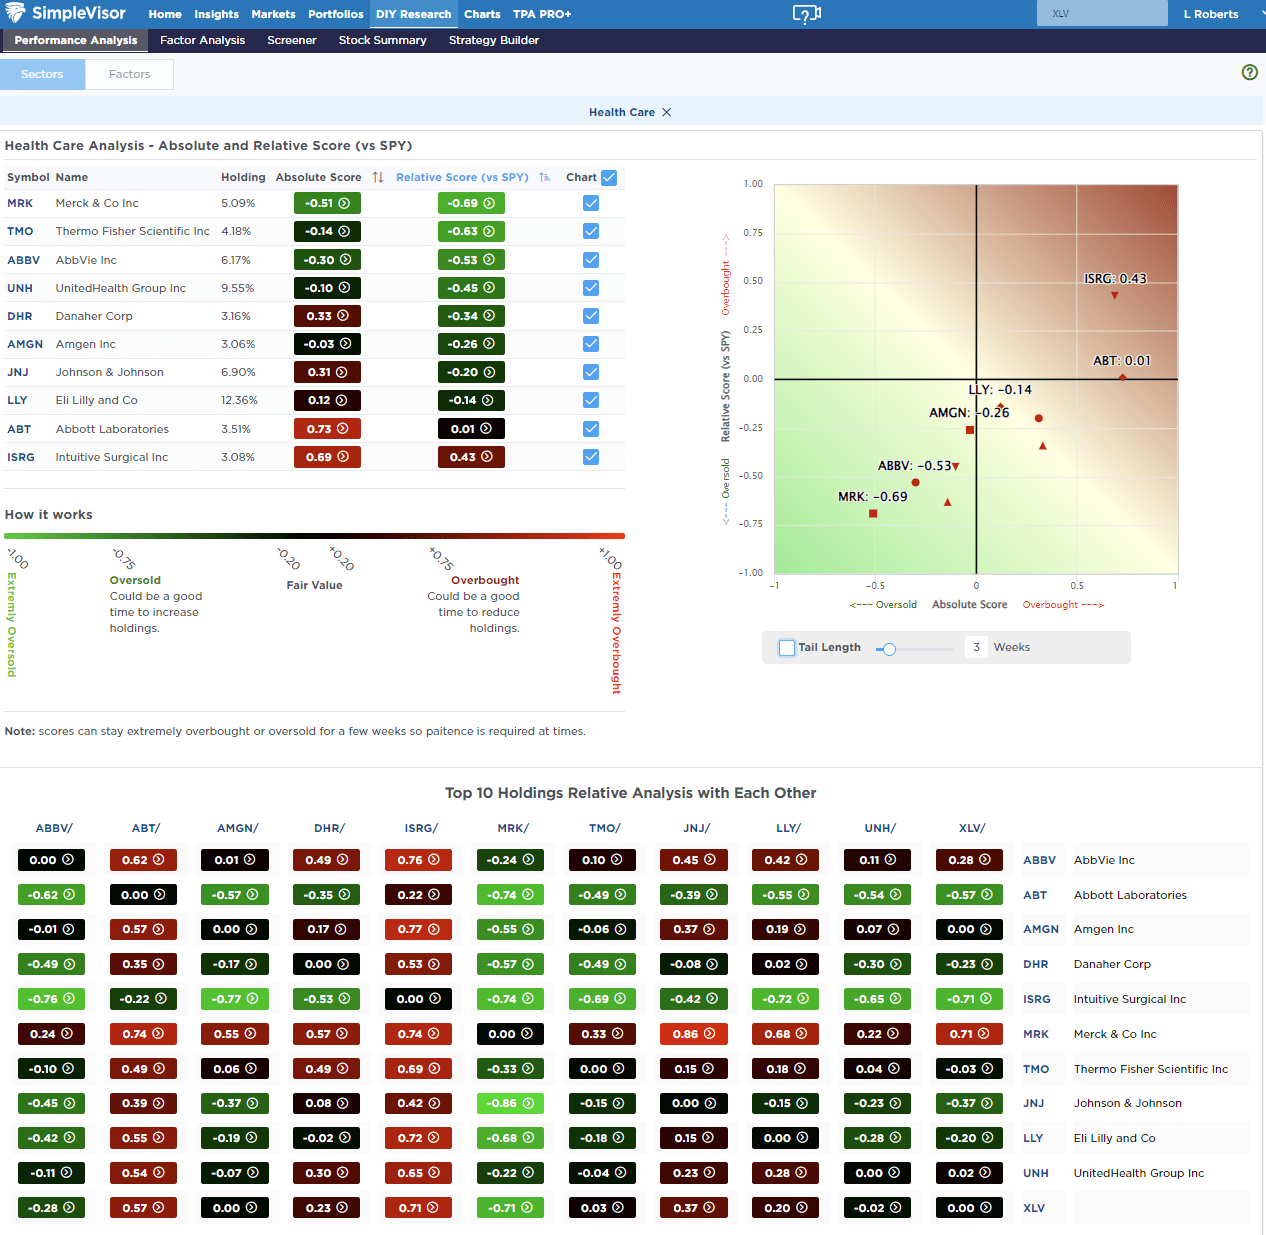
Relative Sector Analysis
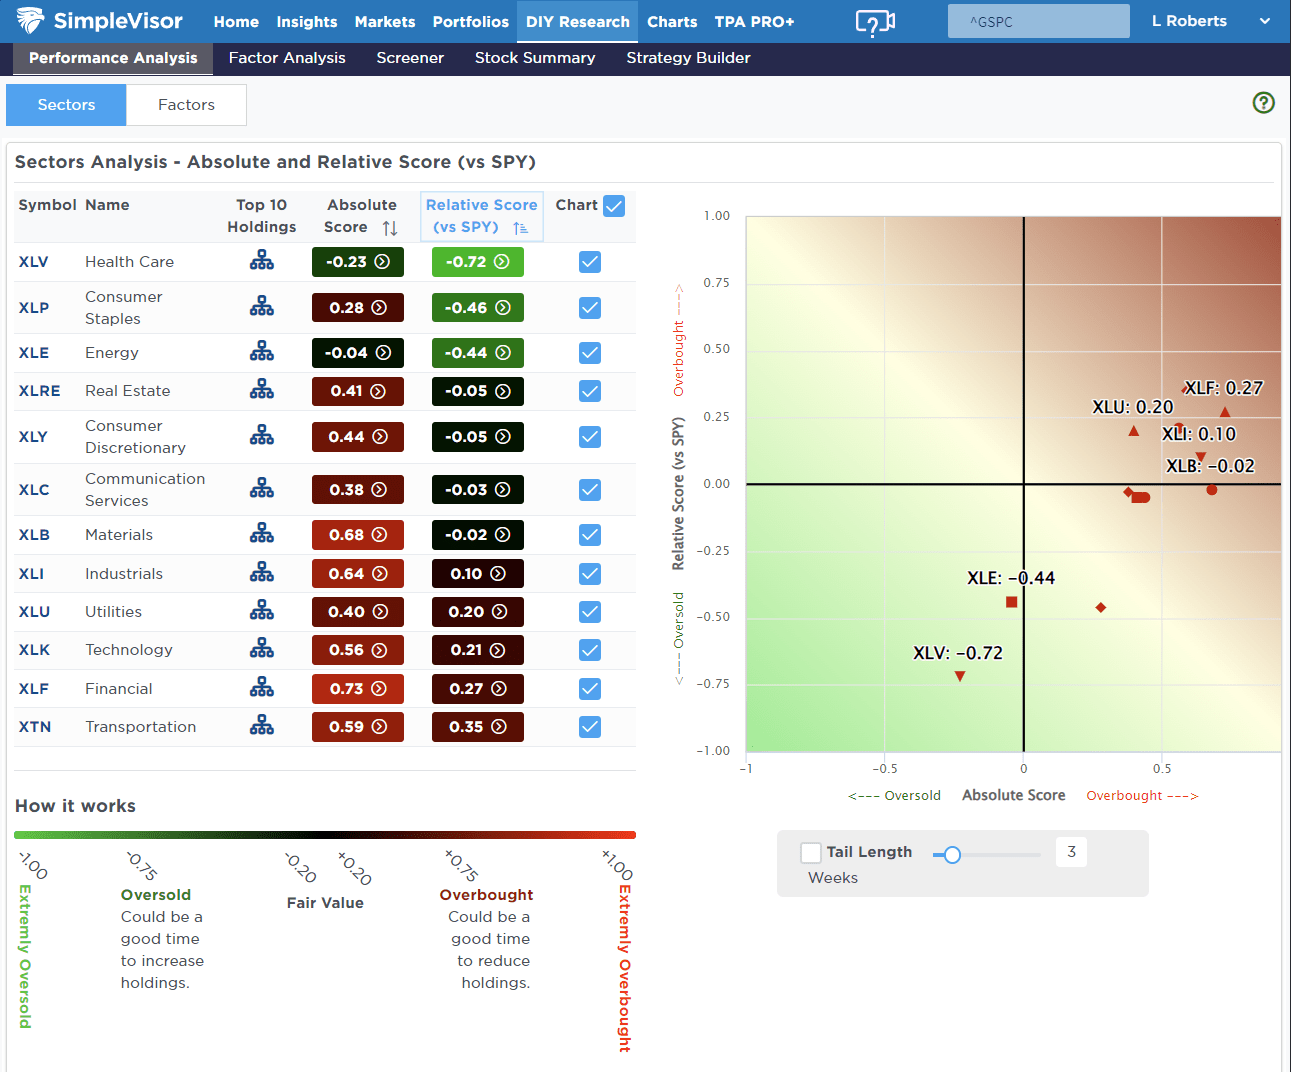
Most Oversold Sector Analysis
Sector Model Analysis & Risk Ranges
How To Read This Table
- The table compares the relative performance of each sector and market to the S&P 500 index.
- “MA XVER” (Moving Average Crossover) is determined by the short-term weekly moving average crossing positively or negatively with the long-term weekly moving average.
- The risk range is a function of the month-end closing price and the “beta” of the sector or market. (Ranges reset on the 1st of each month)
- The table shows the price deviation above and below the weekly moving averages.
Following the August selloff, we noted that on a risk/reward basis, stocks were deeply oversold and due for a rally. That has happened over the last two months with a long string of weekly gains. The market is now due for a correction or pause over the next few weeks to relieve some extreme deviations from long-term means. Discretionary stocks, Gold, Gold Miners, and the Dollar are trading well outside their risk range, and Gold Miners are 22% above long-term means. Double-digit deviations from long-term means are unsustainable, making a mean reversion increasingly likely. Bonds, on the contrary, are very oversold. I would not be surprised to see a counter-trend rally emerge soon.

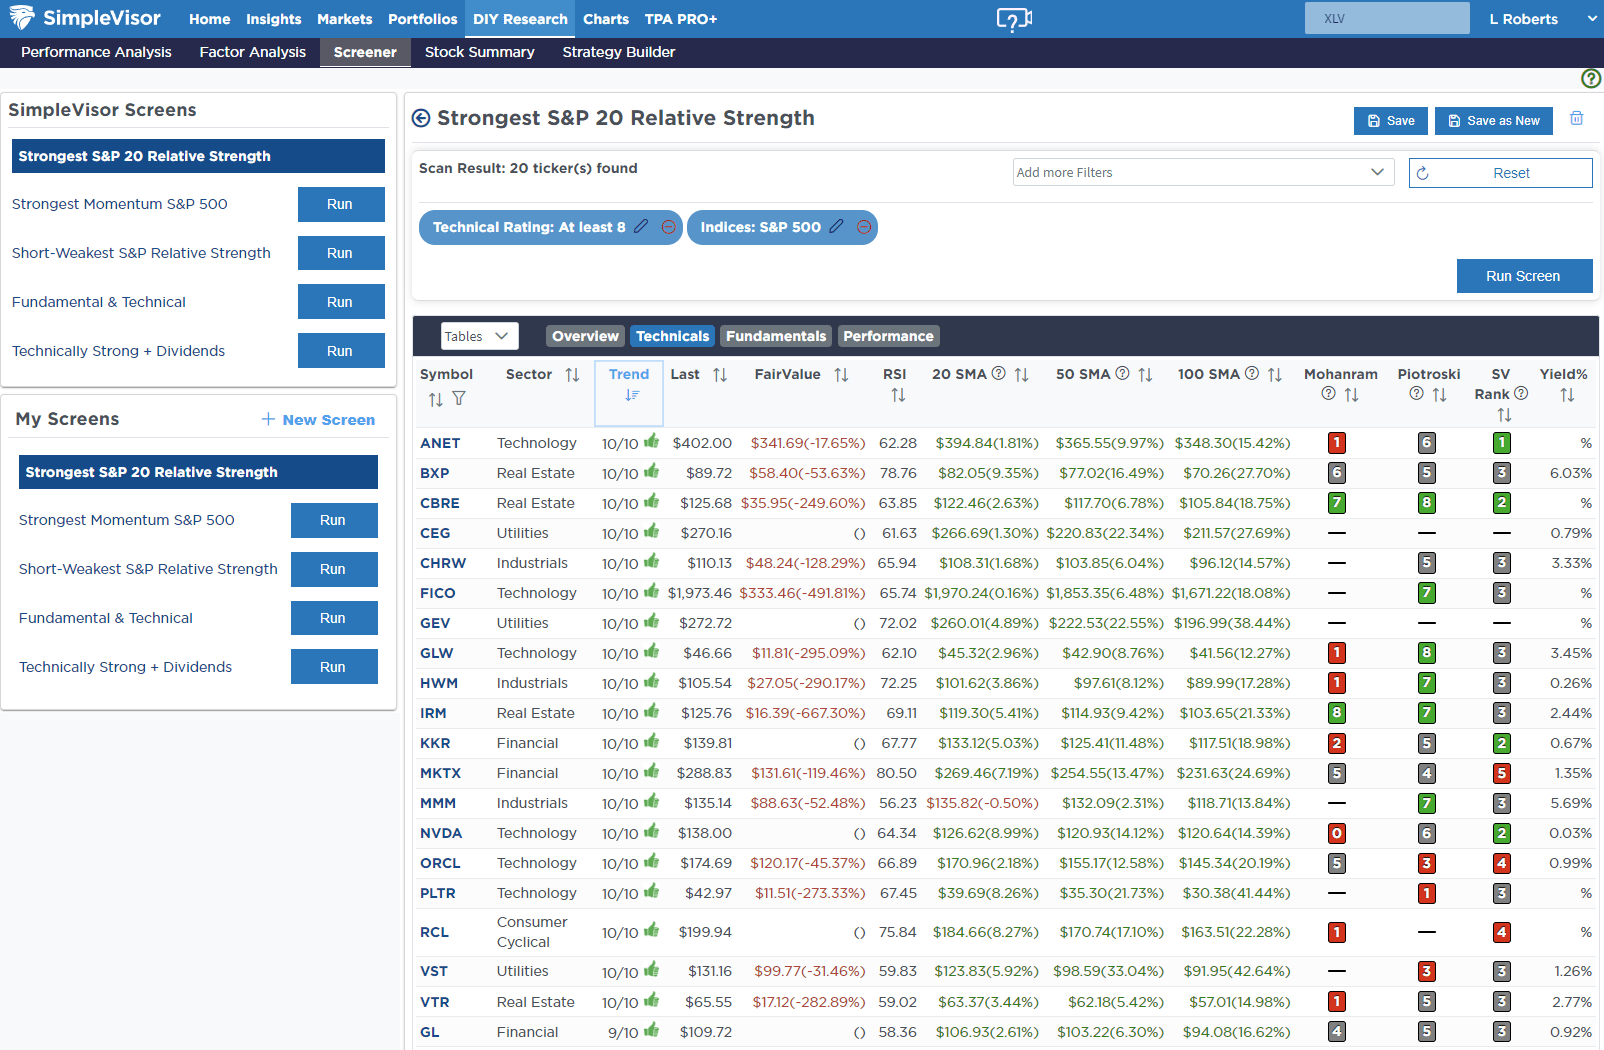
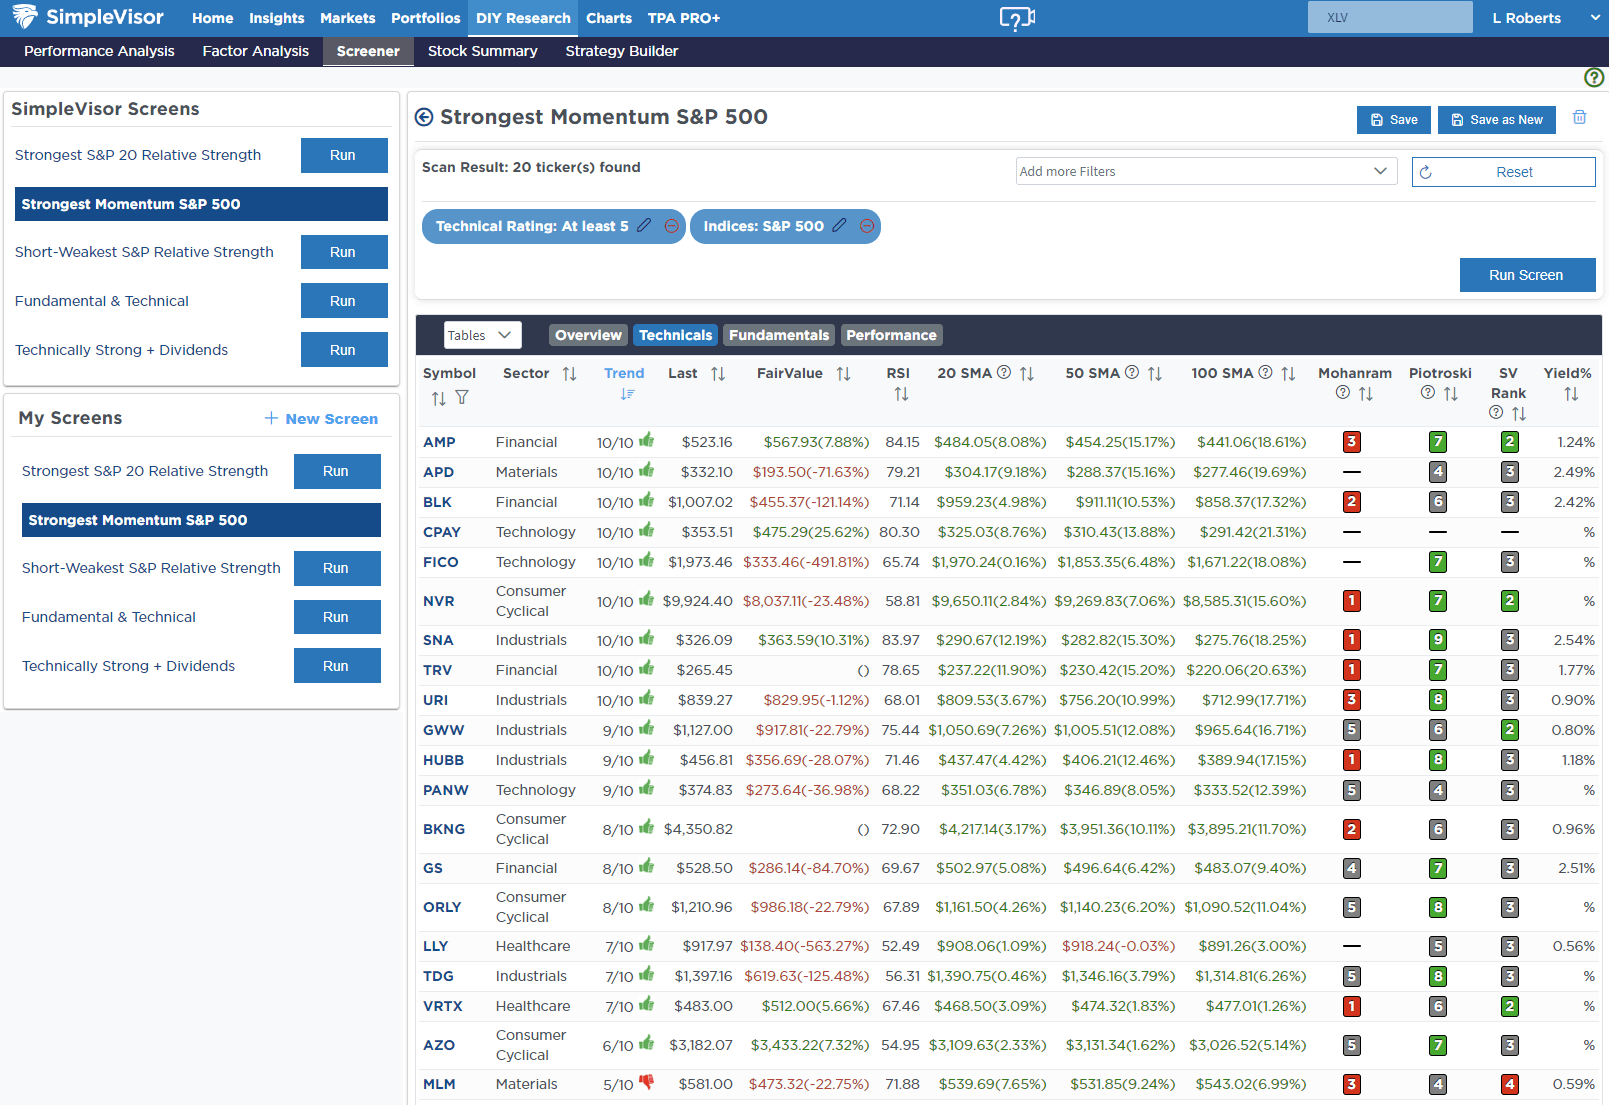
Weekly SimpleVisor Stock Screens
We provide three stock screens each week from SimpleVisor.
This week, we are searching for the Top 20:
- Relative Strength Stocks
- Momentum Stocks
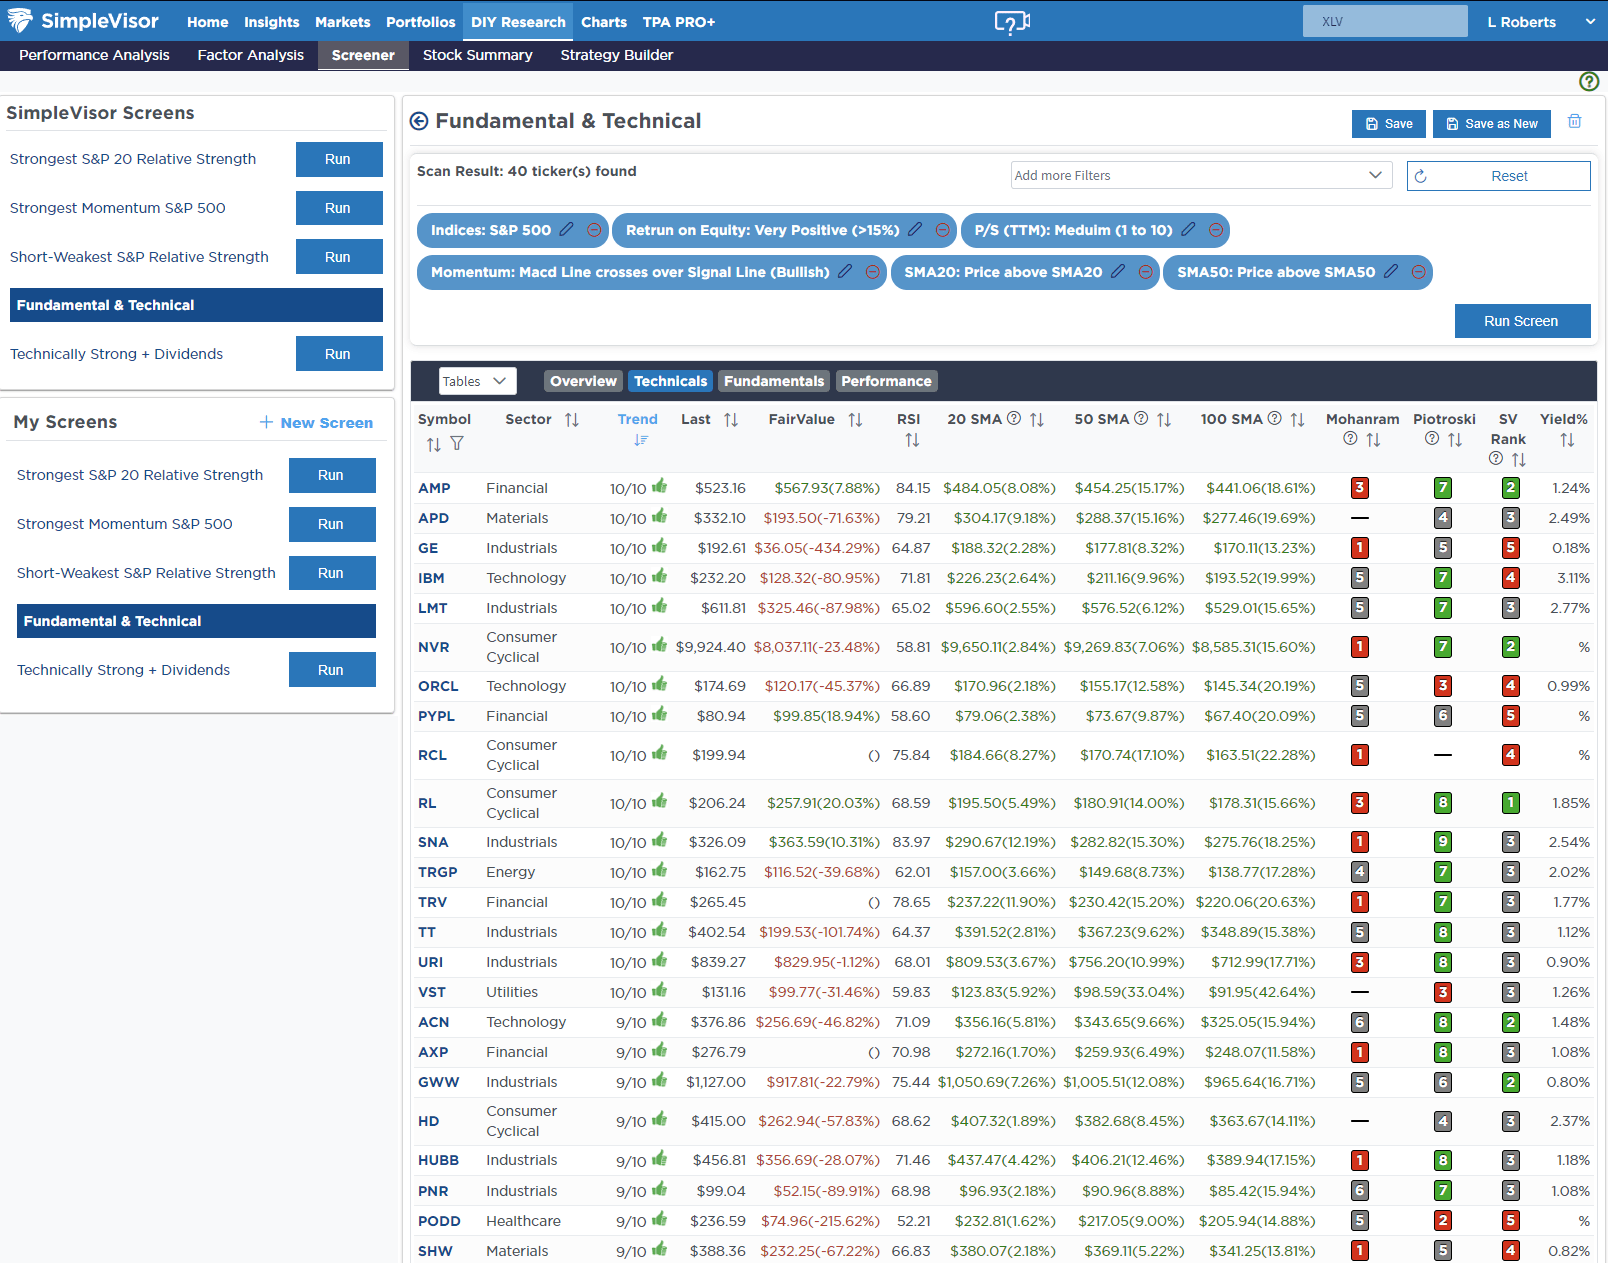
- Fundamental & Technical Strength W/ Dividends
(Click Images To Enlarge)
RSI Screen
Momentum Screen
Fundamental & Technical Screen
SimpleVisor Portfolio Changes
We post all of our portfolio changes as they occur at SimpleVisor:
Oct 15th
“We added to our energy exposure a couple of months ago, expecting a counter-trend rally in energy stocks from a move higher in oil prices. Shortly afterward, the conflict between Israel and Gaza escalated and spilled over into Iran. With the situation stabilizing, oil prices have peaked short-term, so we will rebalance our energy holdings back to target to capture some of the recent gains.”
Equity Model
- Reduce Exxon Mobil (XOM) to 1.25% of the portfolio
- Sell down Diamondback Energy (FANG) to 1% of the portfolio.
- Reduce OneOk (OKE) to 1.75% of the portfolio.
ETF Model
- Reduce iShares Energy ETF (XLE) to 4% of the portfolio.
Lance Roberts, C.I.O.
Have a great week!

