
The graph below from Bianco Research shows a stunning change in sentiment among stock market newsletter writers. The top graph shows that on July 23rd, newsletter writers were extremely bullish. In fact, such a high level of bullish optimism has only been recorded twice since 1990. The Investor’s Intelligence survey of newsletter writers fell to its long-term average in only two weeks. Accordingly, such a decline in such a short period is one for the books.
The second graph charts two-week changes in newsletter writers’ bullishness. The recent decline was the sharpest since the crash of 1987. That is stunning, considering that on Black Monday in 1987, the S&P 500 had its largest one-day decline in history, falling over 20%. The recent decline was 8%, but over two weeks. Jim Bianco summarizes newsletter writers’ sentiment over the last couple of weeks as follows:
Did the world end in the last 14 days and I did not get the memo? This metric suggests that investment professionals who get paid to write newsletters freaked about the stock market over the last 14 days to a degree not seen in the last 37 years.

What To Watch Today
Earnings

Economy
Market Trading Update
As noted yesterday, patience pays in a volatile market. Often, during sharp market corrections, our initial reaction is to “do something.” However, as is often the case, remaining calm tends to be more prudent. Stocks have essentially wiped out all the losses from last week’s market meltdown, and traders await key inflation data that will help shape the outlook for the Federal Reserve’s next steps.
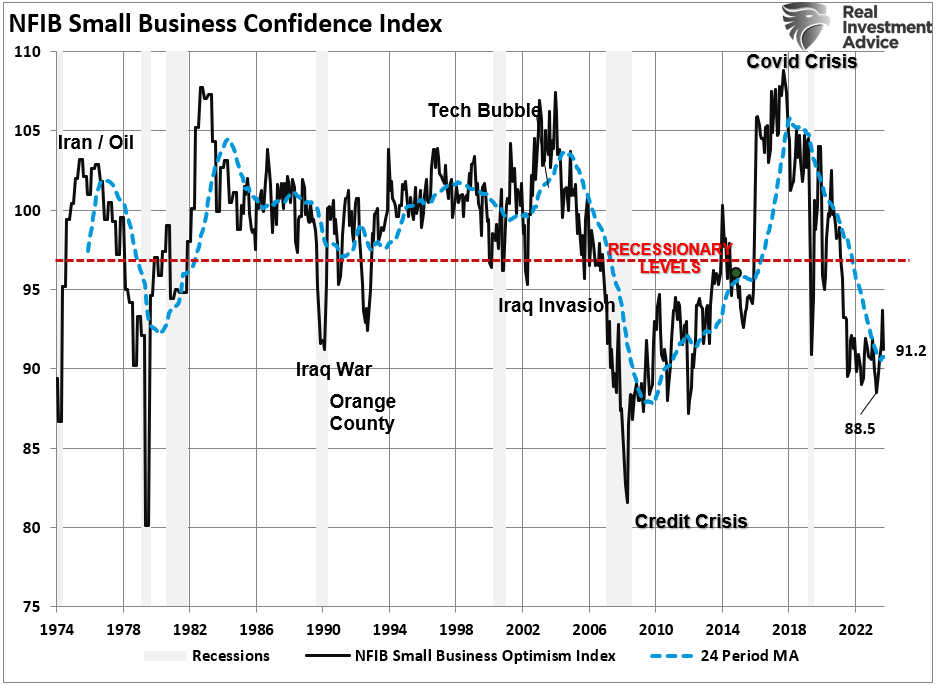
We continue to suggest using near-term rallies to reduce risk and rebalance portfolios. This week’s economic data will very likely instill some volatility into the markets between PPI, CPI, and Retail Sales. Don’t sleep on this morning’s NFIB report, which is highly correlated to the annual ROC for the Russell 2000.
The most likely path for equities remains a restest of recent lows at some point. However, there is no guarantee of that, which is why we continue to navigate markets from one week to the next. For now, markets remain oversold enough to elicit a further rally, and the MACD has turned towards a “buy signal.” However, overall market action remains weak, so we suggest caution. For now, do not try to anticipate what the market will do next. Just respond tactically to the changes as they come.


Don’t Be Fooled – It’s Not Over Yet, Says TPA
TPA is a valuable add-on service available to SimpleVisor subscribers. It uses TPA’s unique brand of relative rotation analysis to help subscribers stay abreast of market and stock rotations.
Their latest analysis is worth heeding. TPA warns that recent market trends are not over. To wit:
The 4 charts below show that:
- The decline of stocks is not over
- The decline in rates is not over
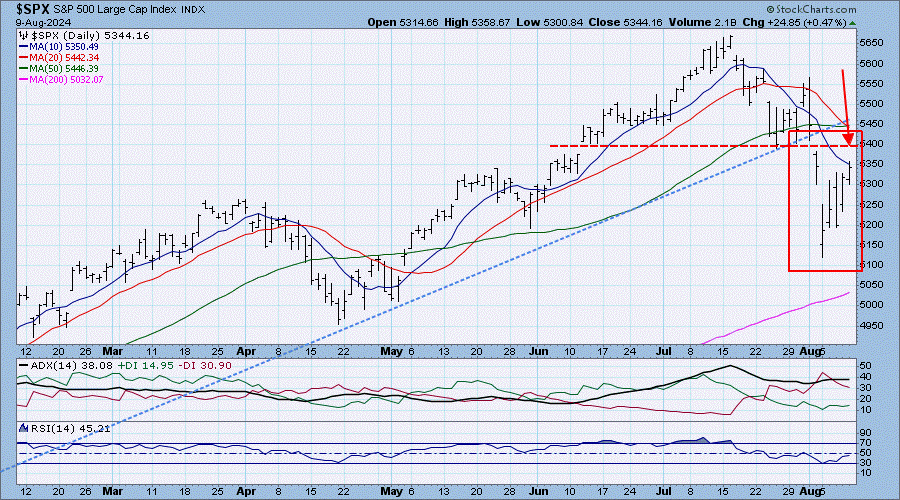
- Chart 1: The S&P500 broke down through its 9-month uptrend line. It did this on a huge gap-down day, confirming the move.
- Chart 2: The recent rally will run into resistance at the break at about 5370.
- Chart 3: The downtrend in the 10-year yield since late April led to a breakdown below support at 4.20%
- Chart 4: Long-term support for the 10-year is far below Friday’s close of 3.93%; all the way down at 3.4%.
Stocks down and rates down mean that the former stock market leaders will stall, and new leaders will emerge.
TPA subscribers have access to all of TPA’s research, as well as its trades and portfolios.


SimpleVisor Sector Analysis- Technology
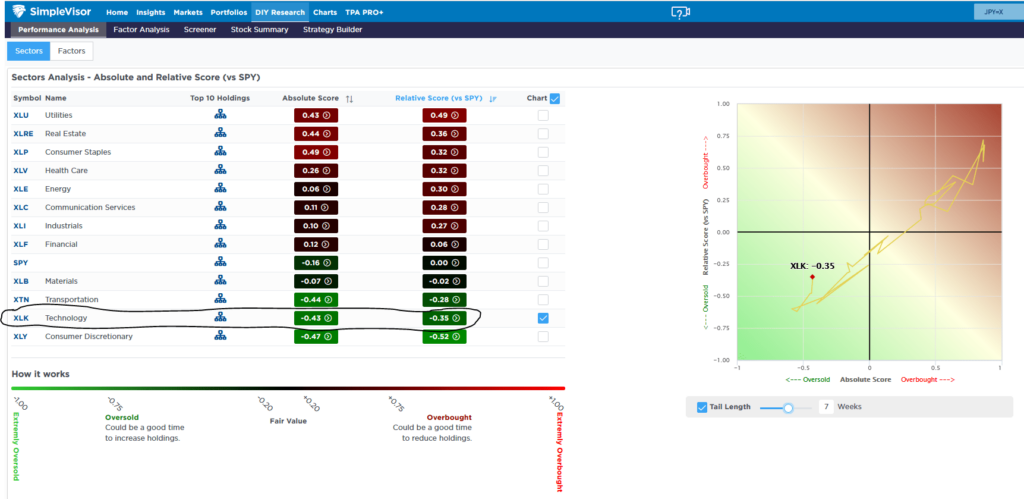
Believe it or not, the markets closed the week relatively flat despite the rollercoaster ride. Check out the Tweet of the Day below for a summary of last week’s activity. Moreover, the technology sector and the largest cap stocks, most negatively affected on Monday, finished relatively well for the week. The first table below, courtesy of SimpleVisor, shows the relative performance of each sector versus the S&P 500 for the last five days and the twenty days before last week. Technology beat the market by about half a percent last week but is still down over 8% versus the S&P 500 over the prior 20 days.
Because our relative sector analysis uses short and mid-term technical gauges, the technology sector remains oversold, as shown in the second graphic. Furthermore, the scatter plot to the right of the relative sector data shows how technology went from very overbought on an absolute and relative basis to decently oversold on both measures.

Tweet of the Day

“Want to achieve better long-term success in managing your portfolio? Here are our 15-trading rules for managing market risks.”
Please subscribe to the daily commentary to receive these updates every morning before the opening bell.
If you found this blog useful, please send it to someone else, share it on social media, or contact us to set up a meeting.

