“More than 100% of SPX market cap gains this year have been driven by just 7 stocks with 3 stocks accounting for nearly 70%.” Stuart Kaiser- Citibank. The S&P 500 rose by a scant 0.5% in May, while the Nasdaq 100 was up nearly 8%. At the same time, the equal-weighted S&P 500, representing a large majority of stocks, fell by 4%. The divergence between indexes in May is one for the record books.
The graph below puts the wide divergence of May’s monthly index returns into context. To construct the chart, we took monthly performance changes for the Nasdaq 100, S&P 500, and the equal-weighted S&P 500 and calculated the performance difference for each combination of the two indexes. For instance, the largest performance gap in May was 11.69%. That comprises the Nasdaq, up 7.42%, and the equal-weighted S&P 500, down 4.27%. The 11.69% is a four standard deviation (sigma) move! The average sigma of the three relationships (black) is the highest in at least 20 years. The only other time we witnessed divergences anywhere near May’s magnitude was in March 2020, when the pandemic wreaked havoc on markets.

What To Watch Today
Earnings
- No notable earnings reports
Economy
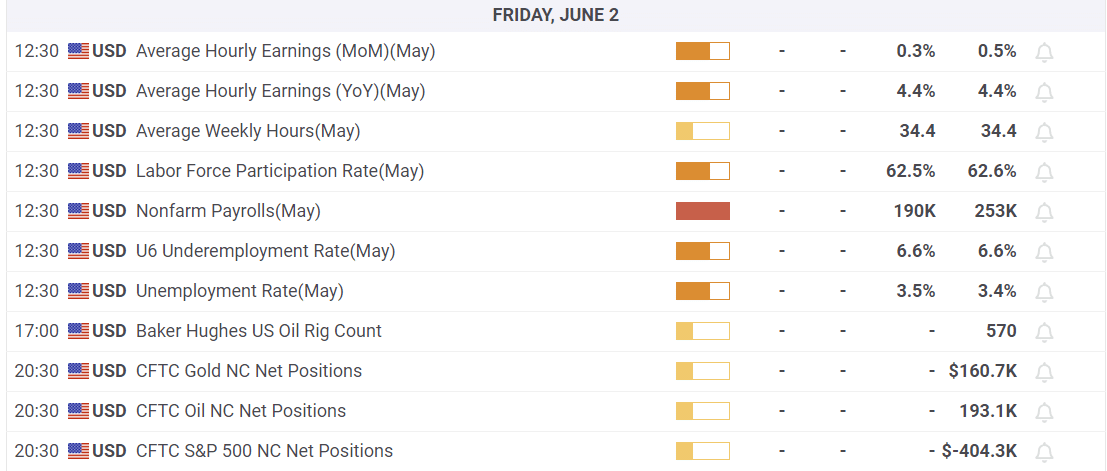
Market Trading Update
The market rallied yesterday as the debt ceiling drama was finally resolved. While we have repeatedly stated the debt ceiling crisis was a non-issue, it still weighed on market sentiment. With that hurdle now behind the market, as the passage in the Senate is mostly assured, today’s employment report will be the next focal point for traders.
Given yesterday’s strong ADP report, it is likely that today’s employment report will top estimates once again. Strong employment is not Fed-friendly in trying to reduce inflation. With the Fed meeting in just two weeks, the market continues to think the Fed will now pause on rate hikes and potentially cut rates later this year. So far, the data is not supportive of either hope.
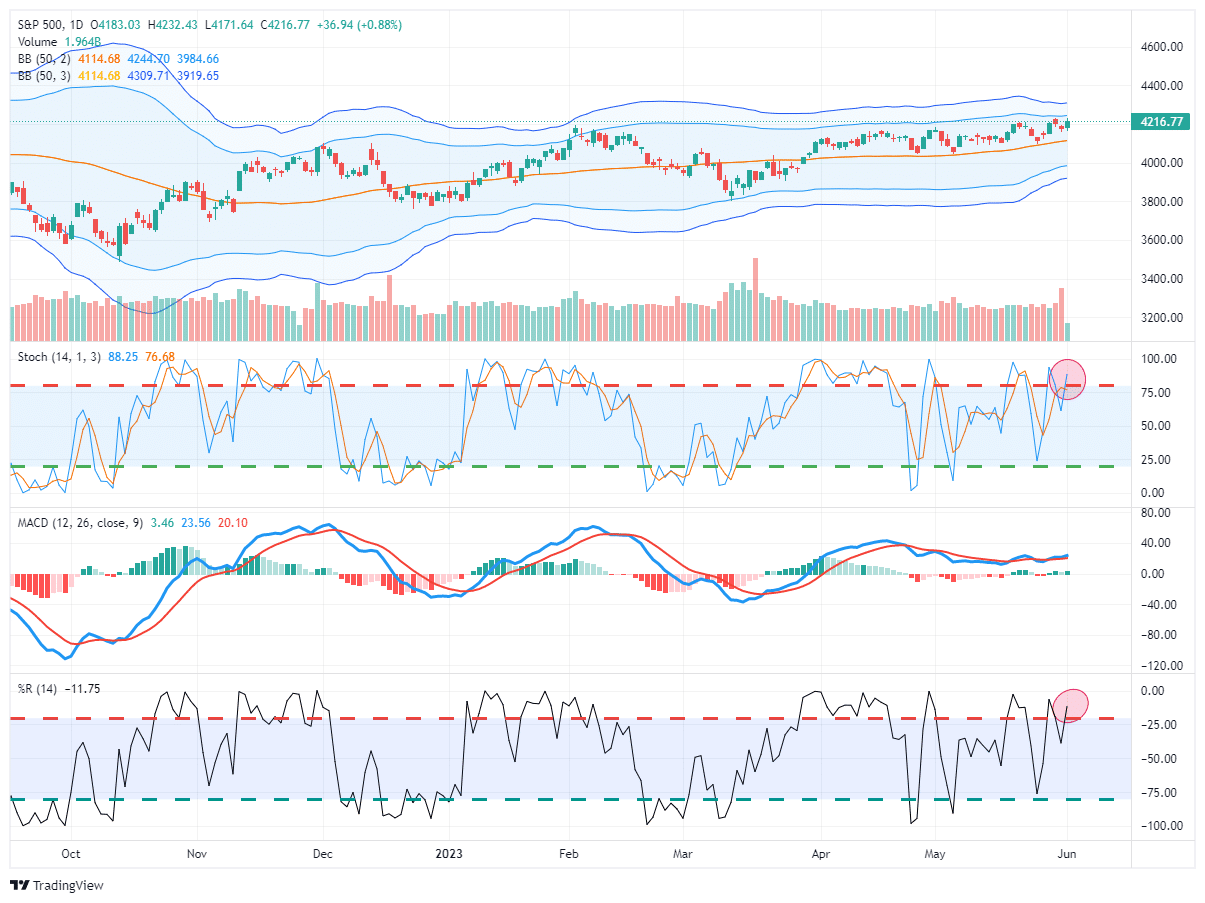
Nonetheless, the market rose above the 4200 resistance level again, and a break above Tuesday’s opening high will clear the way for a further advance. However, while the market is on a buy signal currently, it is getting overbought and pushing the upper end of its Bollinger band range.

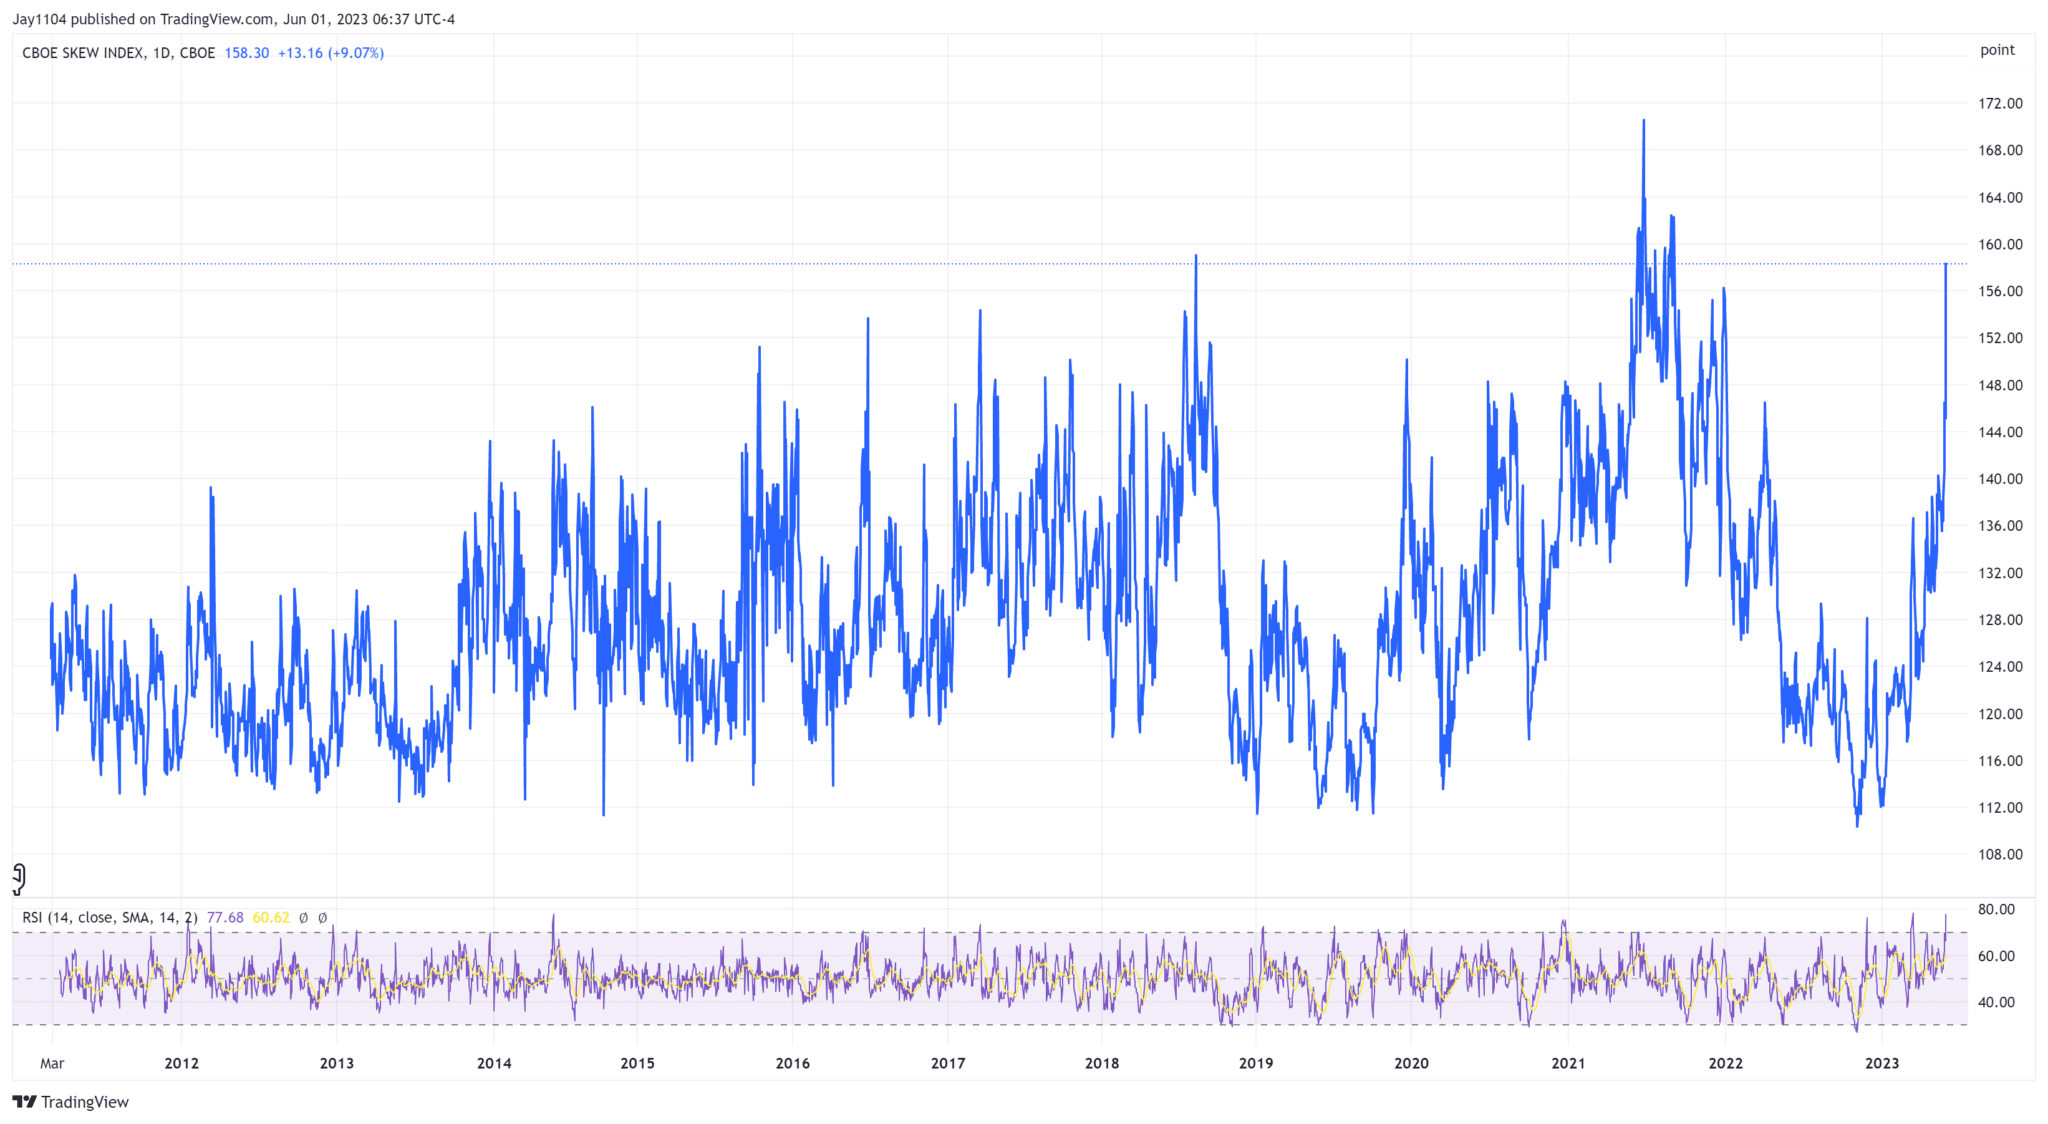
CBOE Skew Index Points to Perceived Risk
While the VIX volatility index points to relatively low levels of perceived risk, the CBOE Skew Index tells a different story. Unlike the VIX, the Skew index measures implied or expected volatility of out-of-the-money options. So, while markets may seem steady, an increasing number of traders are nervous that an outlier event, bullish or bearish, may occur. As we wrote in yesterday’s Commentary, markets tend to climb a wall of worry. If so, the high skew may be bullish for the time being.
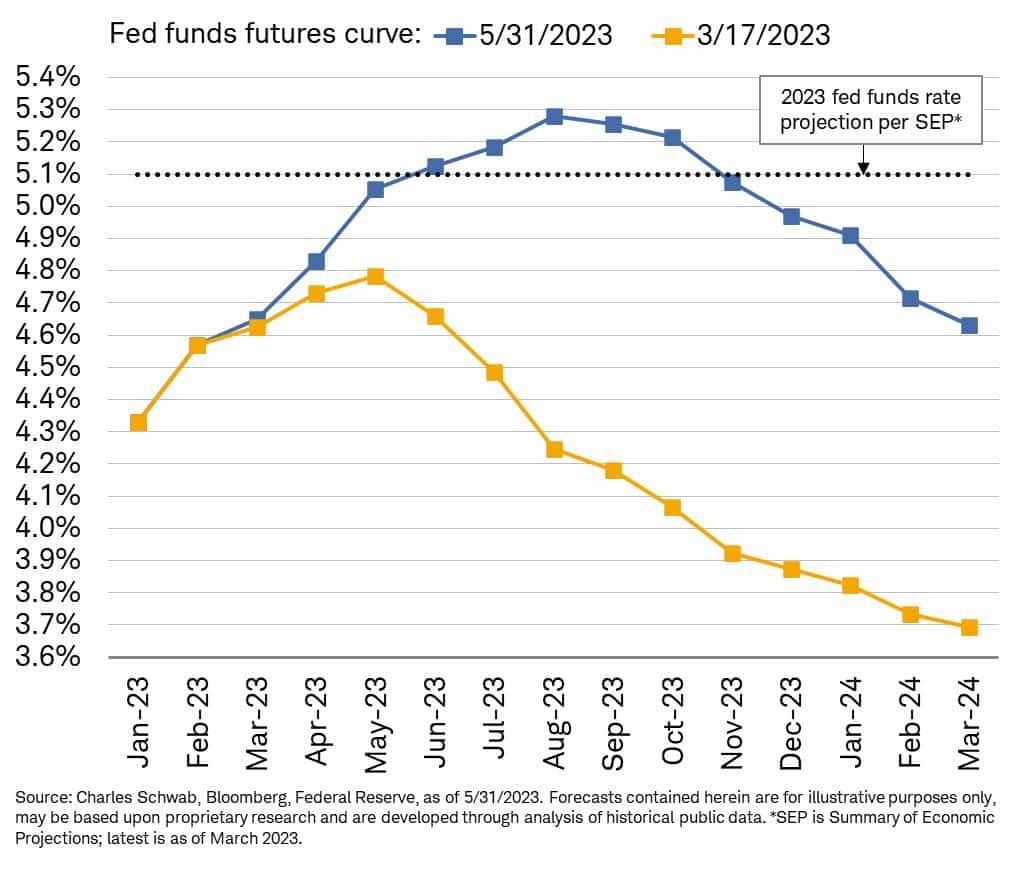
Fed Funds Futures
The Charles Schwab graph below shows that the market is slowly accepting the Fed’s “higher for longer” narrative. Labor market strength, resilient economic activity, and sticky inflation is causing traders to price out the odds of rate cuts later this year. As the graph shows, the Fed Funds futures curve has taken 1% of rate cuts for later this year off the table.
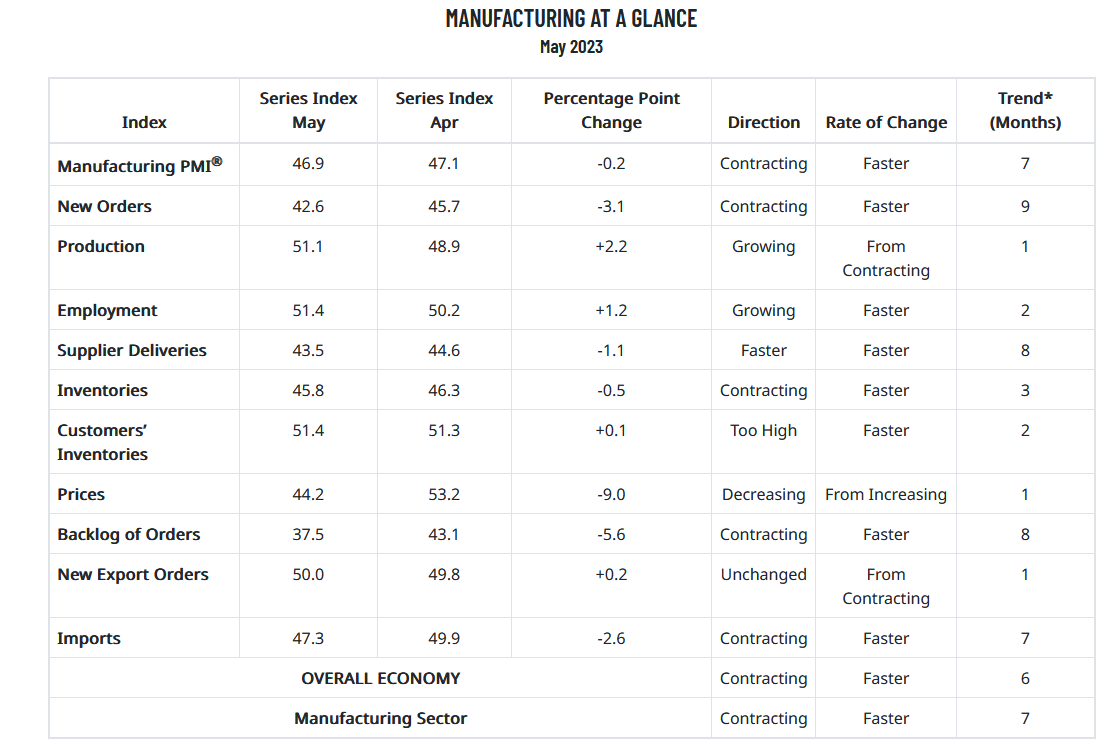
Manufacturing Weakness Continues
The manufacturing industry continues to exhibit weakness. The latest ISM manufacturing survey fell slightly to 46.9. New orders, a good leading indicator, fell for a ninth consecutive month. At 42.6, it sits just a bit above recessionary levels. The report did have some good and bad news for the Fed. The employment index rose to 51.4 from 50.2, which will keep upward pressure on wages. Such a situation is inflationary. However, the prices paid component declined from 53.2 to 44.2.
The following quote from Tom Fiore, the Chair of the ISM, discusses a marked weakening in May.
Price instability remains and future demand is uncertain as companies continue to work down overdue deliveries and backlogs. Seventy-six percent of manufacturing gross domestic product (GDP) is contracting, up from 73 percent in April. A larger number of industries contracted strongly, as the proportion of manufacturing GDP registering a composite PMI® calculation at or below 45 percent — a good barometer of overall manufacturing weakness — increasing to 31 percent in May, compared to 12 percent in April. May performance was clearly weaker compared to April,”
While manufacturing is bearish, the service sector surveys remain in economic expansion territory. Further services account for about three-quarters of the economy. However, despite the steadily declining share of manufacturing in the entire economy, it has proven to be a solid leading economic indicator.
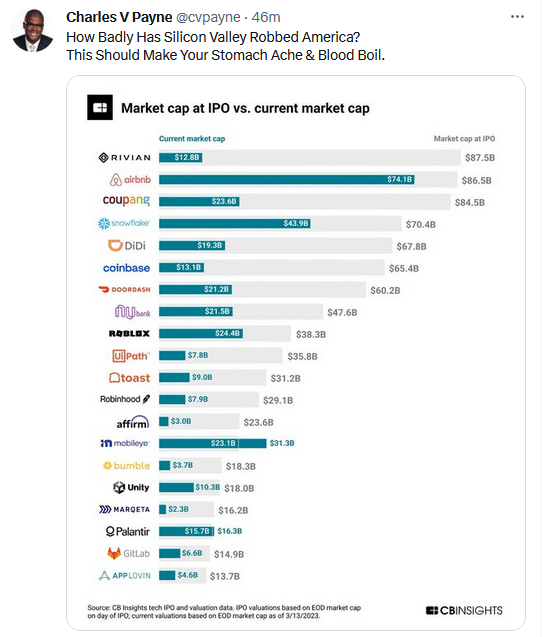
Tweet of the Day
Please subscribe to the daily commentary to receive these updates every morning before the opening bell.
If you found this blog useful, please send it to someone else, share it on social media, or contact us to set up a meeting.

