Equities are opening flat this morning despite volatility in other markets. U.S. bond yields are 4bps higher, crude oil $1 lower, and gold about $20 weaker. Other than some strengthening in the dollar, there is not much news to attribute to the moves.
[dmc]
What To Watch Today
Economy
- No notable reports scheduled for release
Earnings
- Coupa Software (COUP) is expected to report adjusted loss of 6 cents per share on revenue of $163.24 million
Politics
- President Biden is set to travel to both New Jersey and New York today to inspect damage from Hurricane Ida. Last week, he visited Louisiana and told residents there “I know you’re hurting.”
- On Capitol Hill, the full U.S. House of Representatives and Senate only have pro forma sessions until next week but some lawmakers are set to gather in the coming days as they continue to assemble the Democrat’s proposed $3.5 trillion reconciliation package.
- Much farther afield, U.S. Secretary of Commerce Gina Raimondo is in Estonia for the Tallinn Digital Summit. She delivered the keynote address overnight with a focus on the importance of digital infrastructure and connectivity in the global economy, her office says.
Courtesy of Yahoo
What Does A Melt-Up Look Like?
Currently, the stock-bond ratio is 3-standard deviations above the 3-year moving average. The angle and duration of the ascent have all the earmarks of a “melt-up.”
“A melt-up is a sustained and often unexpected improvement in the markets, driven partly by a stampede of investors who don’t want to miss out on its rise, rather than by fundamental improvements in the economy. Gains that a melt-up creates are considered to be unreliable indications of the direction the market is ultimately headed. Melt-ups often precede meltdowns.” – Investopedia

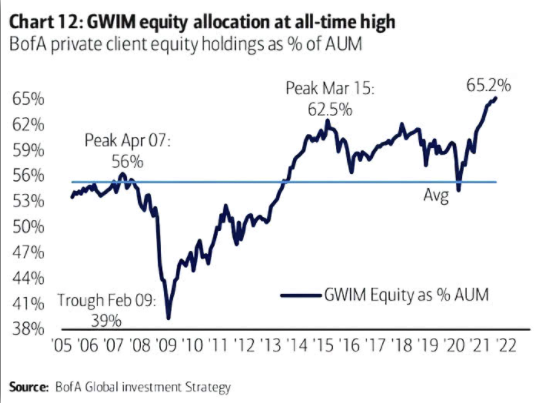
Investors Really Are “All In”
The “melt-up,” as noted, is driven by investors piling into equities under the assumption they are missing out.
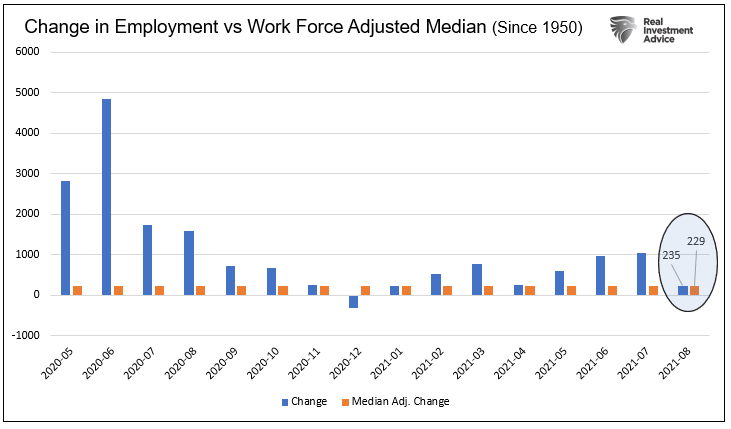
Employment In Perspective
So, was the gain of 235k jobs normal? The graph below compares the monthly change in jobs as a percentage of the workforce to the median percentage over the last 70 years. As we highlight below, 235k job growth is perfectly normal.
Taxing Stock Buybacks
An idea floating around Democrat circles in Washington is taxing stock buybacks or treating them as taxable dividends. Is it likely? Probably not, given the massive lobbying efforts of corporate America. However, if they are able to pass such legislation, a key driver of stock prices may have a limited effect going forward. While we think the odds of passage are low, this bears watching closely.
Underwhelming Jobs Report
The BLS Employment Report fell short of expectations with only 235k jobs added versus estimates of 750k. Despite the relatively minimal number of jobs added, the unemployment rate fell from 5.4% to 5.2%. The participation rate is unchanged at 61.7%. Hourly earnings were higher than expected at +0.6% versus +.04% last month. While positive for employees, higher wages, if sustained, will pressure corporate earnings and can put further upward pressure on prices.
So what does this report mean for the prospects of tapering? Chair Powell has repeatedly said taper will come with significant improvement in the jobs market. While the August number was well below expectations, the unemployment rate fell by 0.2%. Further, the average gain for the last three months, including today’s data, is +750k. That is about 3x the rate of pre-pandemic levels. We should also keep in mind, there are a lot of seasonal factors in August. In an odd year like this one, the seasonal adjustments can wreak havoc on the data. Today’s report may cause Powell to pause, but we suspect many other Fed members are concerned about inflation. The strong wage growth will only further their concern that inflation may be more than transitory.
Our guess is the market will push out expectations for tapering QE to a November-January time frame. Despite the poor data, bonds are trading poorly this morning which affirms our taper forecast.
The chart below from the BLS provides some context for the pace of jobs recovery by industry.

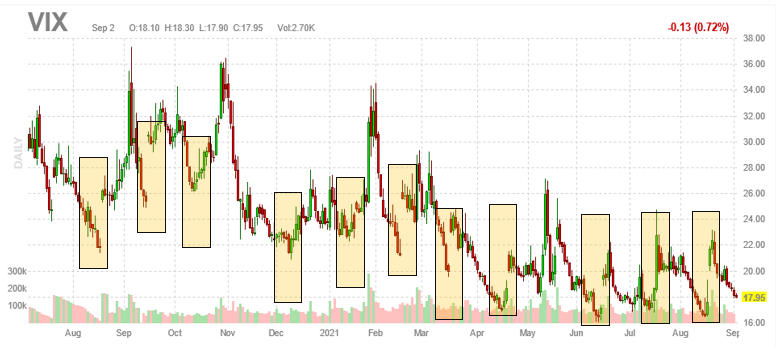
Will the mid-month VIX pattern hold yet again?
The graph of the VIX (volatility) below highlights a fairly reliable pattern that has been occurring mid-month for the last year. As shown, VIX tends to decline into the middle part of most months, rally sharply for a few days, and head lower again. The pattern has been especially pronounced the last three months. One likely cause is the combination of mid-month options expiration and low volumes. The volume of trades needed to cover and roll options contracts may be enough to push volatility higher at these times.
September is thus far looking to repeat the pattern. A nice short-term trade may again occur if VIX approaches the 16.00-16.50 range later next week. 16 has been the recent floor so if you do get long the VIX and try to take advantage of the pattern, keep risk targets in place below 16.
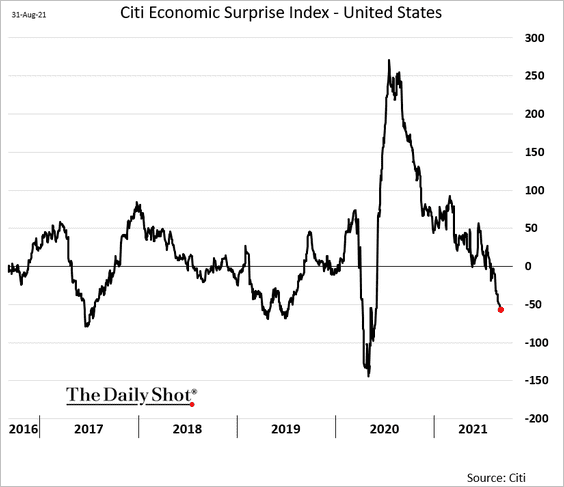
Deteriorating Optimism
Shown below, courtesy of the Daily Shot, the Citi Economic Surprise Index continues to decline. Any reading below zero denotes economists’ forecasts are too optimistic. The recent string of weaker economic data has caught them off guard. Despite the implications of weakening economic growth, the positive correlation between the graph and stock prices has significantly deteriorated over the last year.