Inside This Week’s Bull Bear Report
- Long-Term Signals & Forward Returns
- How We Are Trading It
- Research Report – Japanese Policies & The Future Of America
- Youtube – Before The Bell
- Market Statistics
- Stock Screens
- Portfolio Trades This Week
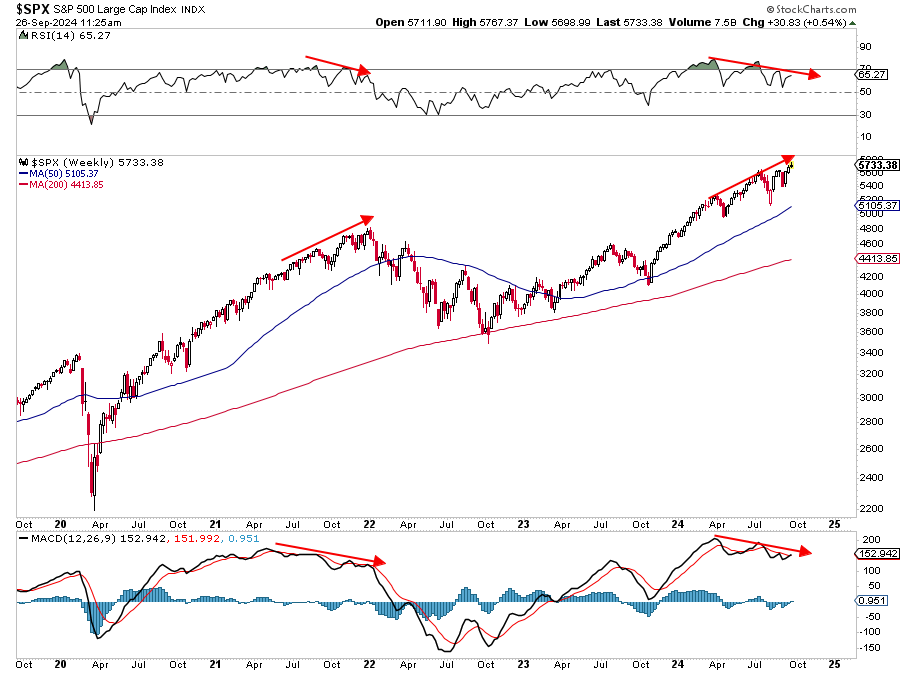
Negative Divergences Return
As noted last week, the rapid rally from the lows of three weeks ago had some good and bad elements.
“The positive is that the rally reversed the MACD “sell signal,” suggesting the bullish bias has returned. Furthermore, the rally cleared all-important resistance levels with ease. The market quickly crossed the 100, 50, and 20 DMAs, leaving only recent all-time highs as significant next resistance. The only negative to the advance is the nearly complete reversal of the previous oversold conditions. Such isn’t a critical issue, but it suggests we will likely see a minor pullback to retest support at the 50-DMA. Such will provide a better entry point to add exposure as needed.”
This past week, the market struggled to make gains, and as shown, its momentum has slowed. While such does not mean a significant correction is imminent, it does suggest that the upside is likely limited. Investors should expect a continued consolidation or pullback to previous support levels. Notably, a negative divergence is developing between momentum, strength indications, and market performance. We last mentioned such a negative divergence was in late July before the August correction.
However, the timing of such a consolidation or correction is always tricky. Two potential catalysts may lead to a short-term correction to the 100-DMA or recent lows over the next month, where buyers previously acted. The first is that corporate buybacks, which supported the rally from the recent lows, will begin to fade starting September 5th. The second is the upcoming election in November, when managers may de-risk portfolios ahead of that event.
While markets can make all-time highs soon, the momentum and relative strength decline is indeed a cautionary tale. Just as a reminder, September and October tend to be weak performance months for the market, and the addition of a leadership or policy change could add to that risk.
Continue to manage risk as needed.
Need Help With Your Investing Strategy?
Are you looking for complete financial, insurance, and estate planning? Need a risk-managed portfolio management strategy to grow and protect your savings? Whatever your needs are, we are here to help.

Valuations And Lower Forward Returns
Last week, we discussed the rash of bearish headlines that suggest impending doom and gloom. Unsurprisingly, I received several messages from rather upset individuals chastising me for “not understanding” the issues that would lead to more disastrous outcomes.
Let me clarify a couple of things.
First, I never said that a significant reversion or bear market would never happen. I fully expect that one eventually will. However, what is missing are the ingredients and catalysts for such an event in 2024 and, most likely, 2025. Beyond that time frame, neither I nor anyone else has any clue. As discussed, we must manage the probabilities versus the possibilities of market events in the near term. To wit:
“The issue with extremely bearish headlines is the worst possible outcomes rarely occur. The chart below is a normally distributed ‘bell curve’ of potential events and outcomes. In simple terms, 68.26% of the time, normal outcomes occur. Economically speaking, such would be a normal recession or the avoidance of a recession. 95.44% of the time, we are most likely dealing with a range of outcomes between a fairly deep recession and normal economic growth rates. However, there is a 2.14% chance that we could see another economic crisis like the 2008 Financial Crisis.
But what about ‘economic armageddon?‘ Such an event where nothing matters but ‘gold, beanie weenies, and bunker.’ is just a 0.14% possibility.”

While many assumed I said the market would NEVER correct, I did, in fact, state that such a correction could happen. However, there is a difference between a significant market correction and economic armageddon.
Secondly, valuations are indeed elevated, which historically precedes lower future returns. Such is particularly the case, given a decade of returns that were 50% higher than the long-term average. As discussed in “A Fundamental Shift,”
“There are many reasons why valuations have shifted higher over the years. The increase is partly due to economic expansion, globalization, and increased profitability. However, since the turn of the century, changes in accounting rules, share buybacks, and greater public adoption of investing (aka ETFs) have also contributed to the shift. Furthermore, as noted above, the massive monetary and fiscal interventions since the “Financial Crisis” created a seemingly “risk-free” environment for equity risk.”
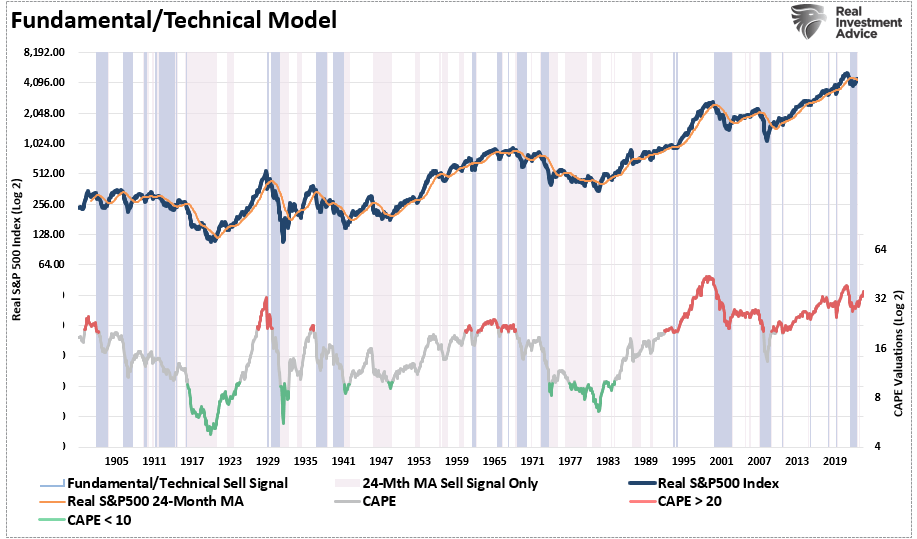
The chart shows the apparent shift in valuations.
- The “median” CAPE ratio is 15.04 times earnings from 1871-1980.
- The long-term “median” CAPE is 16.52 times earnings from 1871-Present (all years)
- The “median” CAPE is 23.70 times earnings from 1980 to the present.

There are two critical things to consider concerning the chart above.
- The shift higher in MEDIAN valuations was a function of falling economic growth and deflationary pressures, and,
- Increasing levels of leverage and debt, which eroded economic growth, facilitated higher prices.
History tells us that forward returns over the next ten years will be lower than they have been over the past ten years. That is particularly the case given the outsized annual rates of return over the last decade, 12% annually versus the historical average of 8%. Even a return to the long-term historical average will disappoint many investors.
However, that statement does not necessarily mean economic armageddon. It suggests that over the next 10 years, there could be one or two years with very negative returns (10-20%), several years with strong positive returns of more than 10%, and a few years with nearly flat returns.
Investors who try to “buy and hold” their way to investment success could be very disappointed. Conversely, a risk-managed and active portfolio could do quite well in an environment of increased volatility.
The Long-Term Technical Suggests Lower Returns
So, what would cause these more volatile and lower returns in the future? The answer is unknown. However, valuations are terrible market timing indicators and should be utilized for such. While valuations provide the basis for calculating future returns, technical measures are more critical for managing portfolio risk.
Investors are exuberant about stock ownership, vital to creating multiple expansions and fueling bull market advances. High valuations, bullish sentiment, and leverage are meaningless if the investors do not own the underlying equities. As discussed in “Household Equity Allocations,” the current levels of household equity ownership have reverted to near-record levels. Historically, such exuberance has been the mark of more important market cycle peaks.

While household equity ownership is critical to expanding the bull market, the technical measures provide an understanding of when excesses occur. One measure we focus on is the deviation of price from long-term means. The reason is that markets are bound to long-term means over time. For a “mean” or “average” to exist, prices must trade above and below that price over time. Therefore, we can determine when deviations are approaching more extreme levels by viewing past deviations. Currently, the deviation of the market from its underlying 4-year average is approaching levels more consistent with market peaks. That deviation, combined with monthly overbought conditions, was historically a precursor to an eventual mean-reverting event.
The following analysis uses quarterly data and evaluates the market using valuation and technical measures. From a long-term perspective, the market is trading at more extreme levels. The quarterly Relative Strength (RSI) measure is above 70, the deviation is close to a historical record, and the market trades nearly 3-standard deviations above its quarterly mean. As noted, while these valuation and technical measures can undoubtedly become more extreme, the ingredients for an eventual mean reverting event are present.
Of course, the inherent problem with long-term analysis is that while valuations and long-term technical measures are more extreme, they can remain that way for much longer than logic suggests. However, we can construct a valuation and technical measures model using the data above. As shown, the model triggered a “risk off” warning in early 2022 when high valuations collided with an extreme deviation of the market above the 24-month moving average. That signal was reversed in January 2023, as the market began to recover. While the market has not yet triggered a new sell signal, the ingredients of valuations and deviations are present.
The Ingredients Are Missing A Catalyst
The problem with long-term technical measures and valuations is that they move slowly. Therefore, the general assumption is that if high valuations do not lead to an immediate market correction, the measure is flawed.
In the short term, “valuations” have little relevance to what positions you should buy or sell. It is only momentum, the direction of the price, that matters. Managing money, either “professionally” or “individually,” is a complicated process over the long term. It seems easy in the short term, particularly amid a speculative mania. However, as with every bull market, a strongly advancing market forgives investors’ many investing mistakes. The ensuing bear market reveals them in the most brutal and unforgiving outcomes.
Providing risk management to portfolios over time has a clear advantage. The problem is that most individuals cannot manage their own money because of “short-termism,” as shown by shrinking holding periods.

While “short-termism” currently dominates the investor mindset, the ingredients for a reversion exist. However, that does not mean one will happen tomorrow, next month, or even this year.
The combination of liquidity, momentum, and psychology is inherently dangerous; however, these risks remain “inert” until exposed to a suitable catalyst. What causes the next “liquidation cycle” is currently unknown. It is always an unexpected, exogenous event that triggers a “rush for the exits.”
Many believe that “bear markets” are now a relic of the past, given the massive support central banks provide. Maybe that is the case. However, the fact that such beliefs were always present before more severe mean-reverting events is worth remembering.
To quote Irving Fisher in 1929, “Stocks are at a permanently high plateau.”
Conclusion
This week’s discussion is a thought experiment examining long-term risks to investors. It offers two critical takeaways.
- The deviation from the long-term means is extreme, suggesting a more significant decline is possible in the future and
- While valuations remain elevated relative to long-term history, if there has been a permanent shift in valuations, the subsequent correction may not be as deep as some expect.
Importantly, investors repeatedly make the mistake of dismissing valuations in the short term because there is no immediate impact on price returns. As noted above, valuations, by their very nature, are HORRIBLE predictors of 12-month returns. Therefore, investors should avoid any investment strategy that has such a focus. However, valuations are excellent predictors of expected returns in the longer term.
From current valuation levels, investors’ rate of return over the next decade will be lower than it was over the past decade. That is unless the Federal Reserve and the government launch another massive round of monetary stimulus and cut interest rates to zero.
That does not mean that markets will produce single-digit rates of return each year for the next decade. There will likely be some tremendous investing years over that period and a couple of tough years in between.
That is the nature of investing and the market cycles.
How We Are Trading It
We remain allocated to equities, although we are slightly underweighting our targets and reduced our exposure to technology back in July. Furthermore, we are also underweight longer-duration bonds in favor of short-term bills. With bonds currently overbought, we await a short-term rise in yields to provide a better entry point to lengthen our overall bond duration.
While the long-term risks are undoubtedly obvious, as noted, such can take much longer to appear than logic would predict. Therefore, we continue to manage short-term risk as needed to control returns and volatility.
We continue to keep moves small. As the market confirms its next direction, we will adjust accordingly.
Have a great week.
Research Report

Subscribe To “Before The Bell” For Daily Trading Updates
We have set up a separate channel JUST for our short daily market updates. Please subscribe to THIS CHANNEL to receive daily notifications before the market opens.
Click Here And Then Click The SUBSCRIBE Button
Subscribe To Our YouTube Channel To Get Notified Of All Our Videos
Bull Bear Report Market Statistics & Screens

SimpleVisor Top & Bottom Performers By Sector
S&P 500 Weekly Tear Sheet

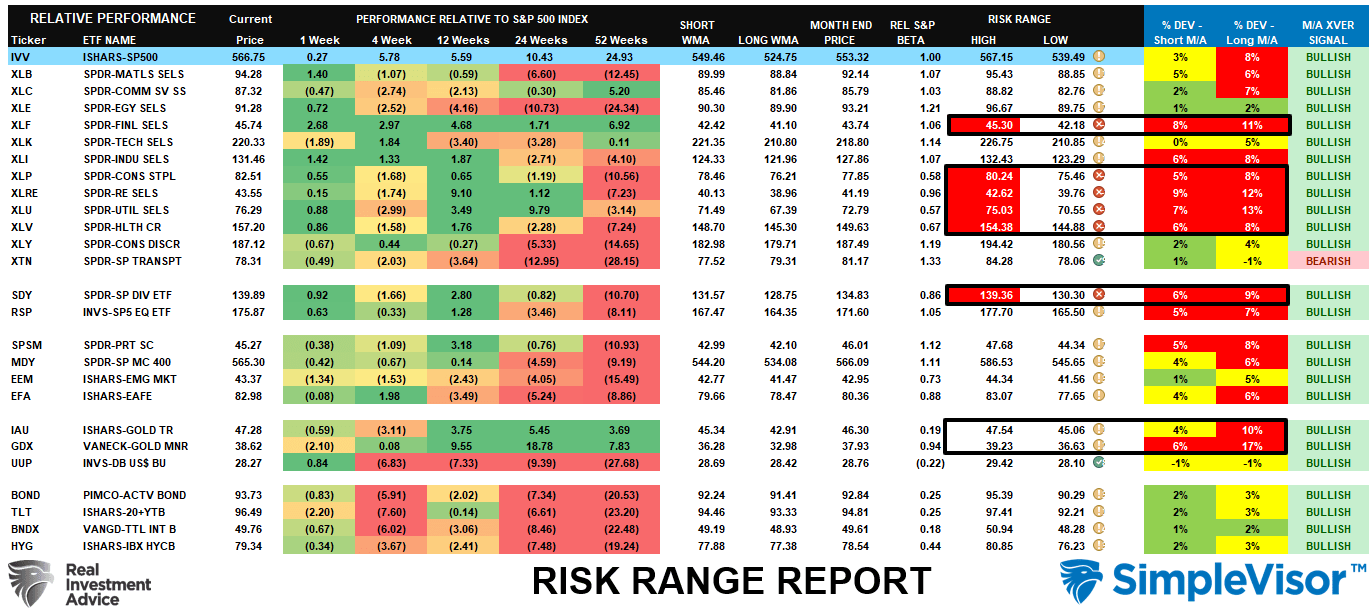
Relative Performance Analysis
Last week, we discussed the bottom-left panel of the analysis.
“As noted, with every market and sector at more extreme levels of overbought conditions, look for minor corrections to support before adding exposure to portfolios. I would be unsurprised to see some selling hit the markets next week.”
While we did see some minor intraday selling pressure this past week, it was not enough to reverse the more overbought conditions. Expect a short-term pullback or further consolidation to work off those overbought conditions before adding equity exposure.
Technical Composite
The technical overbought/sold gauge comprises several price indicators (R.S.I., Williams %R, etc.), measured using “weekly” closing price data. Readings above “80” are considered overbought, and below “20” are oversold. The market peaks when those readings are 80 or above, suggesting prudent profit-taking and risk management. The best buying opportunities exist when those readings are 20 or below.
The current reading is 85.73 out of a possible 100.

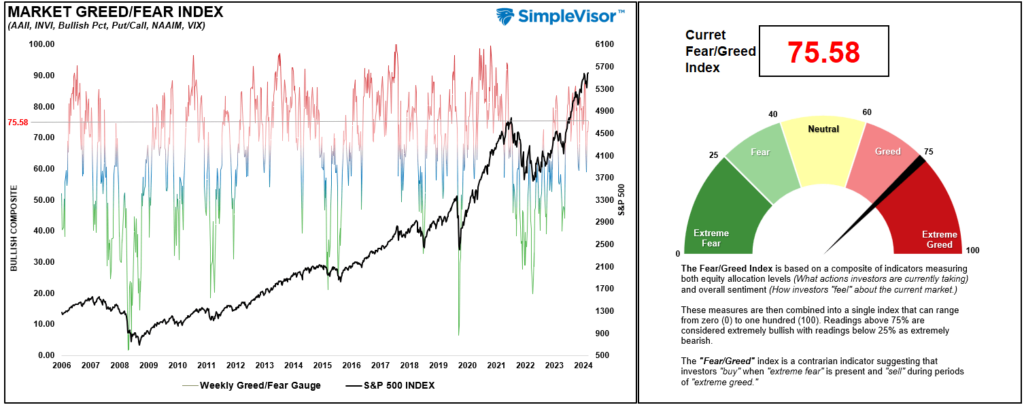
Portfolio Positioning “Fear / Greed” Gauge
The “Fear/Greed” gauge is how individual and professional investors are “positioning” themselves in the market based on their equity exposure. From a contrarian position, the higher the allocation to equities, the more likely the market is closer to a correction than not. The gauge uses weekly closing data.
NOTE: The Fear/Greed Index measures risk from 0 to 100. It is a rarity that it reaches levels above 90. The current reading is 75.58 out of a possible 100.
Relative Sector Analysis
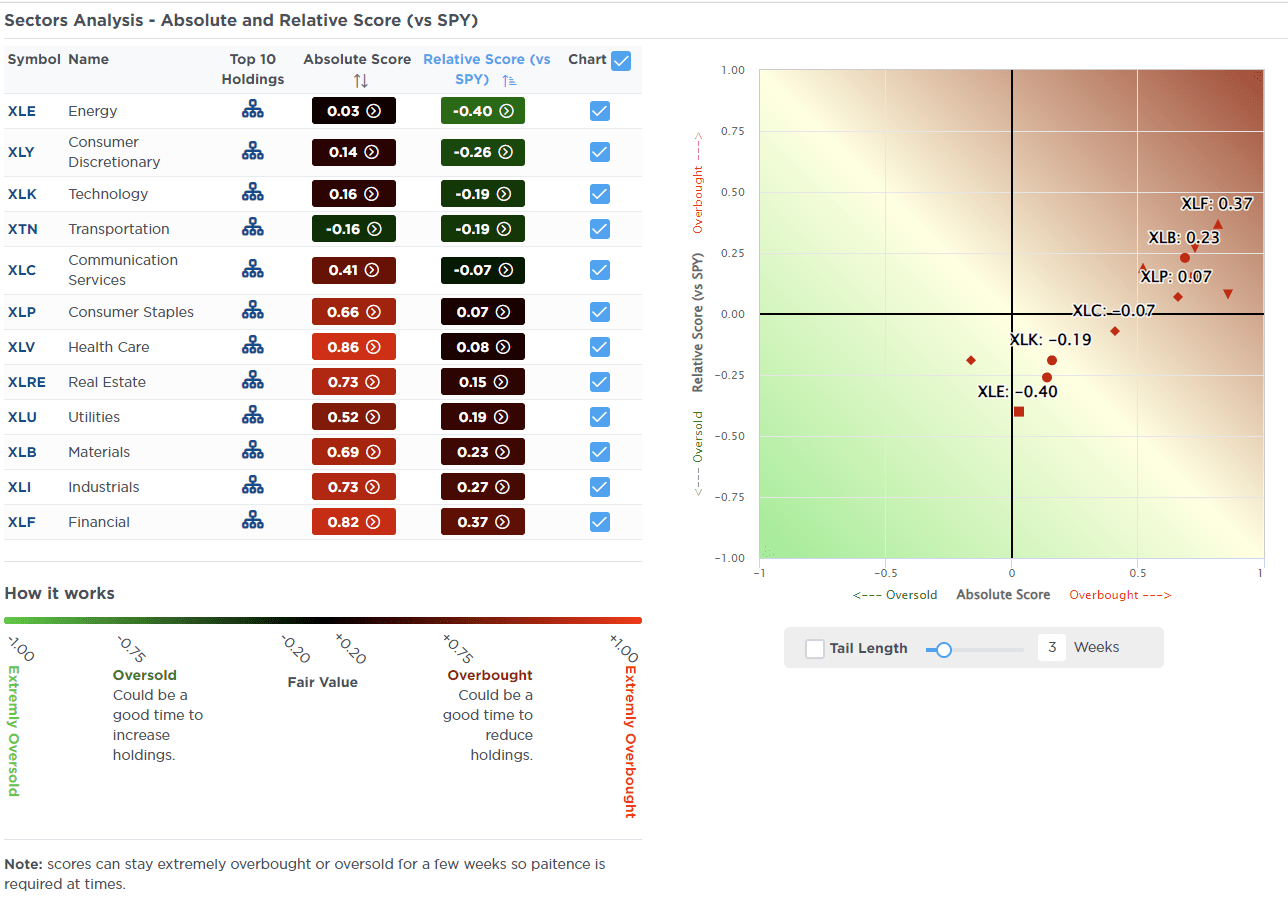
Most Oversold Sector Analysis
Sector Model Analysis & Risk Ranges
How To Read This Table
- The table compares the relative performance of each sector and market to the S&P 500 index.
- “MA XVER” (Moving Average Crossover) is determined by the short-term weekly moving average crossing positively or negatively with the long-term weekly moving average.
- The risk range is a function of the month-end closing price and the “beta” of the sector or market. (Ranges reset on the 1st of each month)
- The table shows the price deviation above and below the weekly moving averages.
Last week, we noted that the more defensive sectors of the market, from Staples to Real Estate and Bonds, were very bought. While bonds did correct this past week, the rest of the market did not. Also, we highlighted that Gold and Gold Miners highly deviated from their long-term means. Continue to take profits and rebalance weightings, as a reversal is likely at some point.
Weekly SimpleVisor Stock Screens
We provide three stock screens each week from SimpleVisor.
This week, we are searching for the Top 20:
- Relative Strength Stocks
- Momentum Stocks
- Fundamental & Technical Strength W/ Dividends
(Click Images To Enlarge)
RSI Screen
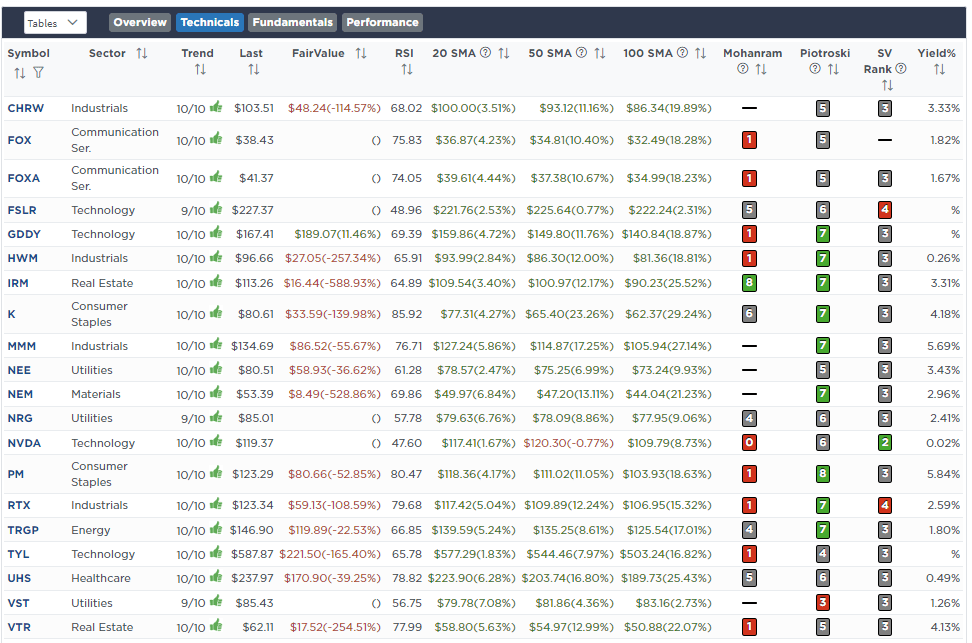
Momentum Screen

Fundamental & Technical Screen

SimpleVisor Portfolio Changes
We post all of our portfolio changes as they occur at SimpleVisor:
Aug 27th
“Nvidia (NVDA) will report second-quarter results for fiscal 2025 after the bell tonight. Investors will likely watch for sustained data center growth and any updates on reported delays affecting the new Blackwell artificial intelligence (AI) chip.
We previously reduced our exposure to Nvidia in mid-July before the sell-off in August. Given the rally from the lows in August and the potential risks of disappointment in the earnings report, we are reducing holdings in both models slightly to reduce our risk further. If earnings are fine and the outlook is strong, we will look for an entry point to once again increase our exposure as needed.
Equity Model
- Reduce NVDA to 2% of the portfolio.
Dividend Growth Model
- Reduce NVDA to 4% of the portfolio.
Aug 30th
This morning, we are adding a starting position in Mortgage REIT exposure to all models in anticipation of the Fed’s coming rate cuts. Those rate cuts should lead to an eventual pickup in mortgage prepayment speeds, which benefit Mortgage REITs.
In the Equity Model, we are starting the position at 1% of Annaly Capital Management (NLY), and in the sector, we added 1% to the iShares Mortgage Real Estate ETF (REM.) In the Dividend Growth Model we are adding 2% of NLY to replace the previous sale of Phillip Morris (PM).
Equity Model
- Buy 1% of the portfolio in NLY.
ETF Model
- Add 1% of the iShares Mortgage Real Estate ETF (REM).
Dividend Growth Model
- Buy 2% of the portfolio in Annaly Capital Management (NLY)

Lance Roberts, C.I.O.
Have a great week!

