
The two graphs below tell us the market was petrified on Monday and willing to pay exorbitant prices for hedging protection. Unlike prior downdrafts, fear wasn’t just expressed in sentiment and words but also by remarkable heading action. As we share below, the hedging activity was nearly off the charts.
The graph on the left, courtesy of ARK Invest, shows the VIX index intraday highs. The VIX measures implied volatility. Typically, the VIX is low in bull markets and tends to increase in drawdowns and bear markets as investors bid up the price of options for hedging. The VIX eclipsed 40 on Monday. Investors were paying dear prices for hedging options. For context, Monday’s high was only surpassed in the last 40 years by Black Monday (1987), the financial crisis (2008/2009), and the early days of the pandemic panic.
The right graph, courtesy of @macrocharts, adds to the VIX graph. The call-put skew on the S&P 500 dropped to a level only seen twice since 2006. The call-put skew measures the difference between the implied volatility of calls and puts that are equally out of the money. The sharp decline in the gauge was due to a strong bid for puts.
The two graphs showing the sharp jump in hedging activity tell us investors are uneasy with the current climate. It is a temporary sign of market instability. It may fade quickly or precede a period of volatile conditions. Given the elections, a slowing economy, Middle East tensions, and the Fed moving to a dovish stance, such concern is warranted. However, the sharp surge in the VIX and call-put skew are more symptomatic of a short-term technical event. Therefore, it’s highly likely that Monday’s decline was about the yen carry trade, not more significant macro fears.

What To Watch Today
Earnings
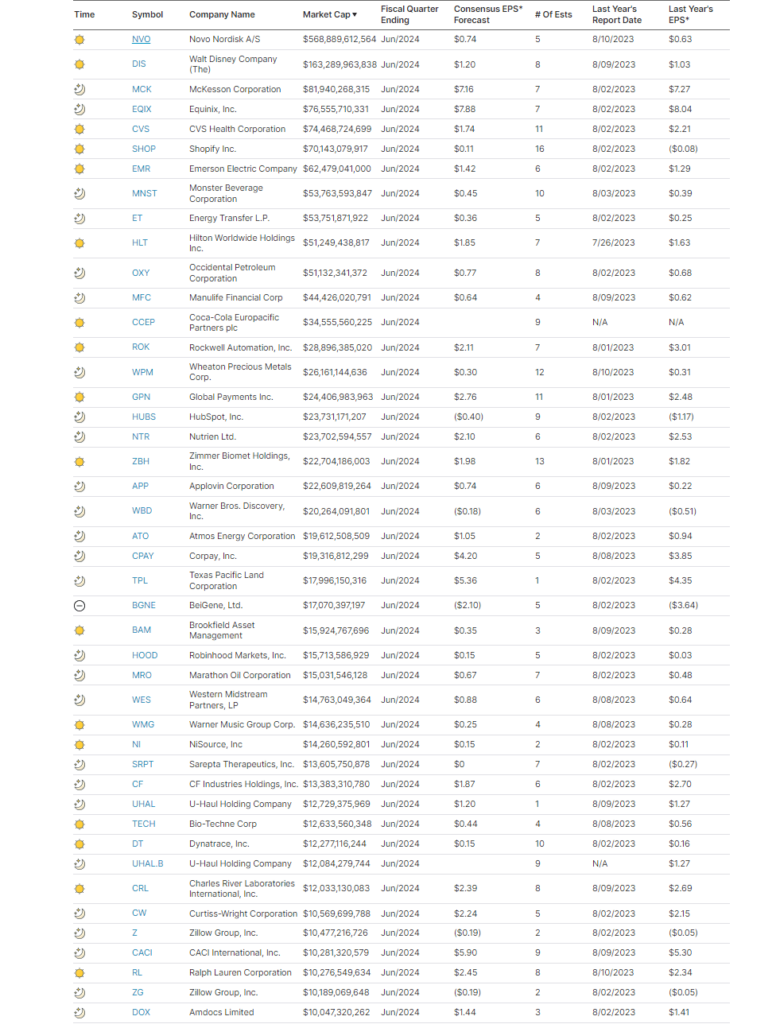
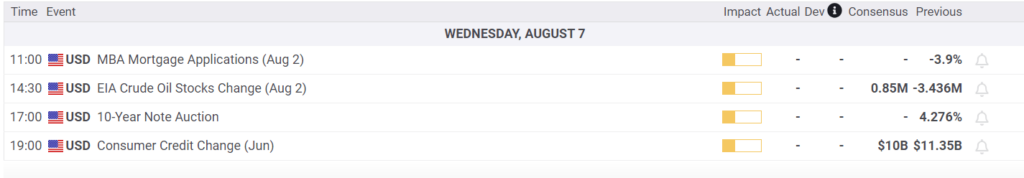
Economy
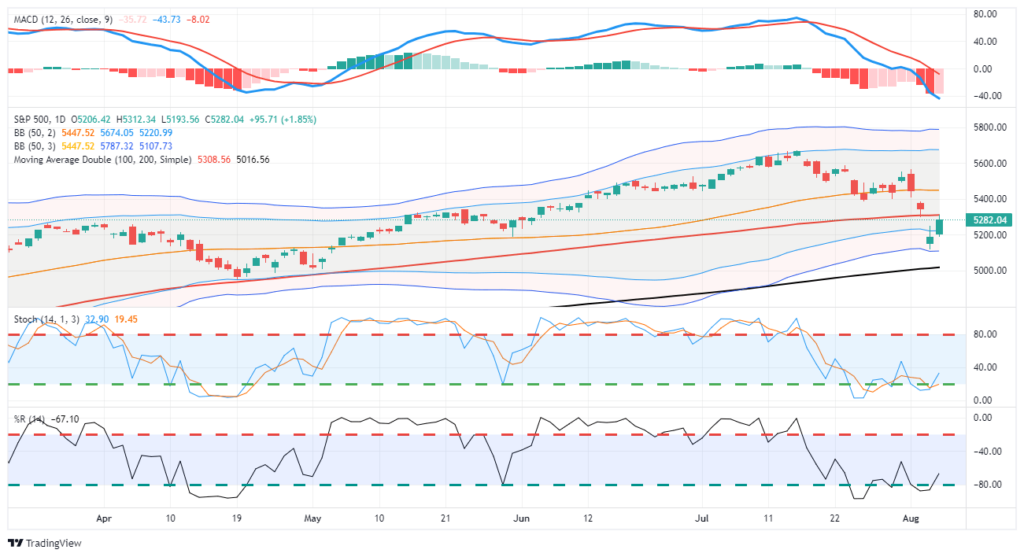
Market Trading Update
Yesterday’s commentary noted that Treasury bonds had become extremely overbought during the recent decline as money rotated from “risk” to “safety.” As we noted:
“The good news is that Treasury bonds have cleared all previous resistance levels, confirming the recent breakout. However, given the extremely overbought conditions, a retracement of the recent gains should be expected. Key support is the cluster of moving averages that coincides with the downtrend from the end of 2023.”
That rotation occurred yesterday, with bonds retracing as stocks rallied following the recent sharp selloff. The rally yesterday was a solid technical bounce, with prices improving all day. Technically, this type of price action is more encouraging and suggests some of the panic is subsiding in the market. However, the market is approaching technical resistance at the 100-DMA which could bring sellers in the market that were caught up in the recent decline. With a sell signal still in place and the markets oversold, a further rally is possible in the near term, but we suspect we will see a subsequent decline to at least retest recent lows before the next buying opportunity is present. Be patient for now, and use the current rally to reduce risk and rebalance portfolios as needed.

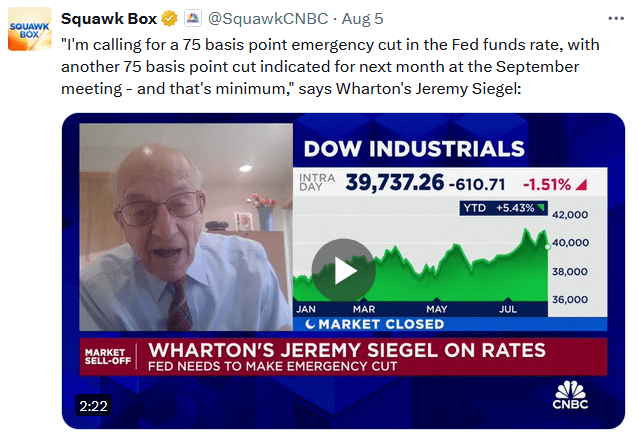
Jeremy Siegel Is Irrational
On Monday morning, famed economist and Wharton professor Jeremy Siegel called for an emergency 75bps rate cut and another 75bps cut at the September meeting. His statement is irrational and would have worsened the market problems. Let us explain.
It is pretty evident that the sharp decline was due to some yen carry traders having to liquidate their leveraged trades. It was not due to a sharp slowdown in economic activity or some other crisis requiring sharply lower interest rates. More importantly, the yen carry trade problems are resulting from a rapidly appreciating yen. The yen is largely appreciating because Japan is raising interest rates, and there is a high likelihood the Fed will cut rates in September. Had the Fed followed Siegel’s advice, the yen could have appreciated significantly more as the interest rate gap between the U.S. and Japan declined. Instead of helping the problem, Siegel begged the Fed to throw fuel on the fire!
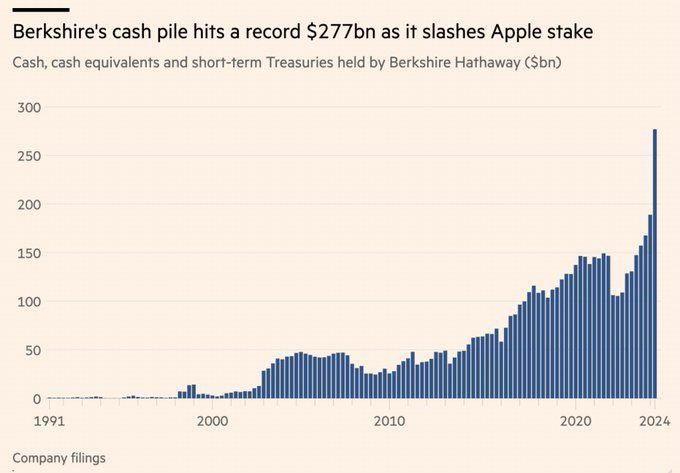
Did Warren Buffett Call A Market Top?
Last weekend, it was disclosed that Buffett’s Berkshire Hathaway sold half its stake in Apple. Some in the media presume he sold a hefty chunk of Apple because he fears a steep market decline. Berkshire now holds $277 billion in cash, which is a record high. However, the amount of cash as a ratio of its market cap is slightly above the long-term average of 25%. Simply, cash is growing with the value of the portfolio.
Buffett likes to hold high cash balances and will use them when he deems there is better value. We do not know what Buffett is thinking, nor does the media. However, a big difference exists between not liking current valuations and presuming the market will fall significantly. In May, Buffett said, “We only swing at pitches we like… today things aren’t attractive.” With his stockpile of cash earning 5.50%, Buffett is comfortable waiting on a fat pitch.
Tweet of the Day

“Want to achieve better long-term success in managing your portfolio? Here are our 15-trading rules for managing market risks.”
Please subscribe to the daily commentary to receive these updates every morning before the opening bell.
If you found this blog useful, please send it to someone else, share it on social media, or contact us to set up a meeting.

