
Do Investors Know They are Skiing in an Avalanche Zone?
2020 has been quite a year for the stock and options markets. We have witnessed a gut-wrenching roller coaster ride from highs to lows and back to highs. The volumes of both stock and options trading have ballooned as discount brokers offer zero commission trading.
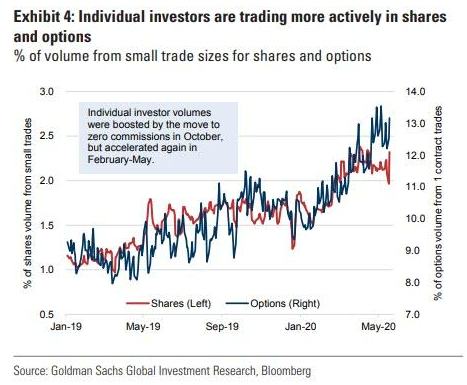
What few seem to realize is that the proliferation of options trading has created a new market dynamic. This dynamic can create feedback loops that could generate significant volatility. If we compare a feedback loop to a snowball rolling downhill, one can view the recent spike in options trading as a snowfall leading to a potential avalanche.
To make our case, we provide a simplified option hedging example to show how this practice can affect order flow in the underlying markets. Specifically, options delta hedging can lead to amplified upward and downward price pressure. With options trading at record volumes, one should not overlook this point.
Options Hedging Example
To illustrate the effects of delta hedging, let’s consider an example. A bank or broker that writes options will usually construct and manage a delta neutral portfolio to manage this risk[1]. For this example, we consider a delta hedger in SPY that ended a recent trading day with a delta-neutral hedged position. We show this in the first table below.
The closing price of SPY is $321/share. The market participant sold 100 call options at the $340/share strike price, with options expiration 28 days away. To hedge this position close to delta-neutral, the participant sold 57 puts at a strike price of $300/share. There are many ways to hedge the position, and the method we present is common among market makers.
To arrive at 57 puts, the participant calculated how many options are needed to bring the total delta of the position to near zero. As shown below, the call and put delta in the two right columns are essentially equal. However, that will cease to be the case once SPY moves in one direction or the other.
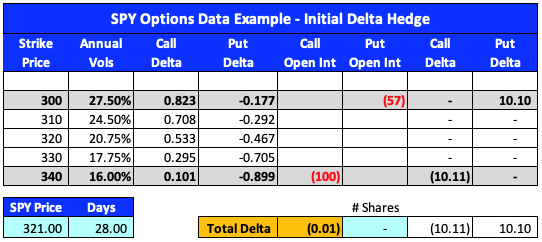
[1] Delta measures how the option price will change as the underlying stock or index changes.

The Next Day
The next day, we assume the value of SPY increases by $4/share to $325/share. The price changes also change the delta values for both the puts and calls. This participant wants to maintain a delta neutral position. To do so, they can buy 8-shares of SPY[1] to neutralize delta (we show the changes to the position in red in the tables below).

The important thing to emphasize is that maintaining a delta neutral hedge requires the participant to buy SPY shares when the price of SPY increases.
To illustrate the same case when the market declines, consider the case where SPY falls by $4/share the next day. In this example, the participant would sell 7-shares of SPY to maintain a delta-neutral portfolio.
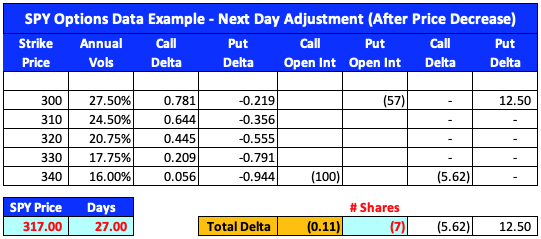
Again, the important thing to emphasize is that maintaining a delta neutral position requires the participant to sell SPY shares when the price of SPY decreases.
Therefore, one outcome of delta hedging is that options market makers will buy shares when the market is rising and sell shares when it is falling.
When liquidity is weak and hedging requirements are large, a feedback loop can materialize and amplify price moves. Such occurs when hedge related buying pushes prices higher. As prices rise, hedgers must buy more, which then pushes prices even higher. The same loop can occur on the downside as well.
[1] Since 1-option in the stock markets is for 100 shares, the delta neutral position would require 800 shares of SPY. We are simplifying the calculations for reader understanding.

Risk of Cascading Declines
In the simple example above, we did not consider changes in volatility to adjust our delta hedge. In reality, implied volatilities change rapidly, particularly in a sharply declining market.
When volatility spikes, then the values, deltas, and gammas of options also spike.
Volatility is most likely to rise in falling markets and remain stable to falling in rising markets. The amount of hedging required to hedge downward moves is typically greater than upward moves.
A sharply falling market can result in a cascading feedback loop. Such occurs as delta hedgers must sell increasing numbers of shares to maintain their delta-neutral hedge. Importantly, most of this delta hedging is done by computers, which can further amplify the move as all of the delta hedgers can act simultaneously.
Stock market selling can beget more selling, and in some cases, this can result in a market that looks like a snowball heading downhill.

Gamma Triggers
In studying the options markets, one of our primary goals is to protect your retirement savings from these cascading downward events that can debilitate long term wealth.
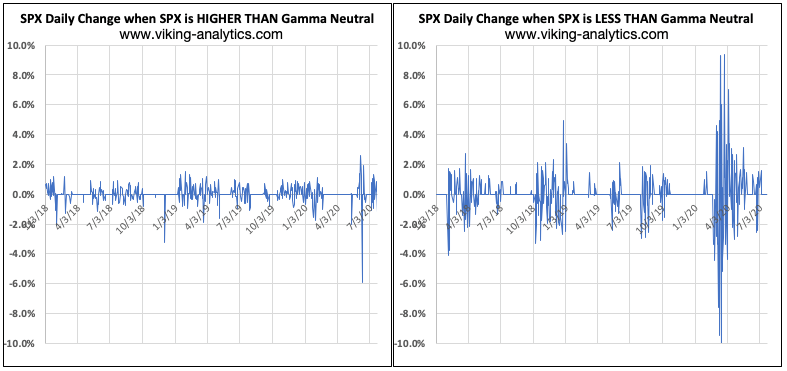
To better assess the situation we calculate and share with our subscribers the so-called Gamma Neutral level. This level can be a trigger for follow-on selling and higher volatility in the stock market. As such, it allows us to better understand how options traders are positioned and discover market levels that could trigger a feedback loop.
The chart below shows the historical volatility of the SPX above and below Gamma Neutral levels.
Conclusion
We have provided a simple delta hedging example to emphasize that delta hedging has significant follow-on effects in the stock market. In times of questionable liquidity and record options trading, these implications become magnified. In particular, delta hedging can result in a feedback loop where stock market increases are bought, and systematic delta hedgers sell stock market decreases.
As options trading gains popularity via low or zero-commission trading, the effects of this feedback loop are gaining in importance.
The feedback loop in a market sell-off is proven to be more pronounced as volatility, delta, and gamma all spike. Such results in even larger follow-on selling by machine delta hedgers. The greatest risk of the increase in options trading is the potential for a large, cascading downward move, similar to what we saw earlier this year.
If you would like to learn more, please visit our website, or download a complimentary report.
Author
Erik Lytikainen, the founder of Viking Analytics, has over 25+ of experience as a financial analyst, entrepreneur, business developer, and commodity trader. Erik holds an MBA from the University of Maryland and a BS in Mechanical Engineering from Virginia Tech.


