J. Brett Freeze and his firm Global Technical Analysis (GTA) provides RIA Pro subscribers Cartography Corner on a monthly basis. Brett’s analysis offers readers a truly unique brand of technical insight and risk framework. We personally rely on Brett’s research to help better gauge market trends, their durability, and support and resistance price levels.
GTA presents their monthly analysis on a wide range of asset classes, indices, and securities. At times the analysis may agree with RIA Pro technical opinions, and other times it will run contrary to our thoughts. Our goal is not to push a single view or opinion, but provide research to help you better understand the markets. Please contact us with any questions or comments. If you are interested in learning more about GTA’s services, please connect with them through the links provided in the article.
The link below penned by GTA provides a user’s guide and a sample of his analysis.
July 2022 Review
E-Mini S&P 500 Futures
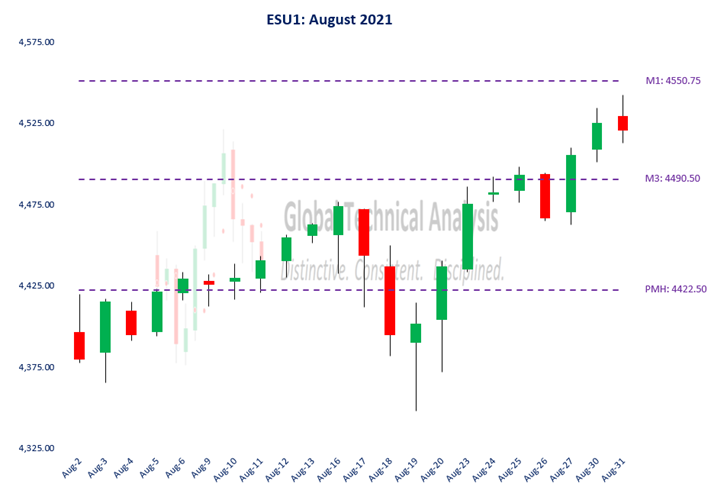
We begin with a review of E-Mini S&P 500 Futures (ESU2) in July 2022. In our July 2022 edition of The Cartography Corner, we wrote the following:
In isolation, monthly support and resistance levels for July are:
o M4 4574.50
o PMH 4191.00
o M1 4079.00
o MTrend 4077.72
o Close 3789.50
o PML 3639.00
o M2 3470.50
o M3 3444.50
o M5 2975.00
Active traders can sell against clustered resistance at MTrend: 4077.72 / M1: 4079.00 with a stop on a close above PMH: 4191.00. Active traders can buy against clustered support at M2: 3470.50 / M3: 3444.50 with a stop on a close below M3: 3444.50. Significant gaps exist above (below) the respective stop(s).
Figure 1 below displays the daily price action for July 2022 in a candlestick chart, with support and resistance levels isolated by our methodology represented as dashed lines. Given the distance of our isolated levels from June’s settlement, coupled with market sentiment at that moment, our work suggested a low probability of assuming directional risk during July.
Our clustered resistance levels at MTrend: 4077.72 / M1: 4079.00 were not breached on a closing basis until the last trading session.
Active traders following our analysis did nothing.
Figure 1:
UST 30Y Yield
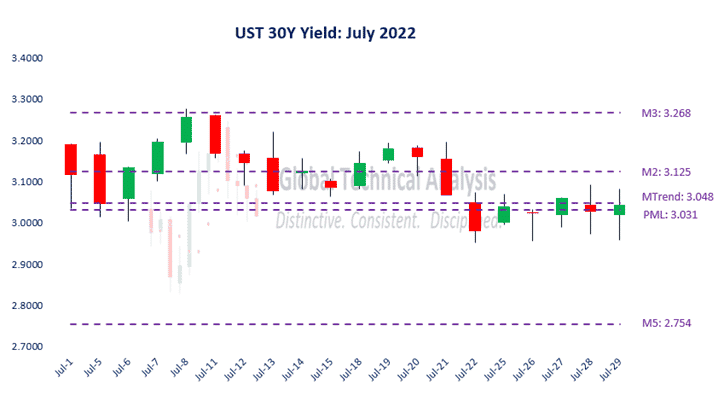
We continue with a review of the U.S. Treasury 30-Year Yield (“30Y”) during July 2022. In our July 2022 edition of The Cartography Corner, we wrote the following:
In isolation, monthly support and resistance levels for July are:
o M4 4.049
o M1 3.678
o PMH 3.493
o M3 3.268
o Close 3.164
o M2 3.125
o MTrend 3.048
o PML 3.031
o M5 2.754
Active traders can use PML: 3.031 as the initial pivot, maintaining a short position (yield perspective) below that level and a flat or long position above it.
Figure 2 below displays the daily price action for July 2022 in a candlestick chart, with support and resistance levels isolated by our methodology represented as dashed lines. The first two trading sessions saw the market yield descend to our isolated pivot level yet settle above it. The following three trading session sessions saw the market yield reverse and ascend to our isolated resistance level at M3: 3.268 yet settle below it. Over the following nine trading sessions, the market yield oscillated around our isolated support level at M2: 3.125. A winding road to unchanged.
On July 22nd, the market yield settled below our isolated pivot at 3.031. The low yield for the month, 2.953%, was realized during that trading session. The final five trading sessions were spent with the market yield oscillating around our isolated pivot. We identified the correct pivot, but the follow-through was disappointing.
Active traders following our analysis, conservatively, realized a loss of 8 basis points.
Figure 2:
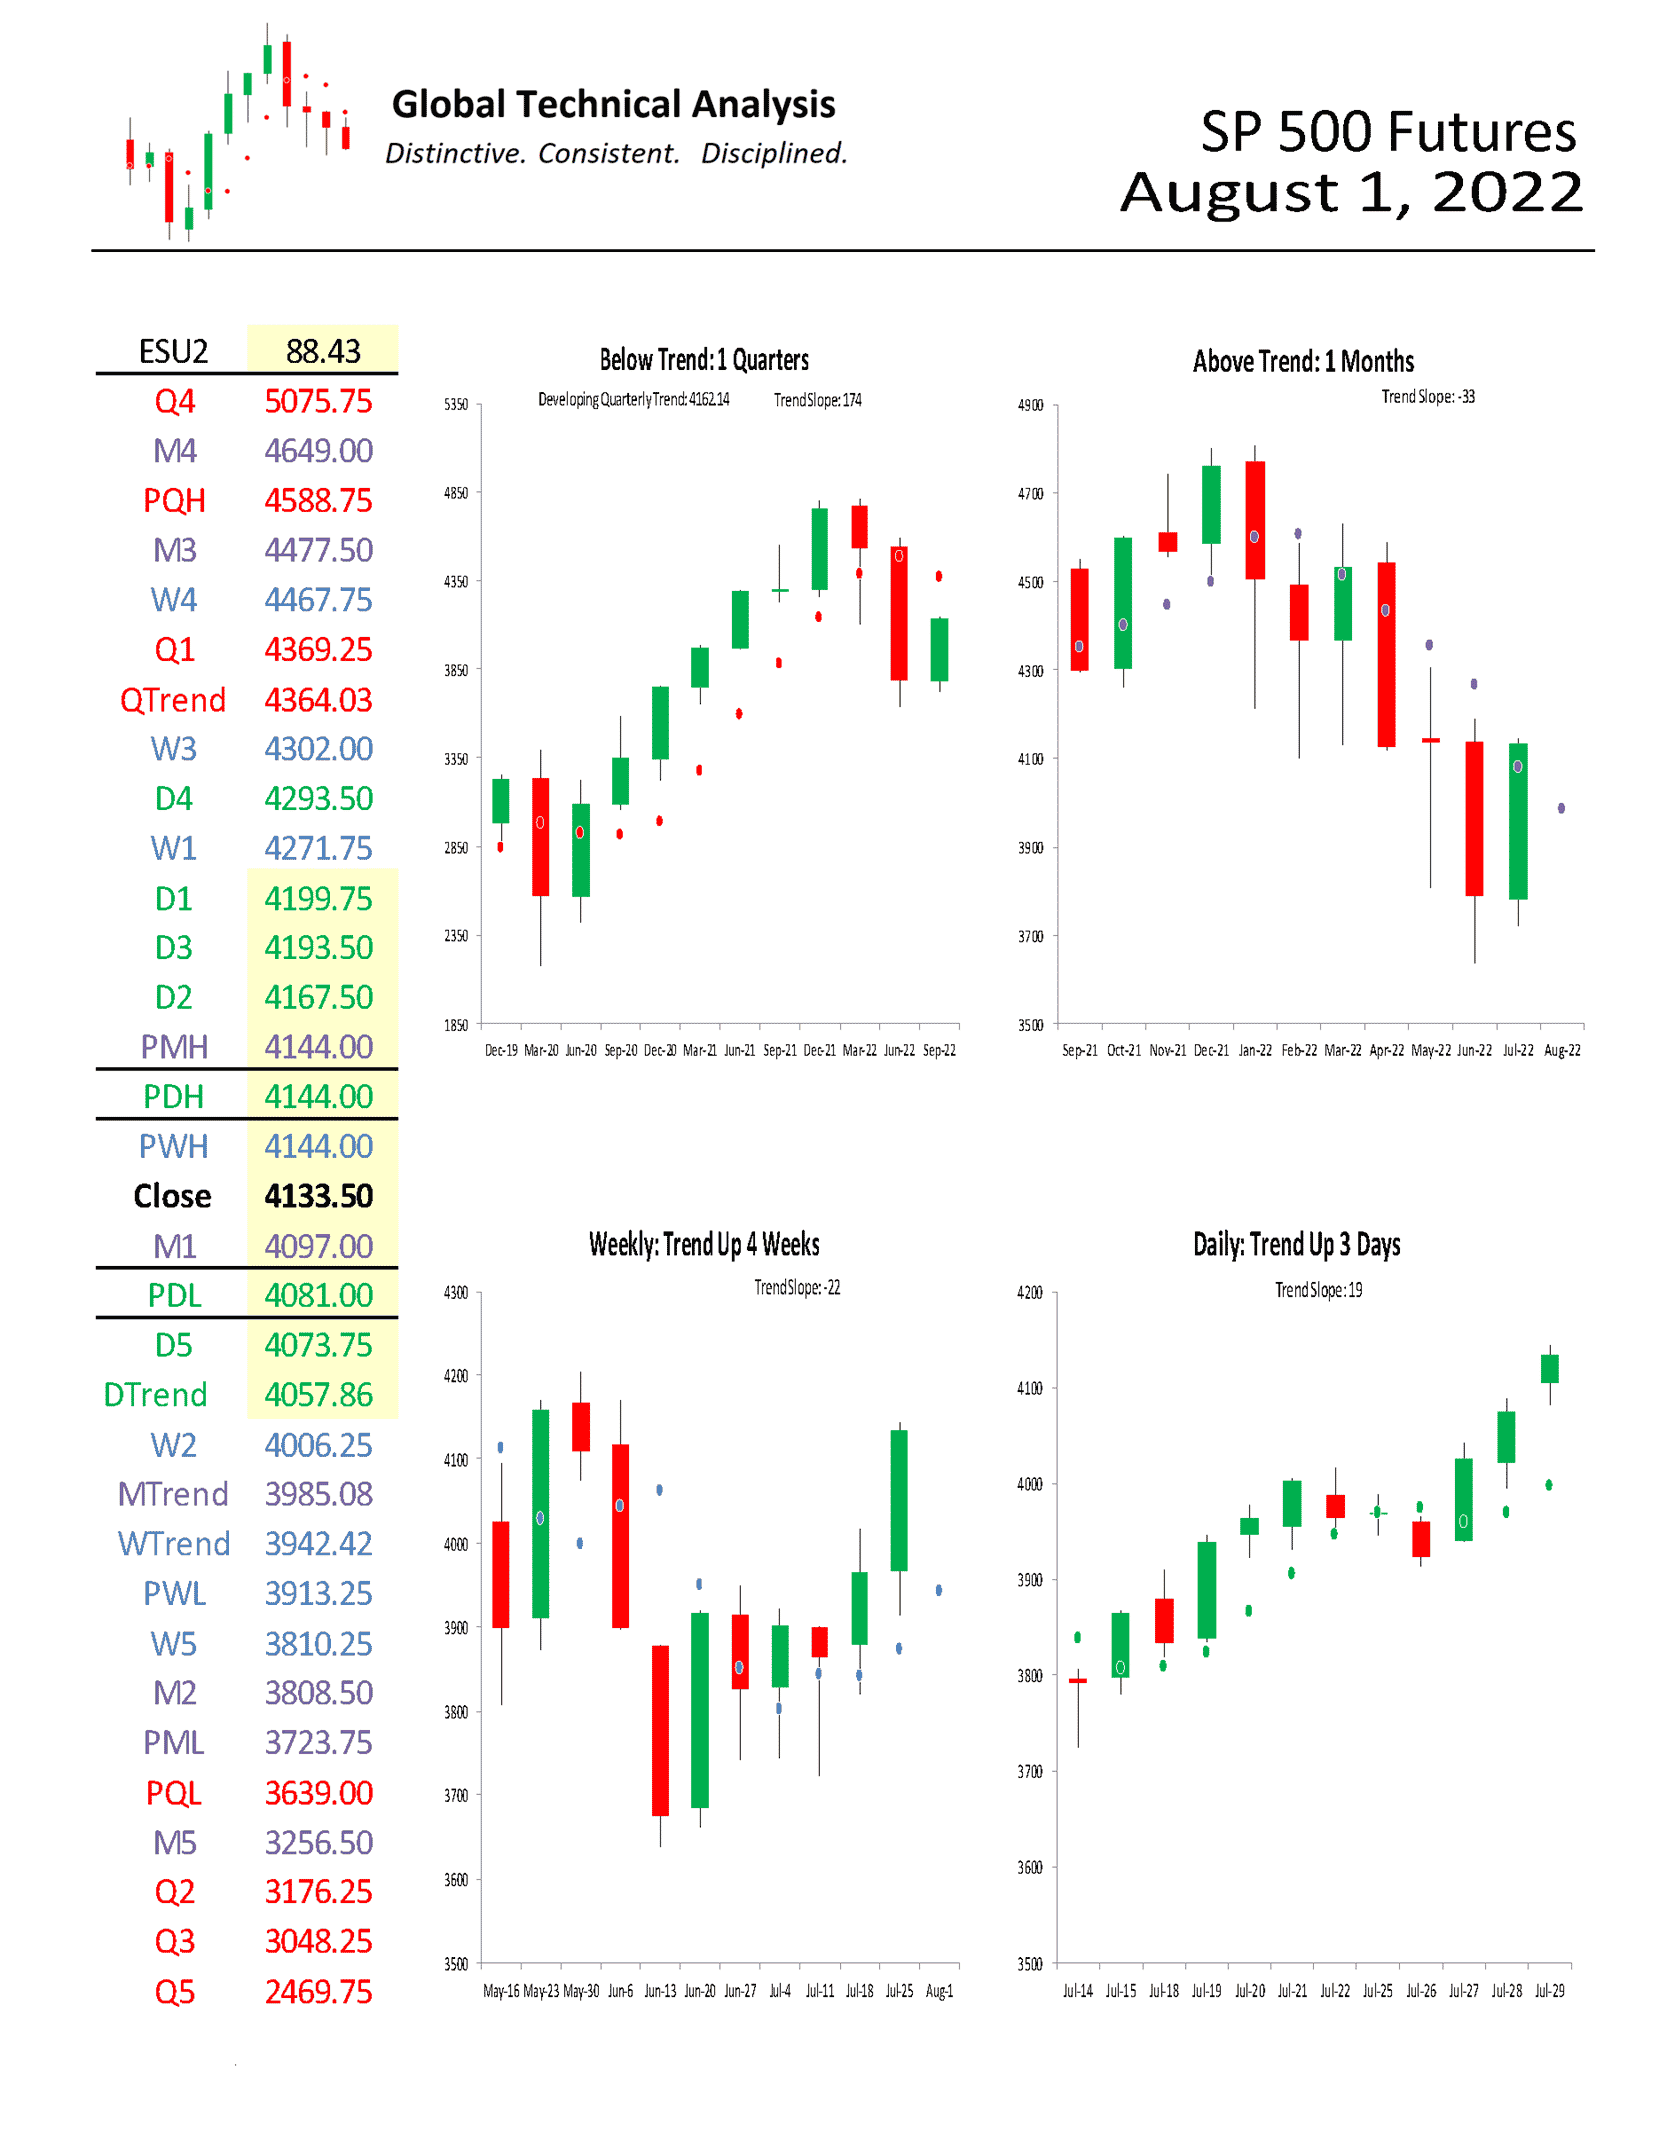
August 2022 Analysis
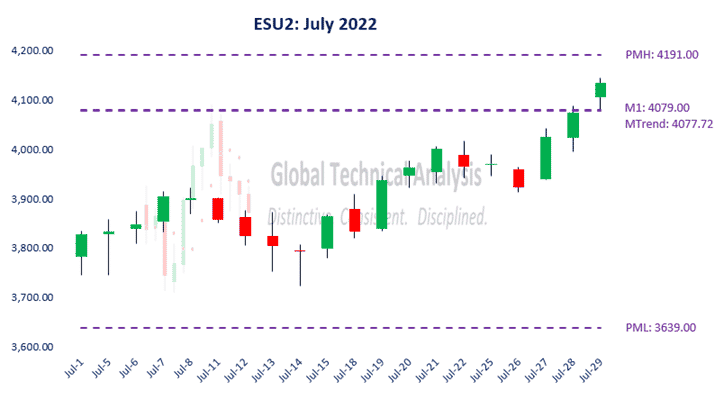
We begin by providing a monthly time-period analysis of E-Mini S&P 500 Futures (ESU2). The same analysis can be completed for any time-period or in aggregate.
Trends:
o Quarterly Trend 4364.03
o Current Settle 4133.50
o Daily Trend 4057.86
o Monthly Trend 3985.08
o Weekly Trend 3942.42
The relative positioning of the Trend Levels is transitioning to bullish. Think of the relative positioning of the Trend Levels like you would a moving-average cross. In the quarterly time-period, the chart shows that E-Mini S&P 500 Futures are “Below Trend: 1 Quarters”, after having been above Quarterly Trend for eight quarters. Stepping down one time-period, the monthly chart shows that E-Mini S&P 500 Futures are “Above Trend: 1 Months”. Stepping down to the weekly time-period, the chart shows that E-Mini S&P 500 Futures are “Trend Up: 4 Weeks”.
One rule we have is to anticipate a two-period high (low), within the following four to six periods, after a Downside (Upside) Exhaustion level has been reached. A signal was given in January to anticipate a two-month high within the next four to six months (August = 7 months). That high can be achieved in August with a trade above 4191.00.
Monthly Momentum, which measures the distance of the market price from where all the trading activity has occurred over a specific number of months, is neutral. Trend Persistence, which measures the strength of the trend across multiple periods, is neutral as well. Our clients can view those charts on our website.
Support/Resistance:
In isolation, monthly support and resistance levels for August are:
o M4 4649.00
o M3 4477.50
o PMH 4144.00
o Close 4133.50
o M1 4097.00
o MTrend 3985.08
o M2 3808.50
o PML 3723.75
o M5 3256.50
Active traders can use PMH: 4144.00 as the pivot, maintaining a long position above that level and a flat or short position below it.
High-Grade Copper
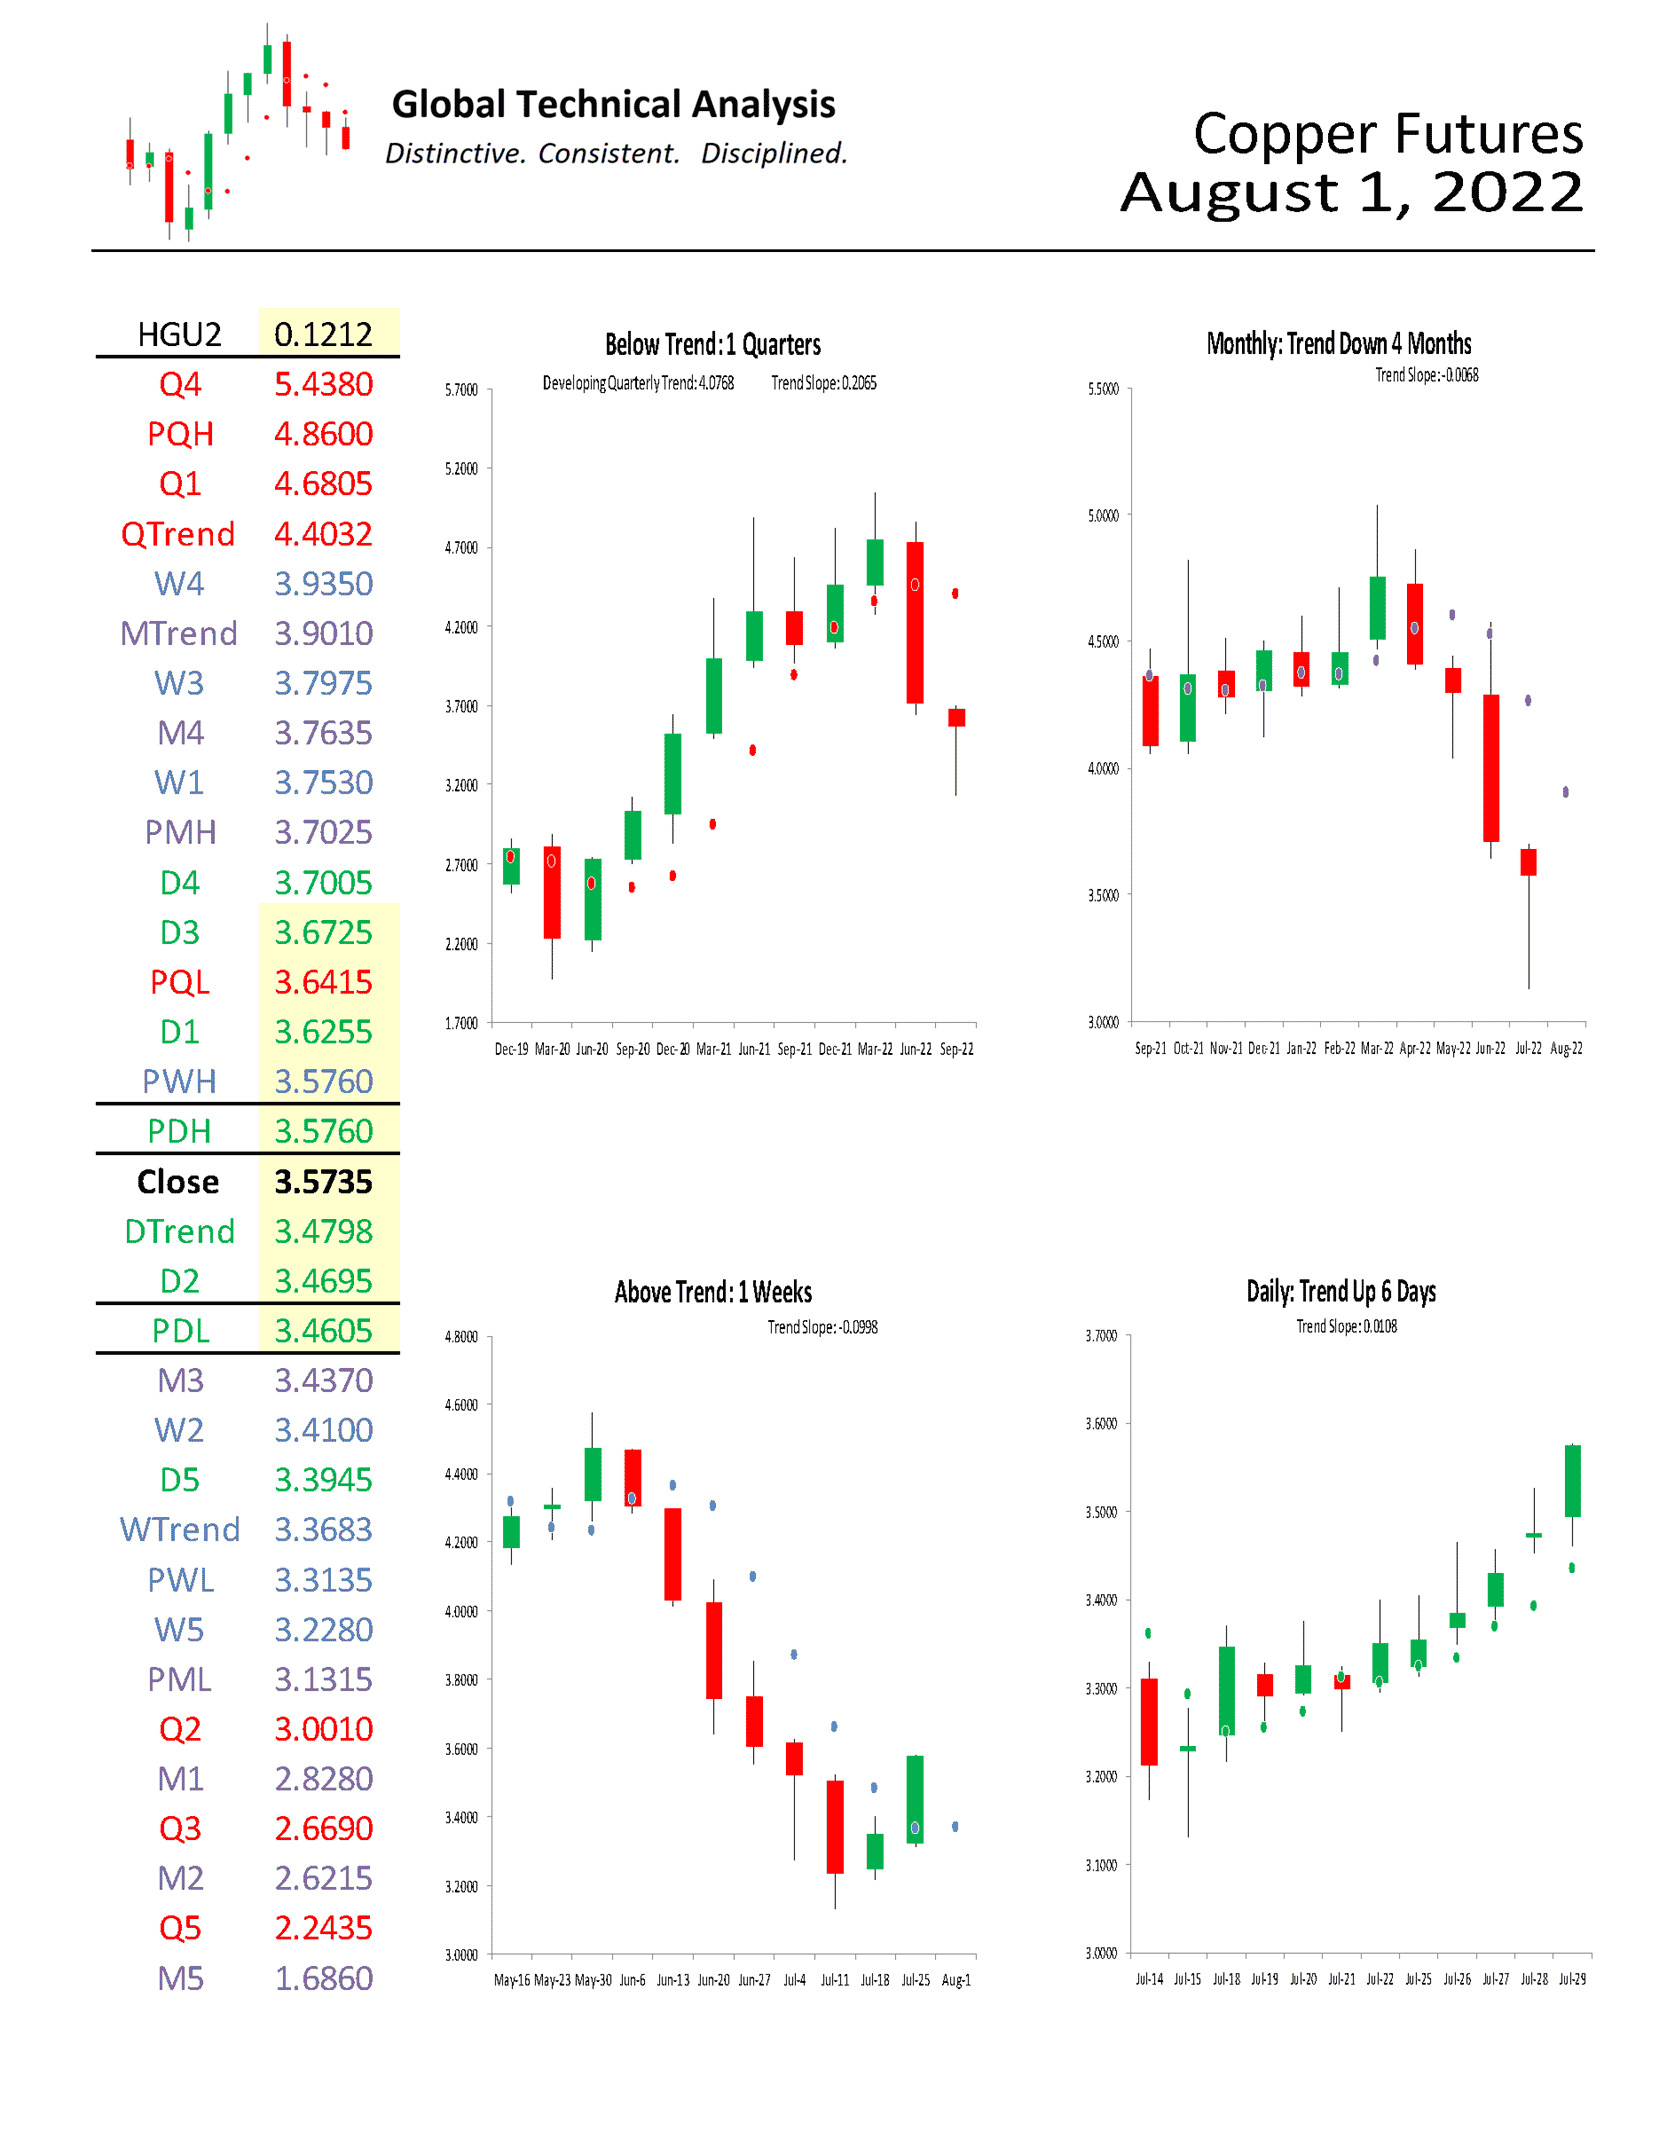
For August, we focus on High-Grade Copper Futures. We provide a monthly time-period analysis of HGU2. The same analysis can be completed for any time-period or in aggregate.
Copper prices are sensitive to cyclical industries, such as construction and industrial machinery manufacturing, as well as to political situations in countries where copper mining is government-controlled. Copper is often referred to as “Doctor Copper” as it has a decent track record of predicting turning points in the global economy. Following the price of copper is a worthwhile exercise to better understand the economic mindset of global investors.
Trends:
o Quarterly Trend 4.4032
o Monthly Trend 3.9010
o Current Settle 3.5735
o Daily Trend 3.4798
o Weekly Trend 3.3683
The relative positioning of the Trend Levels is short-term bullish but medium and long-term bearish. Think of the relative positioning of the Trend Levels like you would a moving-average cross. As can be seen in the quarterly chart below, copper is “Below Trend: 1 Quarters”, after having been “Trend Up” for eight quarters. Stepping down one time-period, the monthly chart shows that copper is “Trend Down: 4 Months”. Stepping down to the weekly time-period, the chart shows that copper is “Above Trend: 1 Weeks”, after having been “Trend Down” for seven weeks.
Monthly Momentum, which measures the distance of the market price from where all the trading activity has occurred over a specific number of months, is neutral. Trend Persistence, which measures the strength of the trend across multiple periods, is just exiting the extreme left tail of its distribution.
Support/Resistance:
In isolation, monthly support and resistance levels for August are:
o MTrend 3.9010
o M4 3.7635
o PMH 3.7025
o Close 3.5735
o M3 3.4370
o PML 3.1315
o M1 2.8280
o M2 2.6215
o M5 1.6860
Active traders can use M3: 3.4370 as the initial pivot, maintaining a long position above that level and a flat or short position below it.
Summary
The power of technical analysis is in its ability to reduce multi-dimensional markets into a filtered two-dimensional space of price and time. Our methodology applies a consistent framework that identifies key measures of trend, distinct levels of support and resistance, and identification of potential trading ranges. Our methodology can be applied to any security or index, across markets, for which we can attain a reliable price history. We look forward to bringing you our unique brand of technical analysis and insight into many different markets. If you are a professional market participant and are open to discovering more, please connect with us. We are not asking for a subscription; we are asking you to listen.

