Part One of this article described the burgeoning bull steepening yield curve environment and what it implies about economic growth and Fed policy. It also discussed the three other predominant types of yield curve shifts and what they suggest for the economy and Fed policy.
Persistent yield curve shifts tend to correlate with different stock performances. With the odds growing that a long bull steepening may be upon us, it’s incumbent upon us to quantify how various stock indices, sectors, and factors have done during similar yield curve movements.
Limiting Losses With Yield Curve Analysis
Stocks spend a lot more time trending upward than downward. However, in those relatively brief periods where longer-term bearish trends endure, investors are advised to take steps to reduce their risks and limit their losses. An active approach puts you on higher ground than you otherwise might have been. Moreover, when the market resumes its upward trend, you have ample funds to purchase stocks at lower prices and better risk-return profiles.
We discussed this topic at length in Bear Market Wealth Management. Per the article:
Growing wealth happens over decades. Within these decades are many bullish and bearish cycles. While investors tend to focus on making the most of the bullish cycles, it is equally important to avoid letting bear markets reverse your progress. The amount of time spent in bear markets is minimal, but the time lost recovering your wealth can be substantial.
You may wonder why an article about bond yield curves leads off with a discussion of bear market strategies for stocks. Simply, some yield curve shifts correlate well with positive stock market returns and others with negative returns. Prior bull steepening environments have not been friendly to buy and hold stock investors. Therefore, we hope this analysis guides you in preparing to reduce risk if needed.

The Recent Bull Steepening History
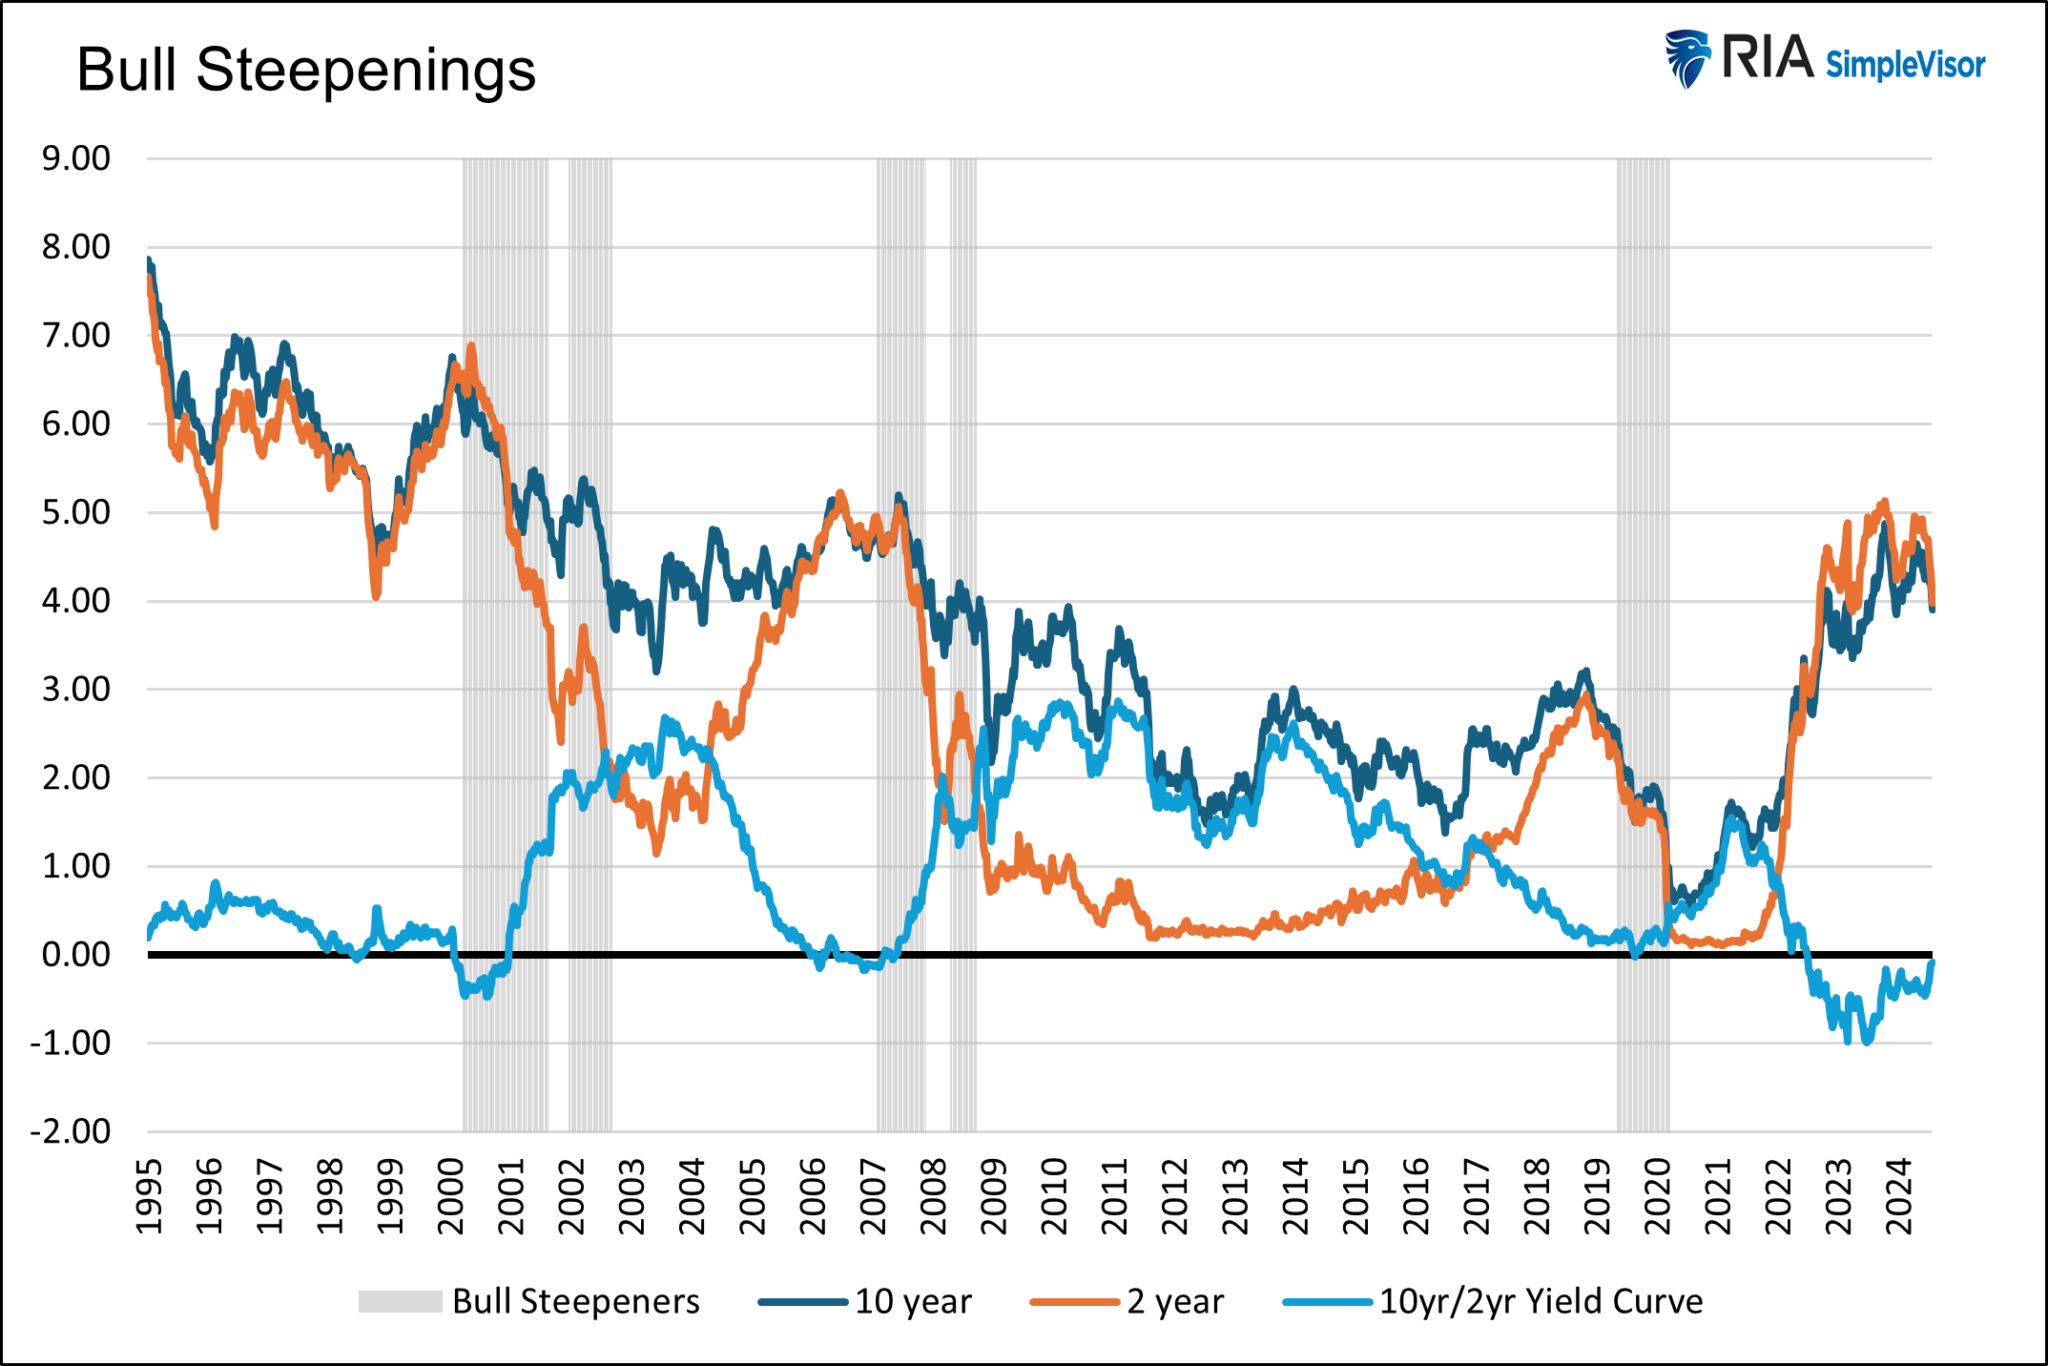
The graph below charts the 2- and 10-year yields and the 2-year/10-year yield curve. Additionally, shaded in gray are periods we deem persistent bull steepening. We defined the bull steepening periods by the curve’s movement and the trend’s consistency. To qualify, the yield curve had to be increasing, with 2-year and 10-year yields moving lower for 20 weeks or longer. Furthermore, we required at least 80% of the weeks to be in the bullish steepening trend.
As shown, there have been five such periods since 1995. The most recent stretched from May 2019 to March 2020. The current bull steepening has not been occurring long enough to meet our standards defined above.
Bull Steepening Cycles Are Bearish For Most Stocks
Having defined the periods, we then studied various stock indices, sectors, and factors to assess their performance during the timeframes. To remind you, bull steepening trades typically occur when the economy is slowing, and anticipation of Fed rate cuts grows. Those traits adequately describe the current period.
Furthermore, and of importance, the current steepening is occurring from a yield curve that has been inverted for two years. Inverted means the yield on the 10-year is less than the 2-year. An inversion reduces the incentives for banks to lend, thus further increasing the odds of economic weakness.
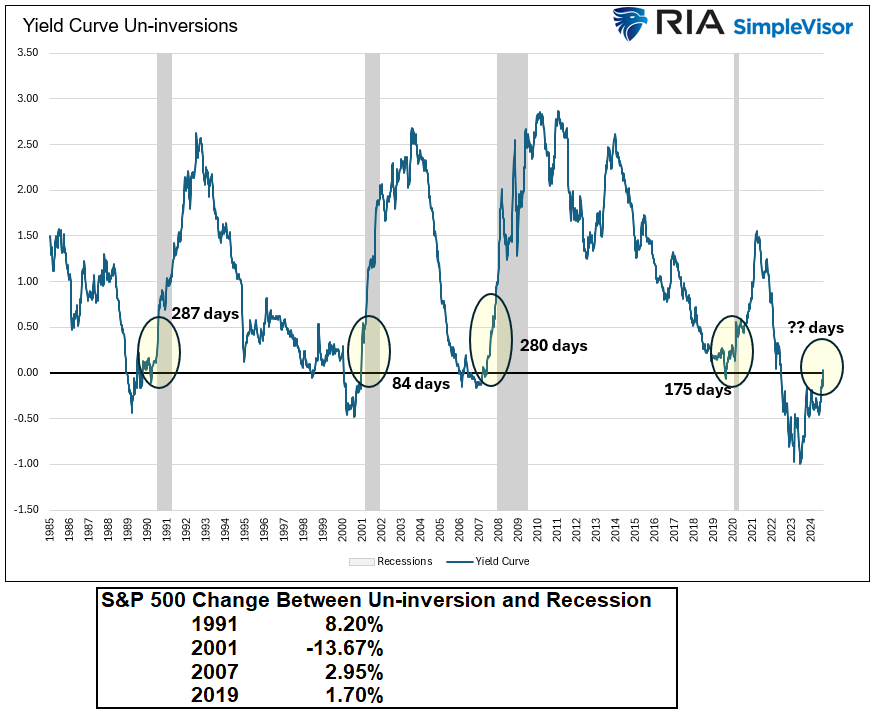
As noted in Part One, the yield curve inversion is a recession warning but is not usually timely. Contrarily, the yield curve un-inversion typically portends a recession is coming within a year or less.
The yield curve briefly returned to positive territory as we put the final edits on this article. Therefore, we now have a much more explicit recession warning.
The graph below shows that even though we have a firmer warning, a recession can take more than a year to enter.
Bond Returns
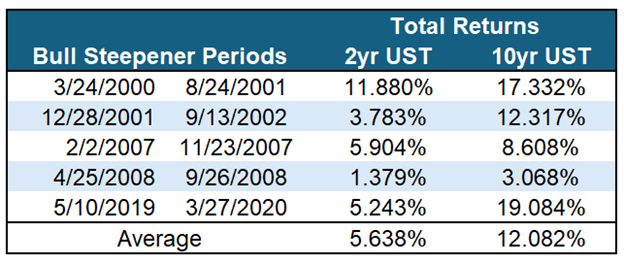
By definition, all Treasury bonds provide positive returns in a bull steepening. While two-year yields will fall more than ten-year yields, the duration on ten-year notes is much greater. Thus, from a total return perspective, longer-duration bonds often provide better returns than shorter-duration bonds.
The table below shows the total return (coupons and price) for two- and ten-year notes during the five bull steepening periods.

Stock Returns
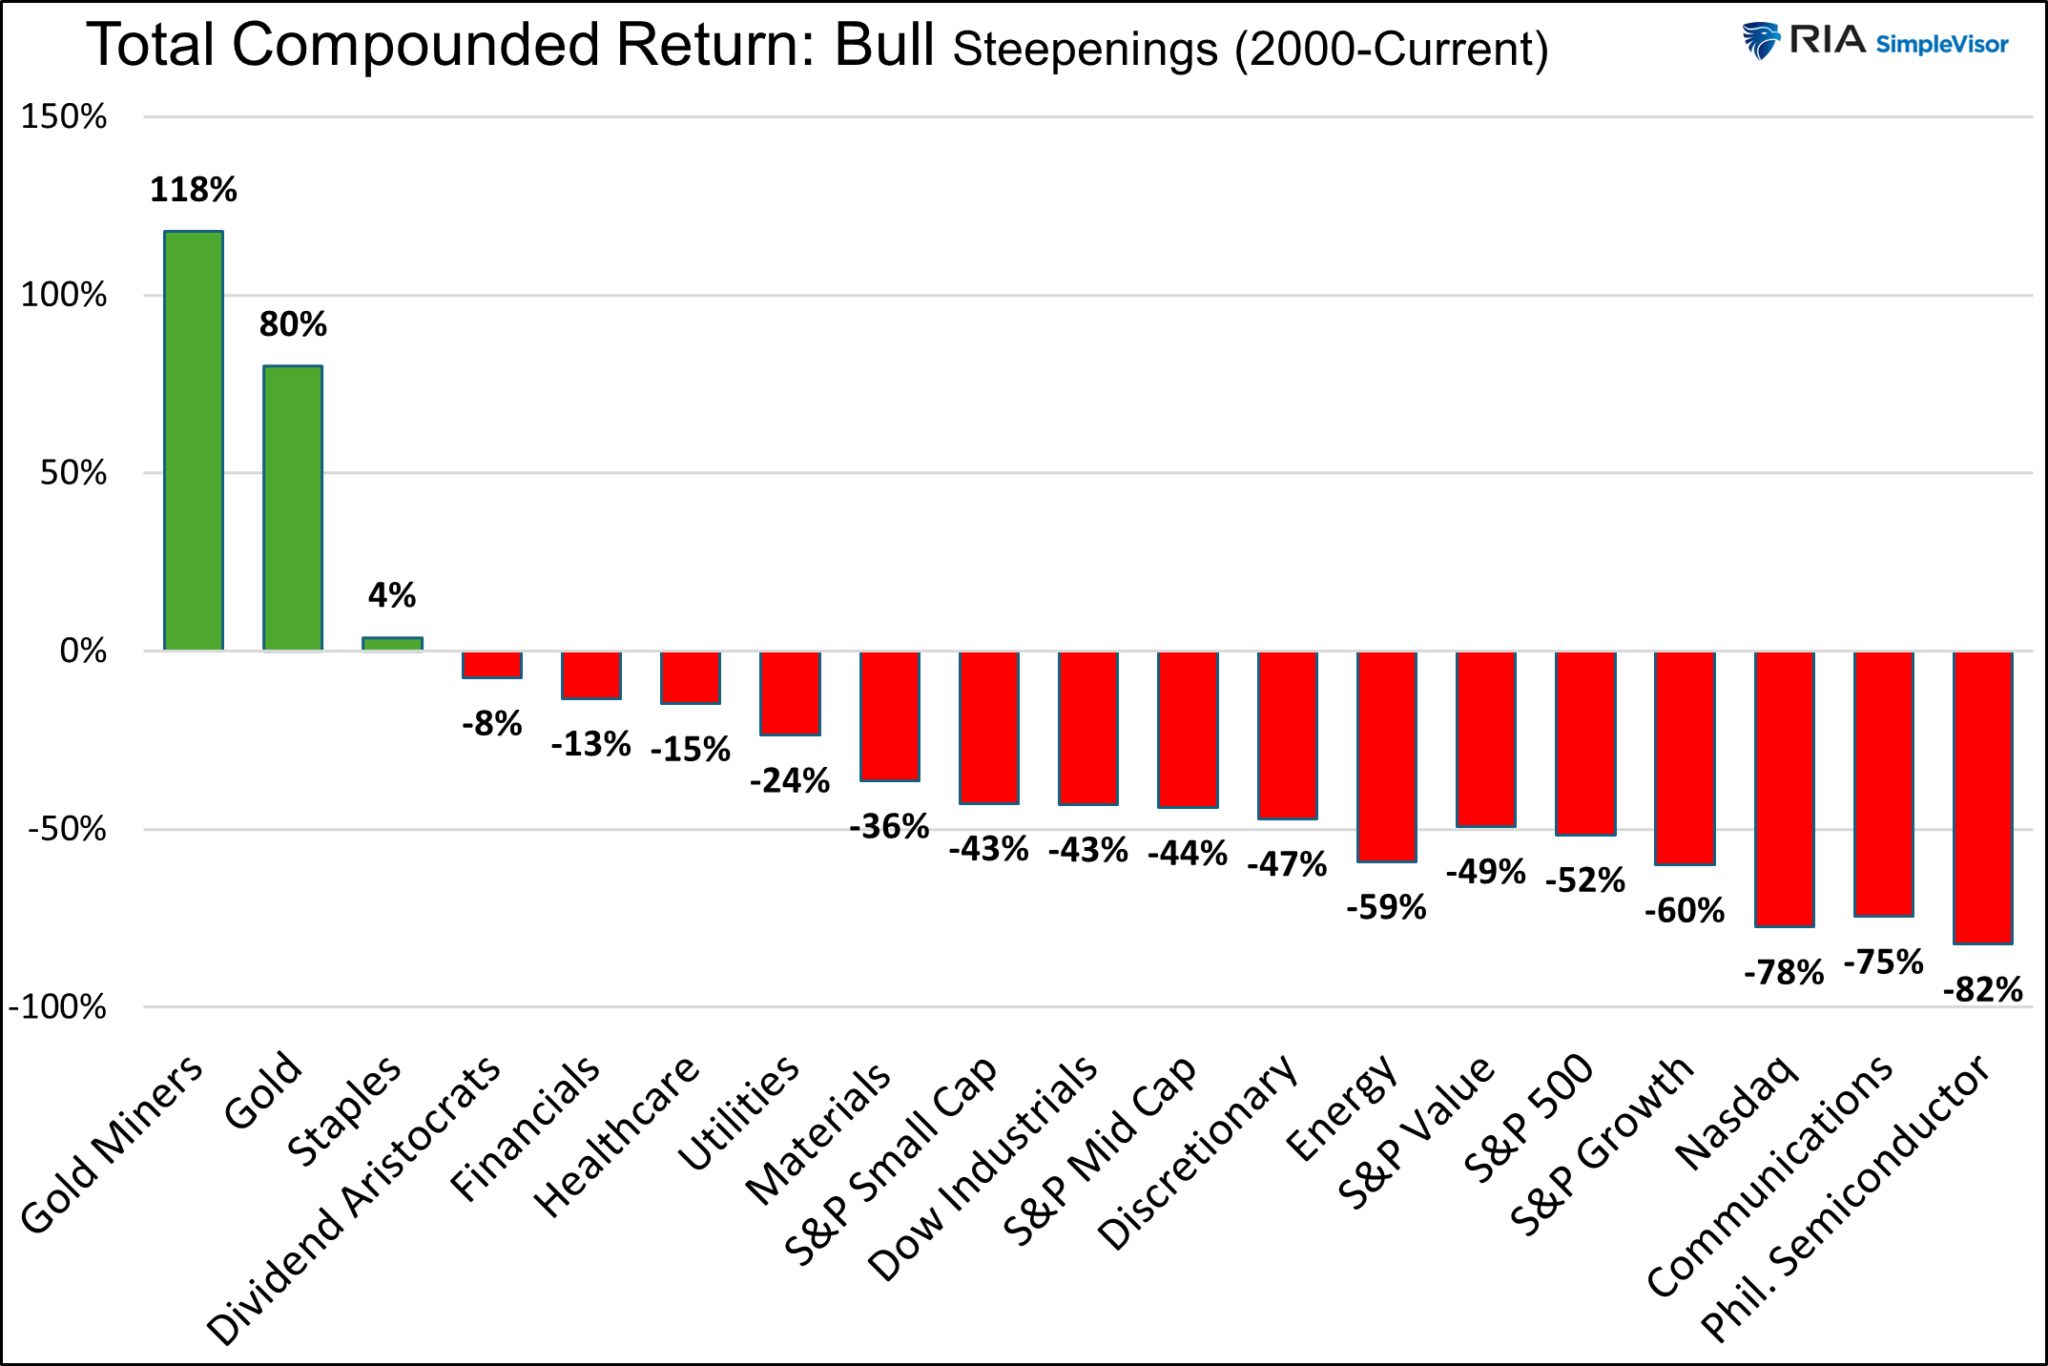
The first graph below charts the average returns of 19 assets, stock indices, factors, and sectors during the five bull steepening periods. The second graph compounds their returns over the five periods.

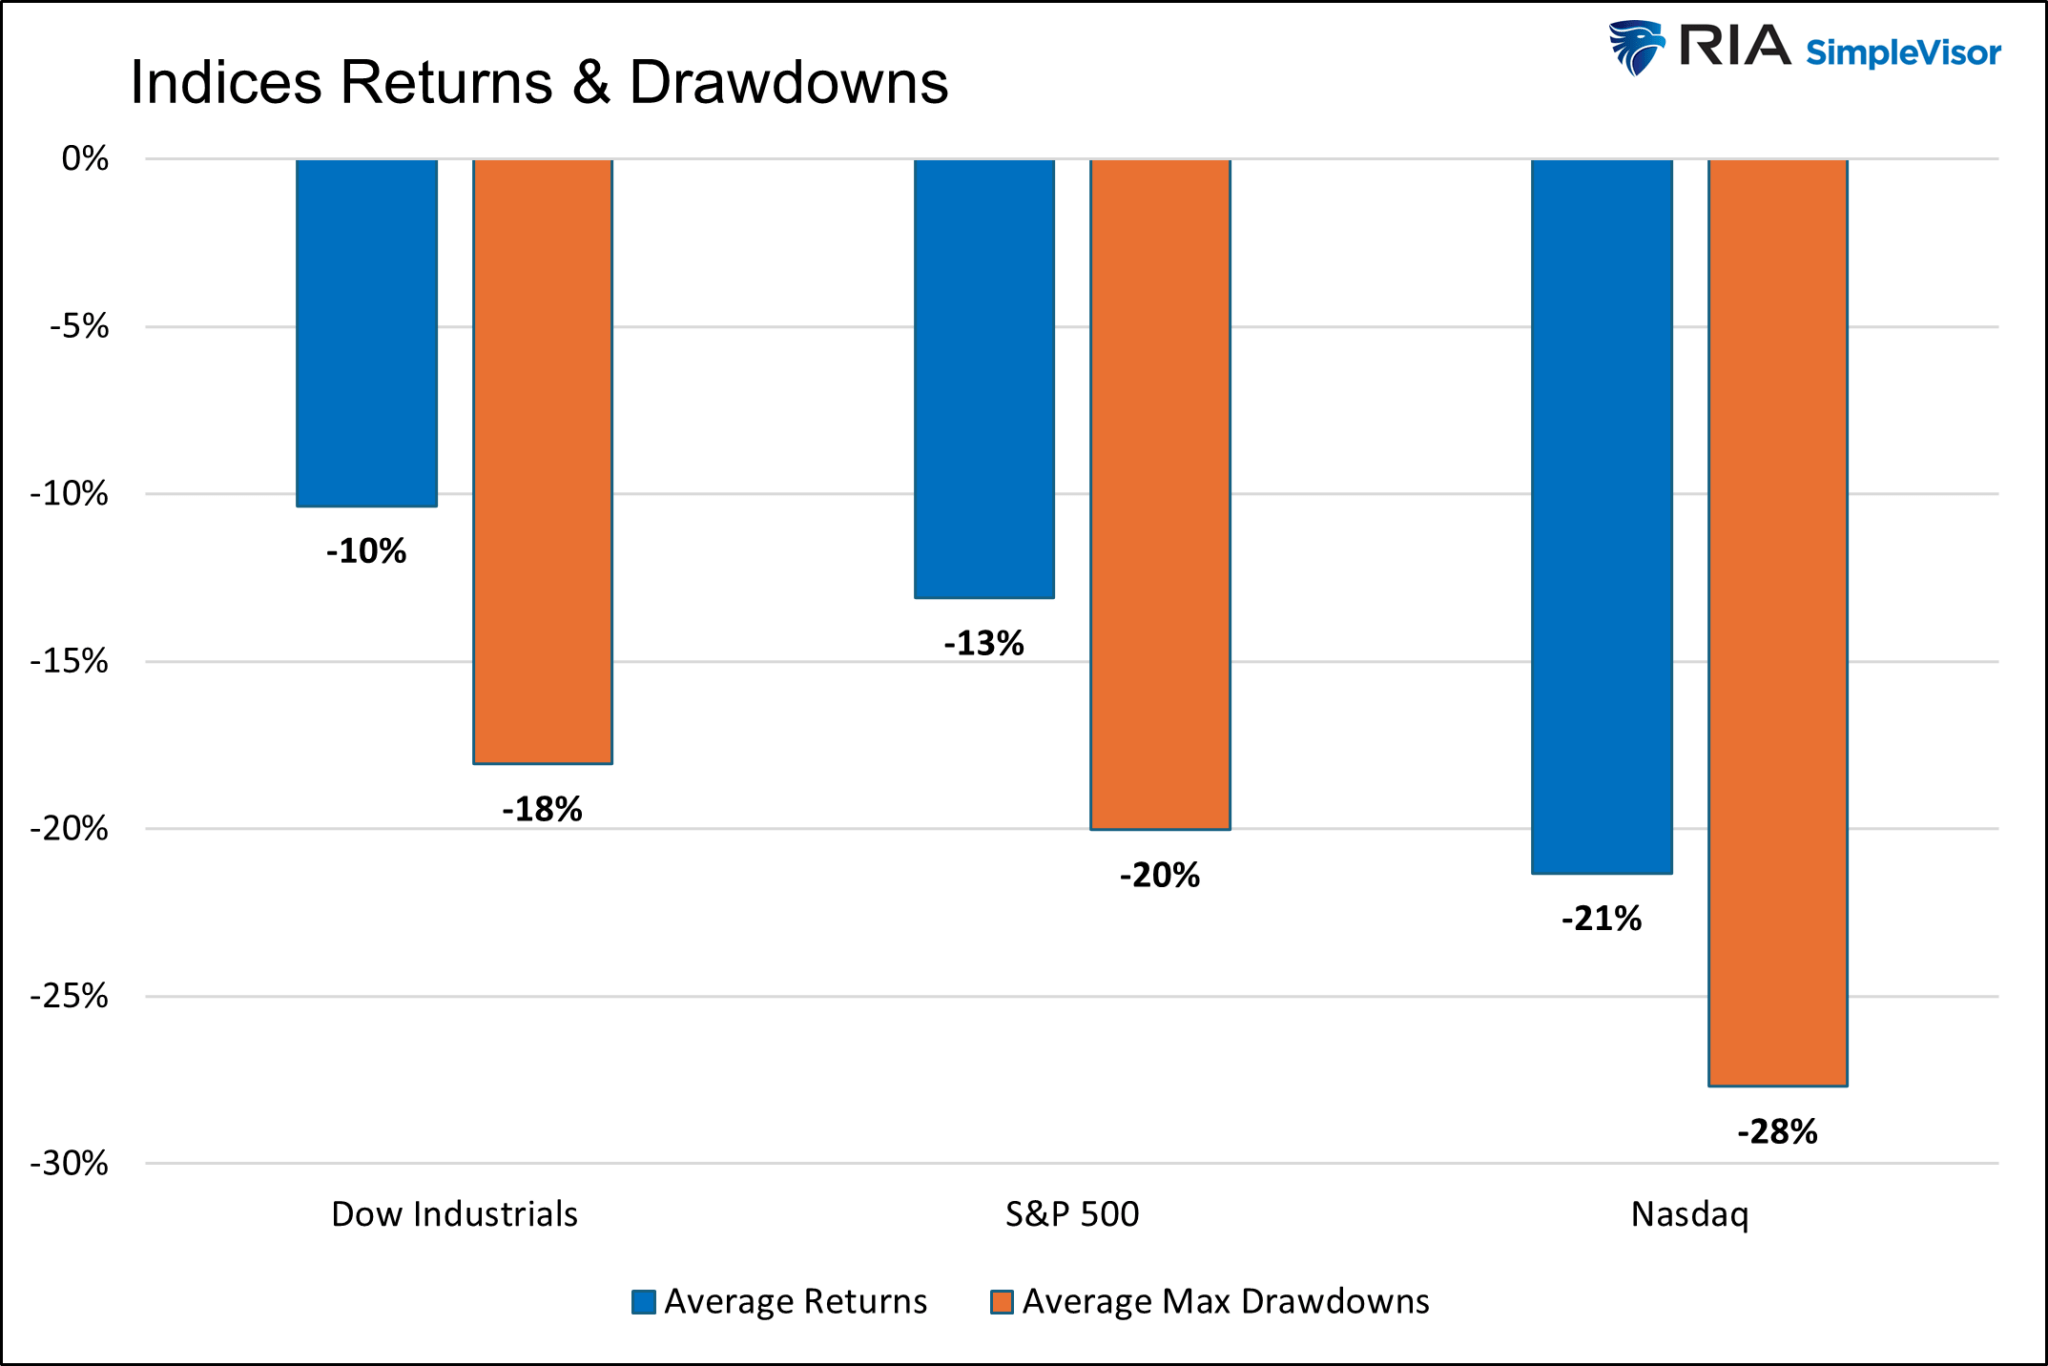
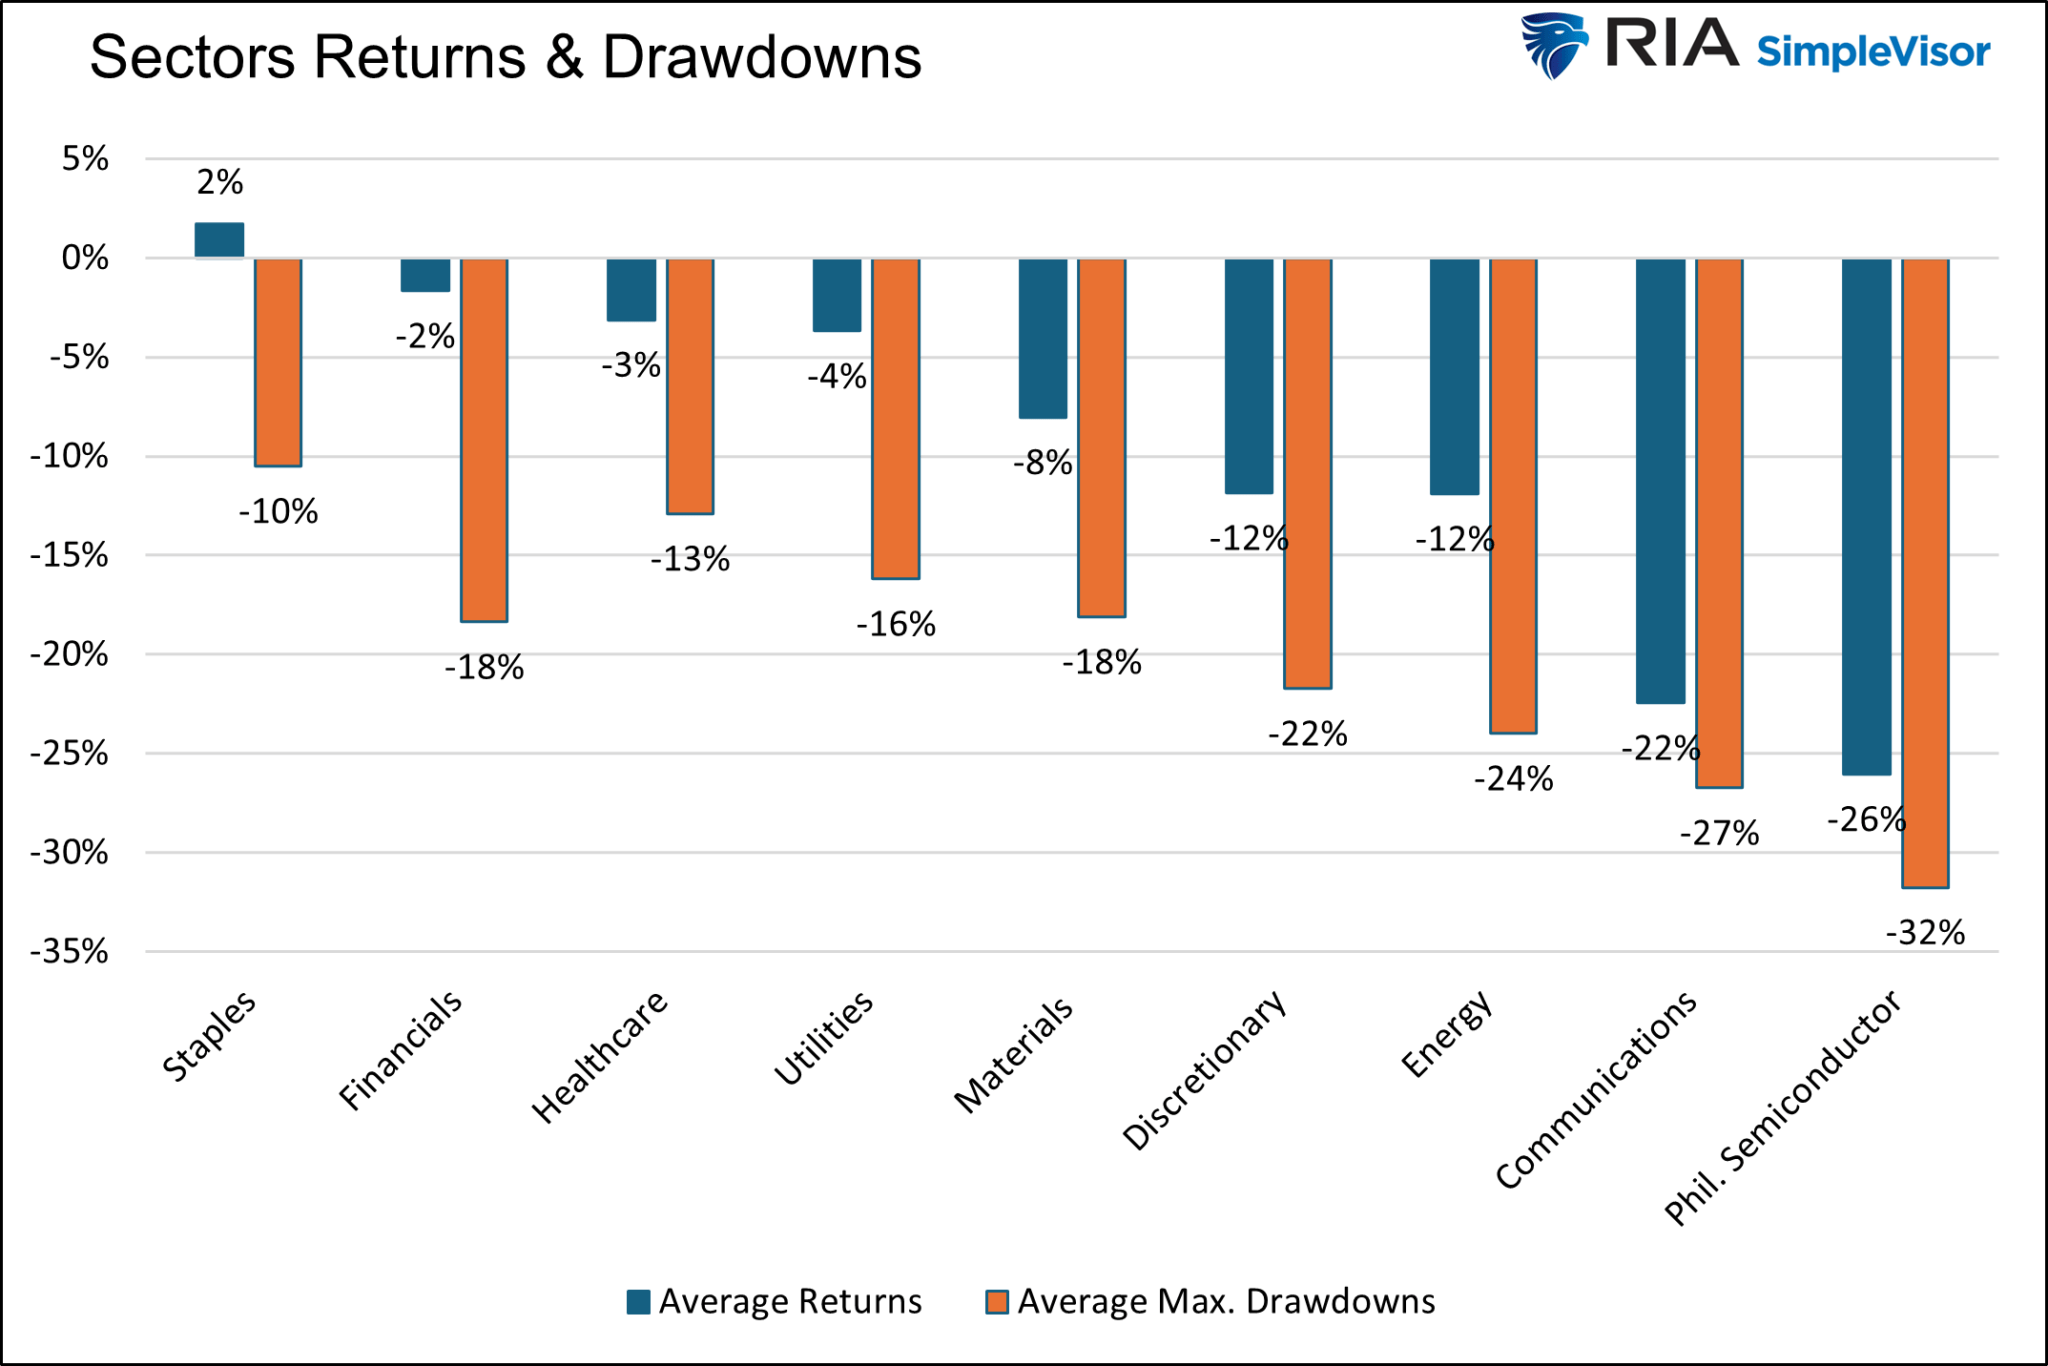
Next, we break out the returns by similar classes of stocks. We added gold and gold miners to the factor returns graph. The graphs show the average return and the average of the maximum drawdowns during the five periods.
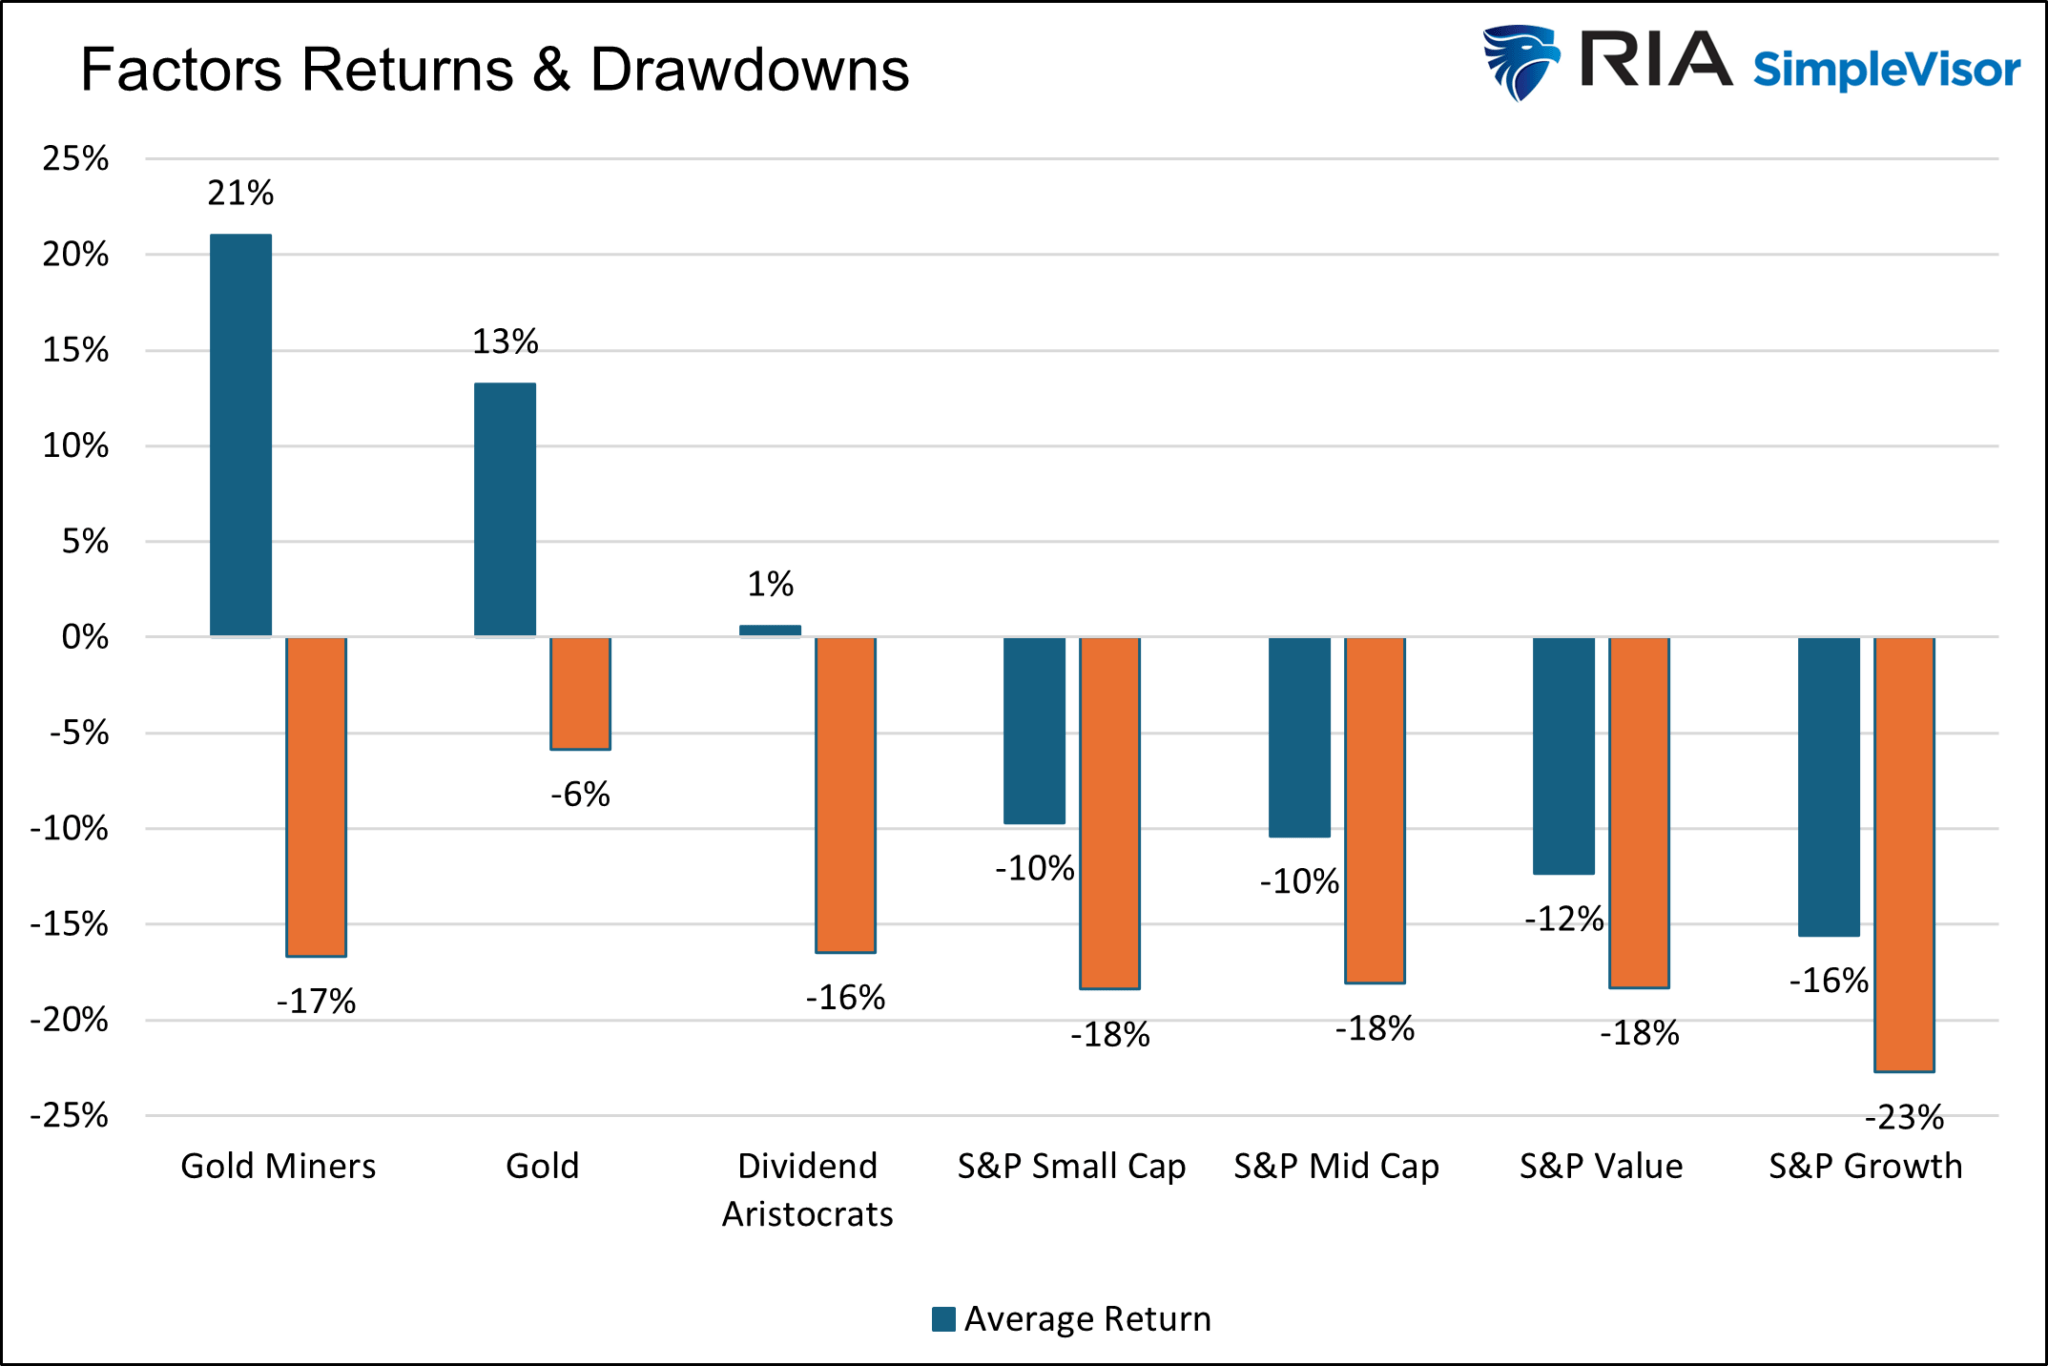
There are a few important takeaways:
- Gold and gold miners are the best performers during bull steepening periods by a long shot.
- Besides gold and gold miners, staples were the only other category with a positive compounded and average return.
- Every index, sector, asset, and factor, including gold and gold miners, had a negative average return at some point during the steepening period.
- The differences between S&P value and growth were not as significant as we suspected they would be.
- Similarly, the differences between the S&P 500 and the S&P small and mid-cap indexes were minimal.
- The lower beta, more value-oriented sectors clearly outperformed the higher beta sectors and factors during the steepening shift.

A Disclaimer About Expectations
It’s easy to extrapolate the past to the future. However, each of the five periods above was different. There is no doubt that the next persistent bull steepening, whether we are in it now or in the future, will have different characteristics. Past performance may not be a reliable indicator of the future.
We are currently 12 weeks into a bull steepening cycle. If it persists for another eight weeks, it will meet the threshold we used to calculate the results above. However, if that is the case, the data to calculate the expected returns and drawdowns will start from late May. The early start date could skew our expectations.
For instance, gold is up about 10% from the start date. If this is a persistent bull steepening cycle and gold ultimately matches the average 13% return over the prior five periods, it has limited upside. However, its average drawdown during the previous periods is about 6%.
Therefore, if this instance matches the average return and drawdown, we should expect gold to fall by 15% before rebounding to about 3% more than current levels.
Similarly, the sectors with prices higher than their late May levels could decline by more than the average return from current levels to match the average return.
Summary
The results of our study are relatively consistent across the five time frames. Therefore, if the current bull steepening continues, the likelihood that gold, gold miners, and the more conservative, lower beta sectors outperform the broader market is good.
The recent performance of the utility and staples sectors, along with gold and gold miners, might hint that investors are betting on a bull steepening.
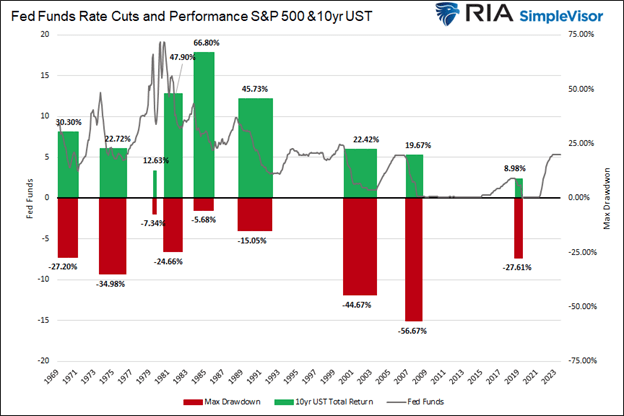
We leave you with two graphs showing the importance of risk management during a bull steepening cycle that leads to a recession.