
In this issue of “Was This A Bear Market? Or Just A Big Correction?”
- Still Stuck In The Middle
- What Defines A “Real” Bear Market?
- A Growing List Of Concerns
- Portfolio Positioning
- MacroView: Why Jeremy Siegel Is Wrong About Bonds
- Sector & Market Analysis
- 401k Plan Manager
Follow Us On: Twitter, Facebook, Linked-In, Sound Cloud, Seeking Alpha
Catch Up On What You Missed Last Week

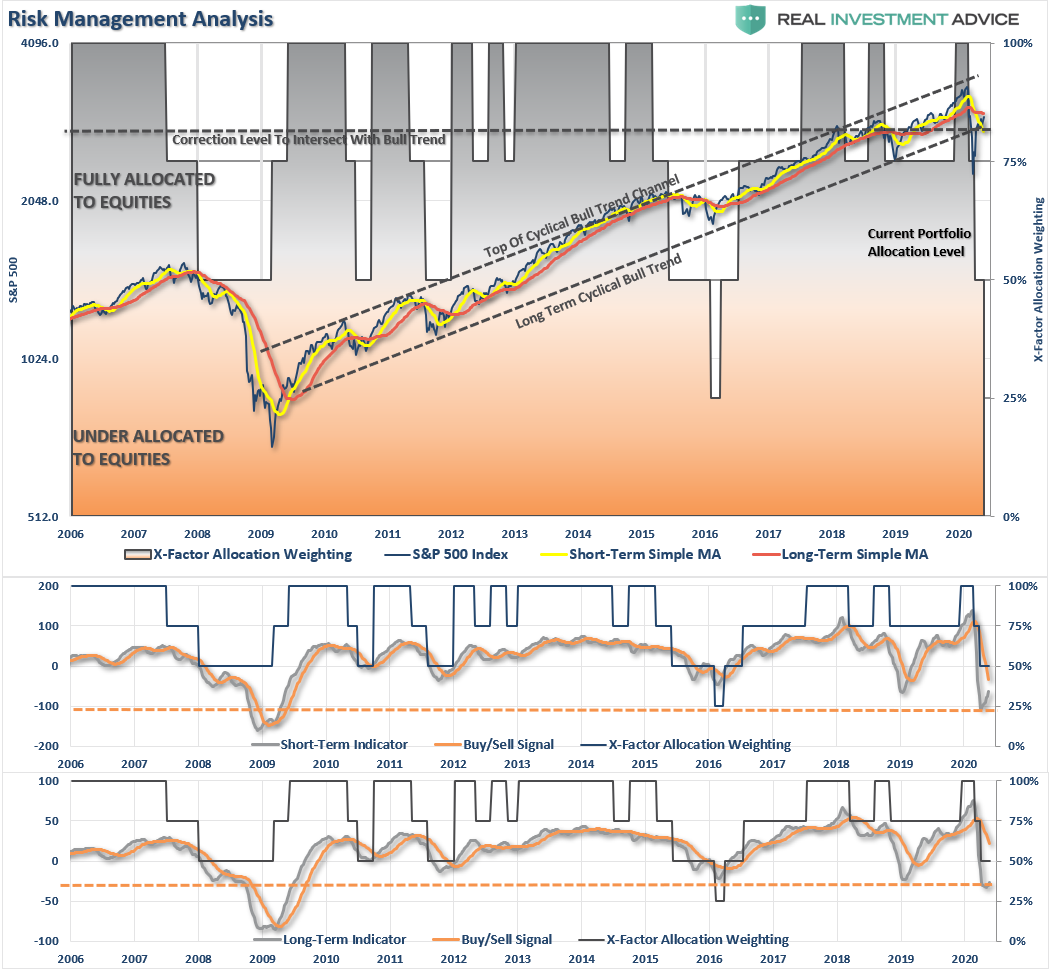
Still Stuck In The Middle
As noted last week, the markets remain stuck between the 50- and 200-dma. That remained the case this week once again, keeping any expansion of equity positioning on hold.
The shaded blue area shows the containment of the market between the two moving averages. With the market very overbought short-term (orange indicator in the background), there is downside pressure on prices short-term.
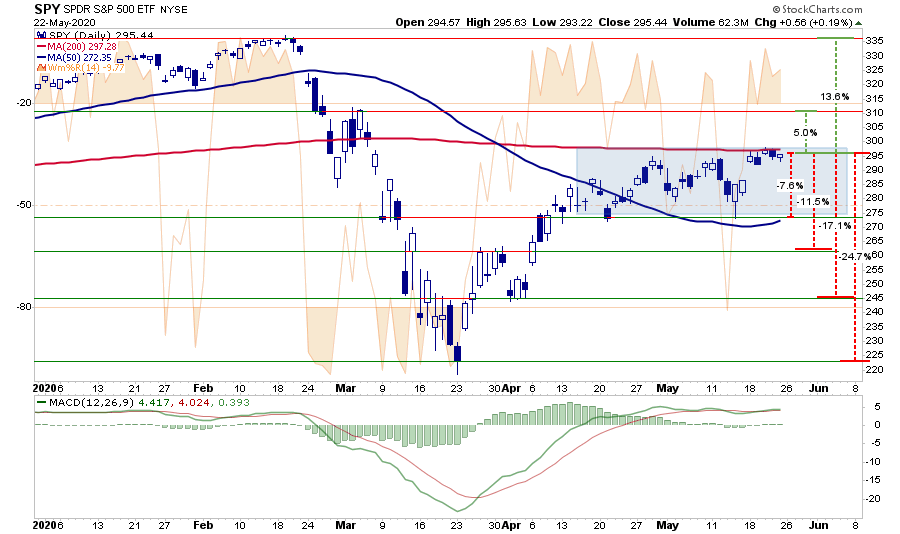
This past week, the current risk/reward ranges remain unfavorable. I have updated the levels from last week:
- -7.6% to the 50-dma vs. +5% to the March peak.
- -11.5% to -17.1% to the late March peak or early April low vs. +13.6% to all-time highs.
- -24.7% to March 23rd lows vs. 13.6% to all-time highs.
For now, we remain “stuck in the middle.”
However, if the markets can\ break above the 200-dma, and maintain that level, it would suggest the bull market is back in play. Such would change the focus from a retest of previous support to a push back to all-time highs.
While such would be hard to believe, given the economic devastation currently at hand, technically, it would suggest the decline in March was only a “correction” and not the beginning of a “bear market.”

Was This A Correction Or A Bear Market?
Price is nothing more than a reflection of the “psychology” of market participants. A potential mistake in evaluating “bull” or “bear” markets is using a “20% advance or decline” to distinguish between them.
Such brings up an interesting question. After a decade-long bull market, which stretched prices to extremes above long-term trends, is the 20% measure still valid?
To answer that question, let’s clarify the premise.
- A bull market is when the price of the market is trending higher over a long-term period.
- A bear market is when the previous advance breaks, and prices begin to trend lower.
The chart below provides a visual of the distinction. When you look at price “trends,” the difference becomes both apparent and useful.

This distinction is important.
- “Corrections” generally occur over very short time frames, do not break the prevailing trend in prices, and are quickly resolved by markets reversing to new highs.
- “Bear Markets” tend to be long-term affairs where prices grind sideways or lower over several months as valuations are reverted.
Using monthly closing data, the “correction” in March was unusually swift but did not break the long-term bullish trend. Such suggests the bull market that began in 2009 is still intact as long as the monthly trend line holds.
However, I have noted the market may be in the process of a topping pattern. The 2018 and 2020 peaks are currently forming the “left shoulder” and “head” of the topping process. Such would also suggest the “neckline” is the running bull trend from the 2009 lows. A market peak without setting a new high that violates the bull trend line would define a “bear market.”
Valuations
Valuations also suggest the decline in March was just a correction and not a bear market.
The chart below shows the history of secular bull market periods going back to 1871 using data from Dr. Robert Shiller. The defining difference between bull and bear markets is valuations. Bull markets are defined by expanding valuations, while bear markets contract valuations. Market “corrections” tend to have minimal impacts on valuations.
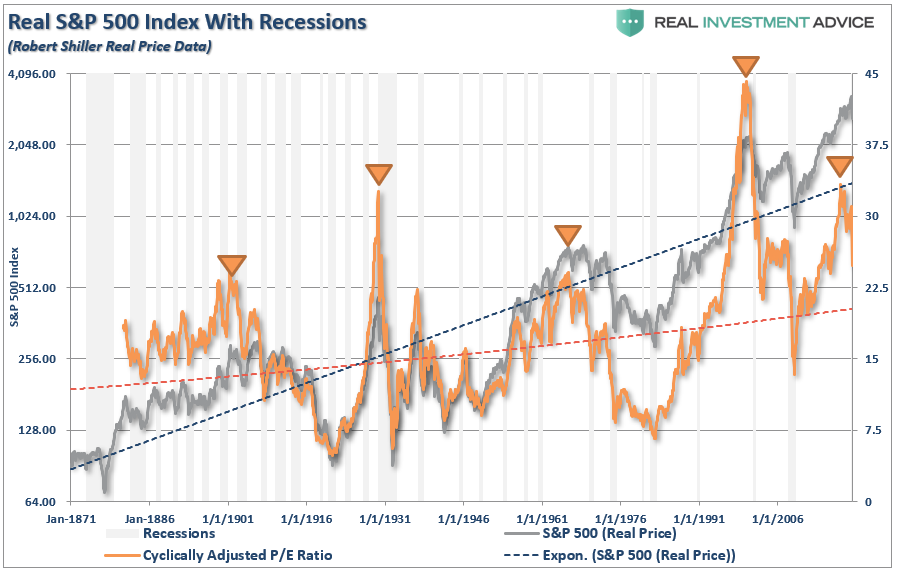
During trending bull markets, valuations remain elevated even during corrective processes. However, during bear markets, valuations tend to compress as prices adjust to weaker earnings growth.
The surge in valuations in recent weeks suggests the markets remain in a “corrective” process rather than a “bear market.”
While monetary policy has kept the valuation reversion process from completing, it likely hasn’t eliminated the risk.
If March was indeed just a “correction,” then earnings will need to quickly recover back to previous levels to support current valuation levels. However, given the economic devastation, I suspect the “correction” was likely the beginning of a more protracted valuation reversion process and “bear market.”
Monthly Moving Average Crossover
Lastly, from a purely technical perspective, we have not confirmed a “traditional” bear market. One of the key identifiers of a “bear market” versus a “correction” is the “bearish crossover” of the short and long-term moving averages.
In both 2001 and 2008, the moving average crossover delineated the start of a more protected “bear market” process. Despite the one month correction in March, the rebound in April and May have kept the moving average crossover from triggering.
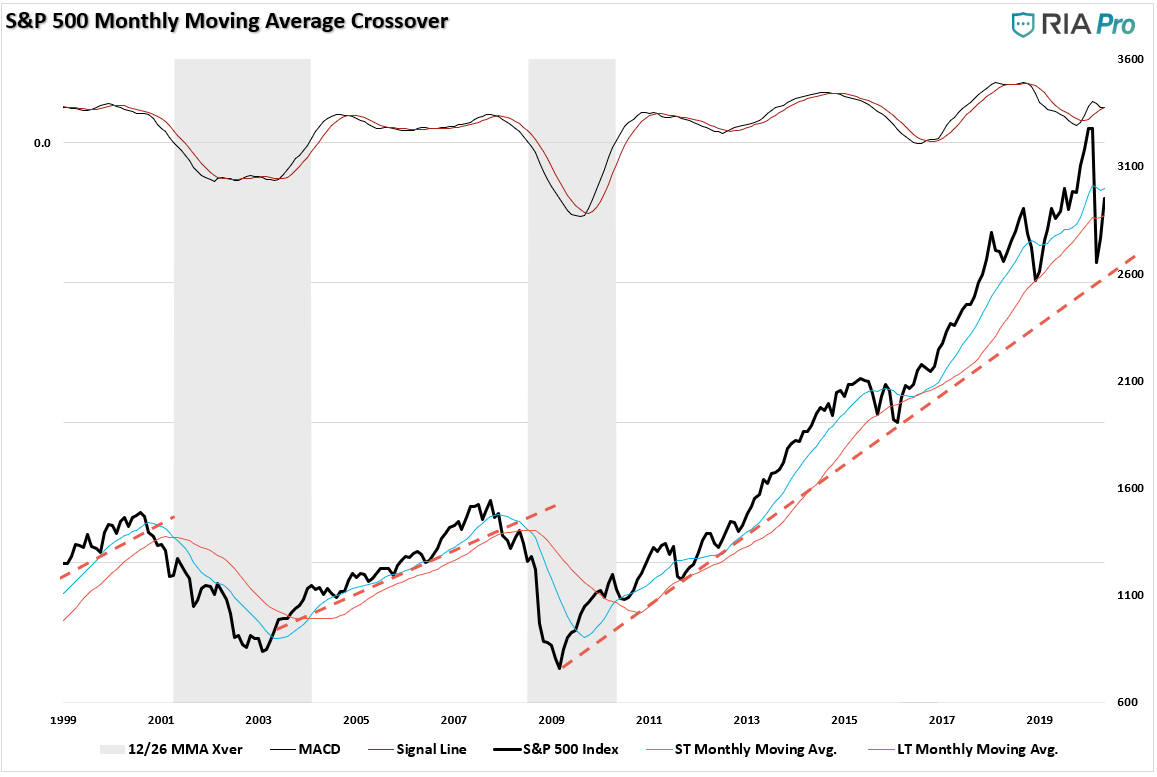
Without a monthly moving average crossover, there is little historical precedent to suggest the decline in March was anything other than a deep corrective process.
However, if we are in the beginning stages of a longer-term valuation reversion process, then the crossover will occur in the months ahead.
Bear Markets Begin With Corrections
There is one crucial point that needs addressing.
Was the decline in March just a “correction” or the start of a “bear market?”
Only time will tell with certainty, but all “bear markets” begin with a “correction.”
Every bear market in history has an initial decline, a reflexive rally, then a protracted decline which reverts market excesses. Investors never know where they are in the process until the rally’s completion from the initial fall.
Given the deviation of the market, due to Fed stimulus, was so extremely deviated above long-term trends, the depth of the “correction” was not surprising. However, if this is the start of a “bear market,” confirmed by a change in trend, the depth of the decline will eventually be equally as great.

A Growing List Of Concerns
What we do know is there is a litany of warning signs which suggest risk greatly outweighs the reward of being aggressively invested in the markets. Here is a shortlist:
- Frantic positioning and extreme readings in market internals.
- Speculative positioning in options markets.
- Small investors are incredibly bullish.
- Put/Call ratios are massively elevated.
- A lack of risk hedging.
- Buying interest has hit extremes.
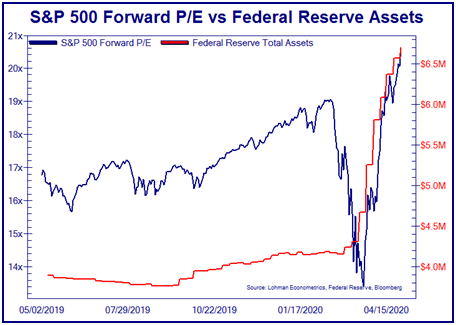
- Forward P/E ratios are historically rich.
- Value to Growth ratios are at some of the lowest levels in history.
- The hope for a “V-shaped” recovery is likely to be disappointed.
- Expectations for an earnings recovery remain overly exuberant.
- Unemployment is likely to remain elevated longer than most expect.
- Consumer confidence will likely not bounce back as fast as hoped.
- Rising delinquencies, defaults, and bankruptcies will be problematic.
- A resurgence of COVID-19 later this summer will set back recovery expectations.
- Fed liquidity is likely much more limited than markets expect.
- A resurgence of a “trade war” with China could not be more ill-timed.
- Risk of acceleration of geopolitical tensions with China
- Corporate profitability will plunge
I could go on, but you get the idea.
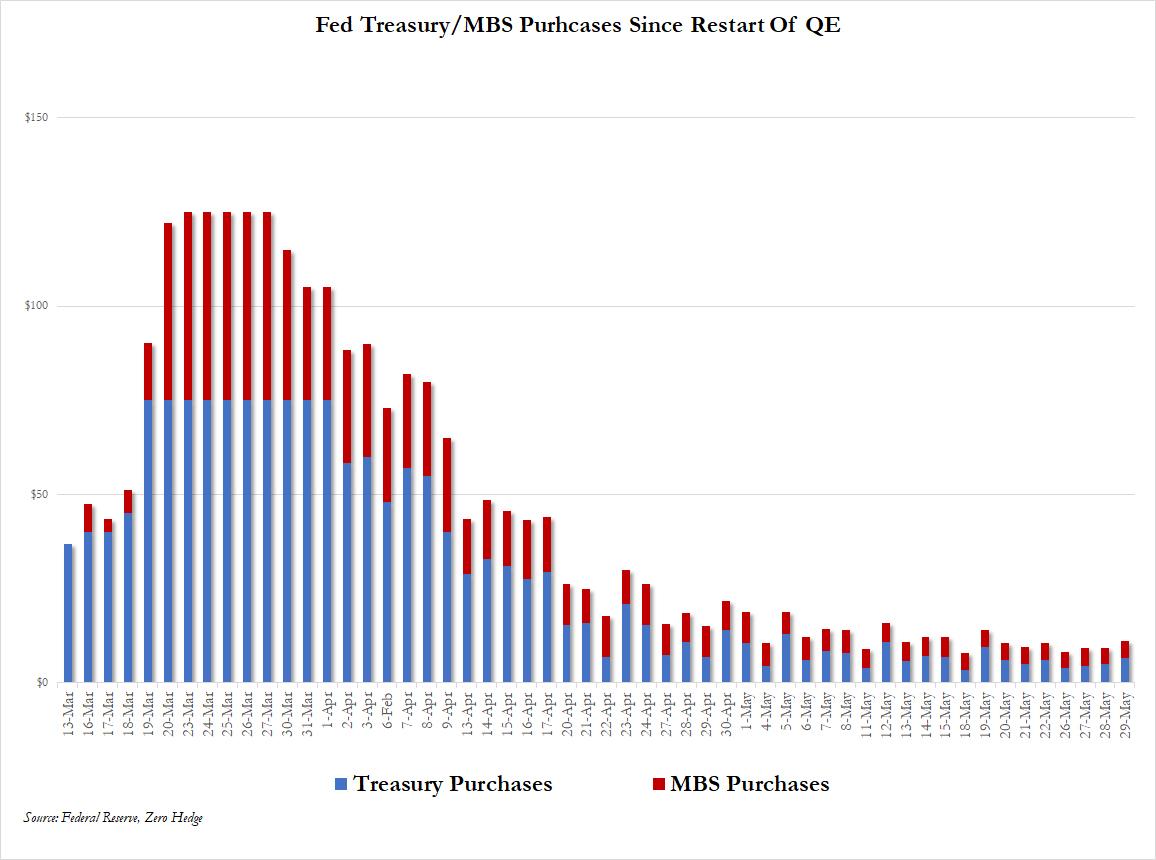
Don’t Fight The Fed
With the amount of economic devastation that is in process, and will likely continue for quite some time, it is hard to suggest the decline in March was only a “correction.” There are numerous headwinds that could derail markets in the months ahead despite the Fed’s liquidity.
Speaking of liquidity, the basis of the “Don’t Fight The Fed” mantra, has now shrunk from $75 billion/day in March to just $5 billion/day.
The most logical view is that we are in the midst of a torrid reflexive rally that seems to be losing steam. Such would be typical of a reflexive “bear market rally.,” Over the next couple of months the markets will have to come to grips with economic and fundamental realities.
The next leg lower will likely surprise most investors.

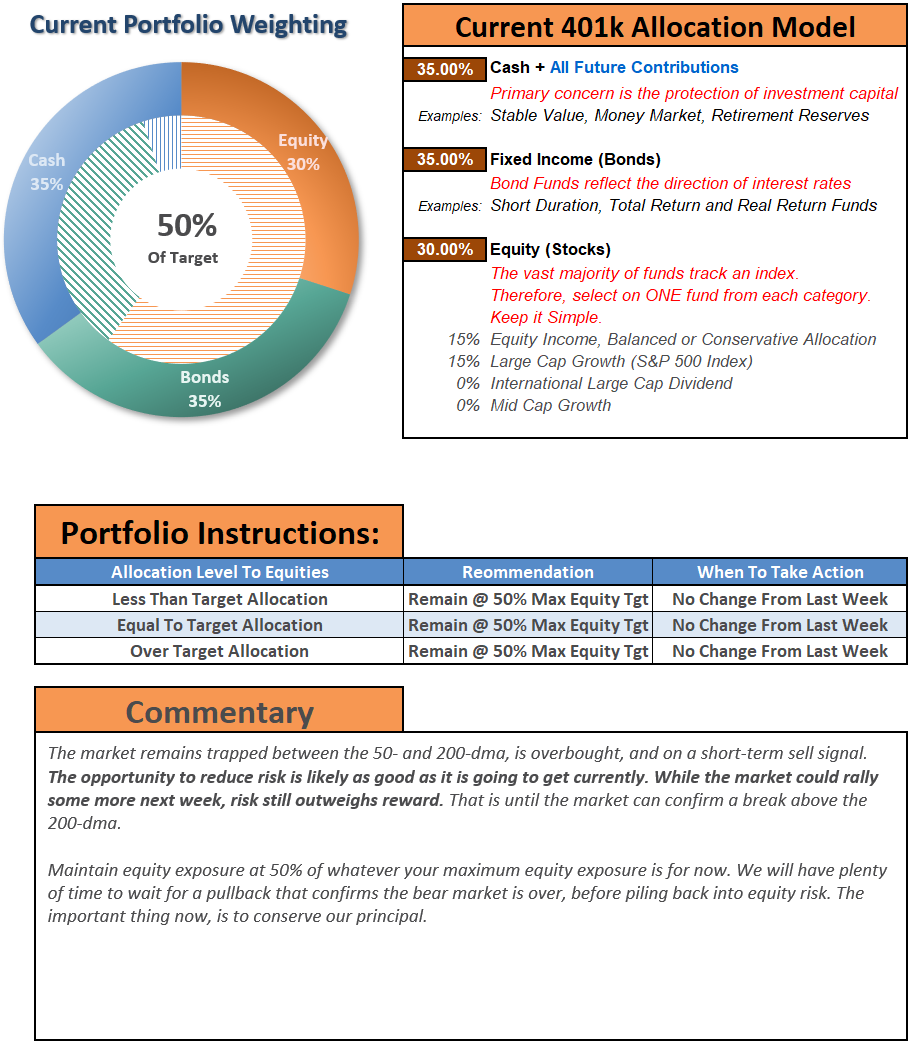
Positioning Update
This analysis is part of our thought process as we continue to weigh “equity risk” within our portfolios.
We remain focused on our positioning, and we again modestly increased our equity exposure during this past week. However, we also balanced that increase with matched weights in Treasury bonds to hedge our risk.
Taking profits in our trading positions also continues to be a “staple” in our management process. This past week we took profits in the Communications space that has gotten extremely extended. We also continue to rebalance portfolios regularly.
We don’t like the risk/reward of the market currently, and suspect we will have a better opportunity to increase equity risk later this summer. But, if things change, we will also.
What is essential is remembering one investing truth. Investing isn’t a competition of who gets to say “I bought the bottom.” Investing is about putting capital to work when reward outweighs the risk.
That is not today.
Bear markets have a way of “suckering” investors back into the market to inflict the most pain possible.
Such is why “bear markets” never end with optimism but in despair.

The MacroView

If you need help or have questions, we are always glad to help. Just email me.
See You Next Week
By Lance Roberts, CIO
Market & Sector Analysis
Data Analysis Of The Market & Sectors For Traders
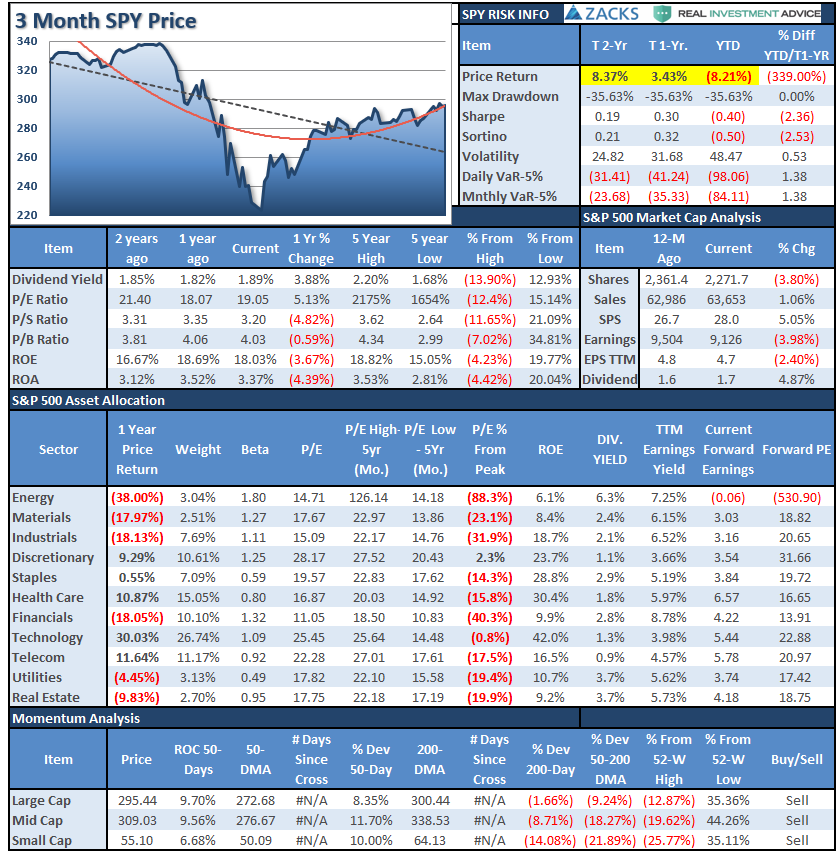
S&P 500 Tear Sheet
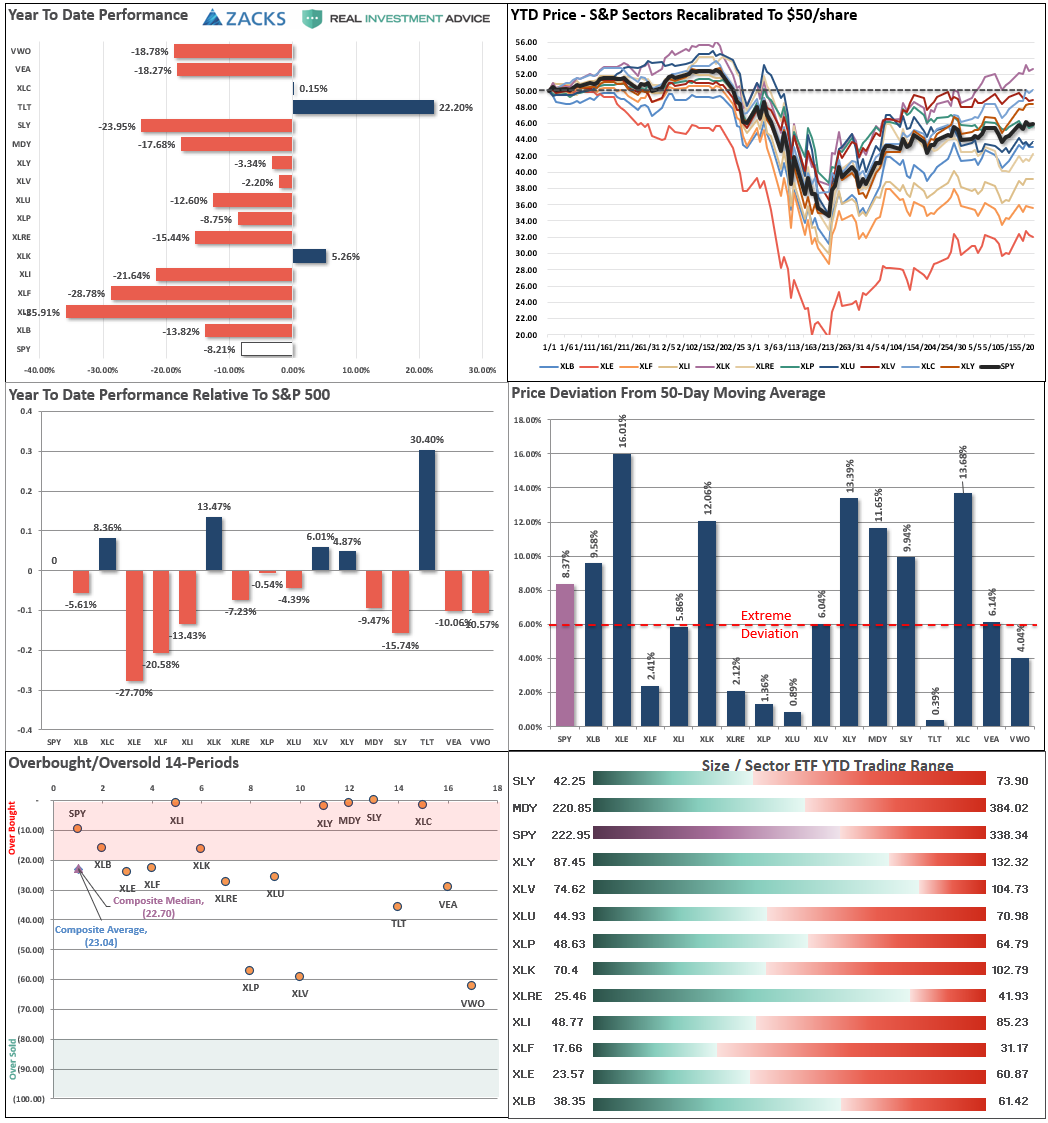
Performance Analysis
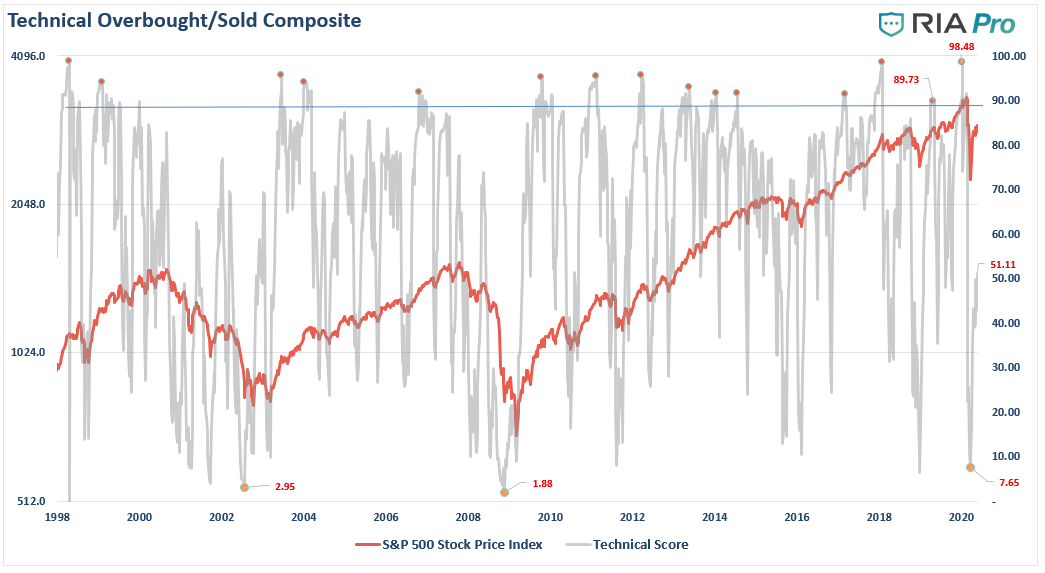
Technical Composite
Note: The technical gauge bounced from the lowest level since both the “Dot.com” and “Financial Crisis.” However, note the gauge bottoms BEFORE the market bottoms. In 2002, the market retested lows. In 2008, there was an additional 22% decline in early 2009.
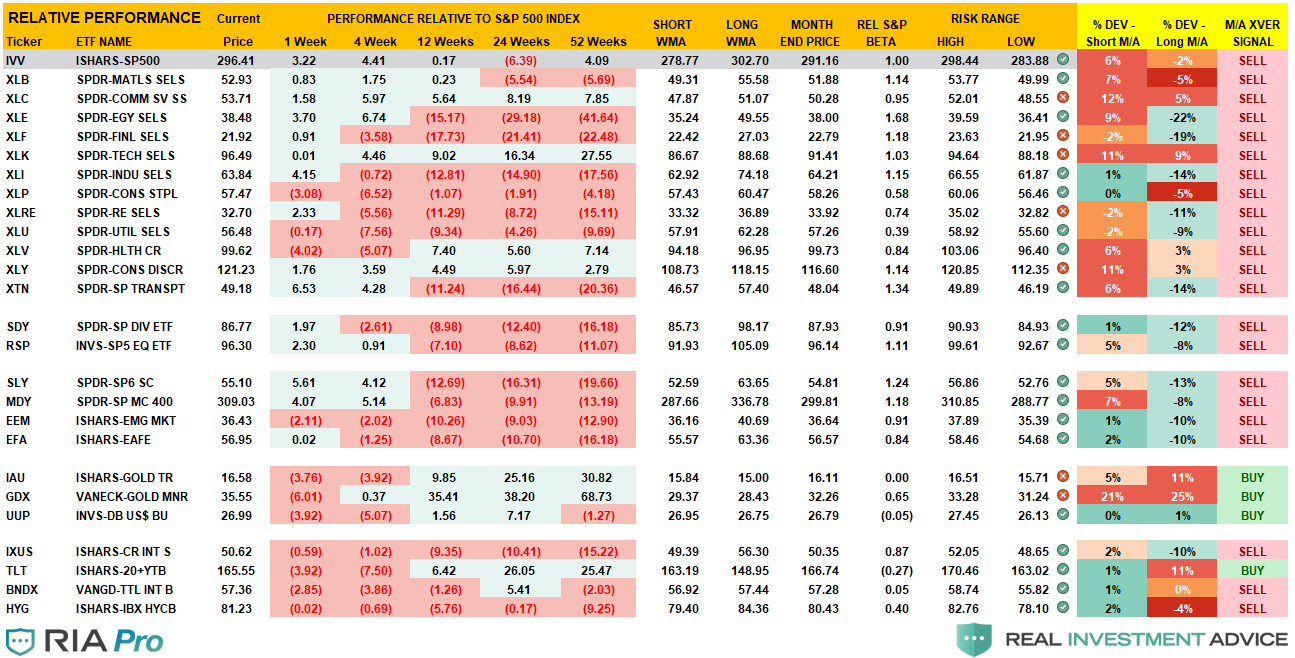
Sector Model Analysis & Risk Ranges
How To Read.
- Each sector and market is compared to the S&P 500 index in terms of relative performance.
- The “MA XVER” is determined by whether the short-term weekly moving average crosses positively or negatively with the long-term weekly moving average.
- The risk range is a function of the month-end closing price and the “beta” of the sector or market.
- The price deviation above and below the moving averages is also shown.
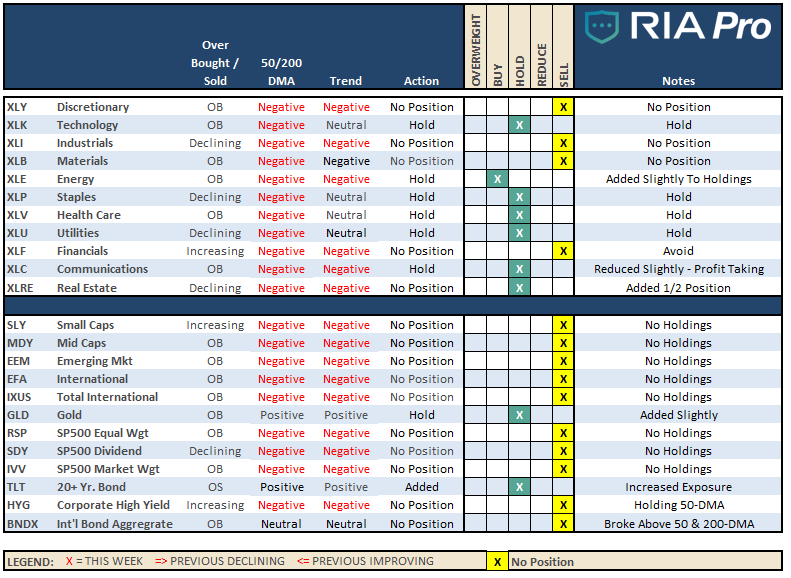
Sector & Market Analysis:
Be sure and catch our updates on Major Markets (Monday) and Major Sectors (Tuesday) with updated buy/stop/sell levels.
Sector-by-Sector
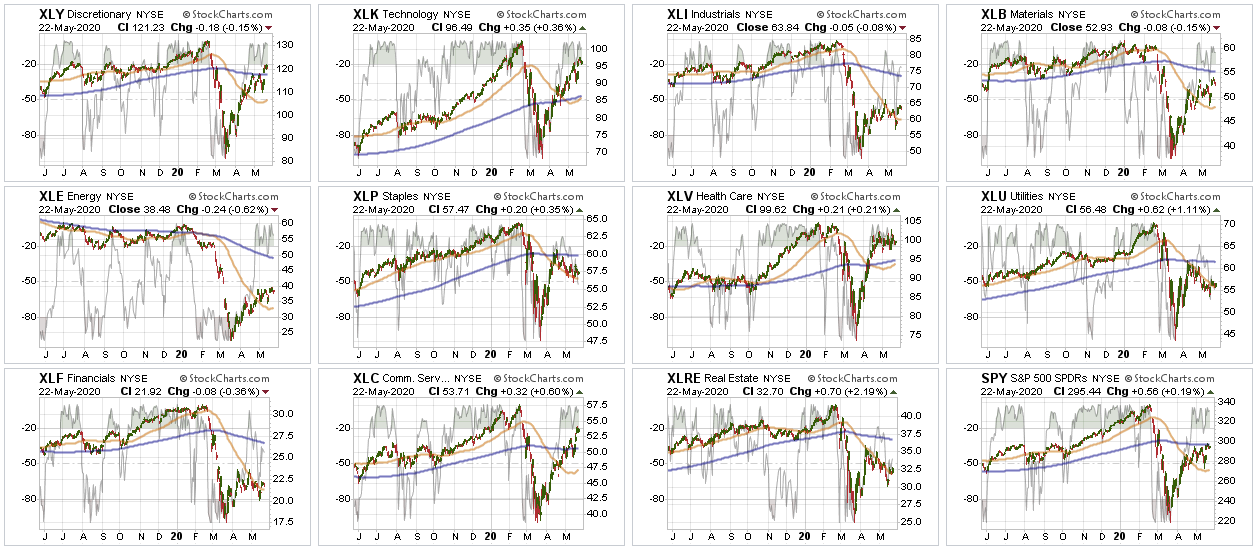
Improving – Materials (XLB)
This past week, the market continued to struggle between the 61.8% retracement levels and the 200-dma. Materials continue to underperform due to a very weak economy, and there is no reason to maintain exposure to the sector currently.
Current Positions: No Positions
Outperforming – Discretionary (XLY), Technology (XLK), Communications (XLC), Staples (XLP), and Healthcare (XLV),
Previously, we added to our core defensive positions Healthcare, Staples, and Utilities. We continue to hold our exposures in Technology. This past week we did trim our Communications exposure slightly due to the extreme overbought condition. These sectors are continuing to outperforming the S&P 500 on a relative basis and have less “virus” related exposure. We trimmed our Communications exposure due to the recent run up.
Current Positions: XLK, XLC, XLP, and XLV
Weakening – Utilities (XLU)
After adding a small weighting in Utilities, we continue to look for an opportunity to increase our exposure. We continue to watch again this week.
Current Position: 1/3rd Position XLU
Lagging – Industrials (XLI), Financials (XLF), Real Estate (XLRE), and Energy (XLE)
Financials continue to underperform the market. As we have said previously, Financials and Industrials are the most sensitive to Fed actions (XLF) and the shutdown of the economy (XLI).
We continue to hold our Energy sector (XLE) exposure, and we did add slightly to those holdings last week. We also are doing the same with our recent Real Estate exposures, which remain oversold on a relative basis.
Current Position: 1/3rd Position XLE, 1/2 XLRE
Market By Market
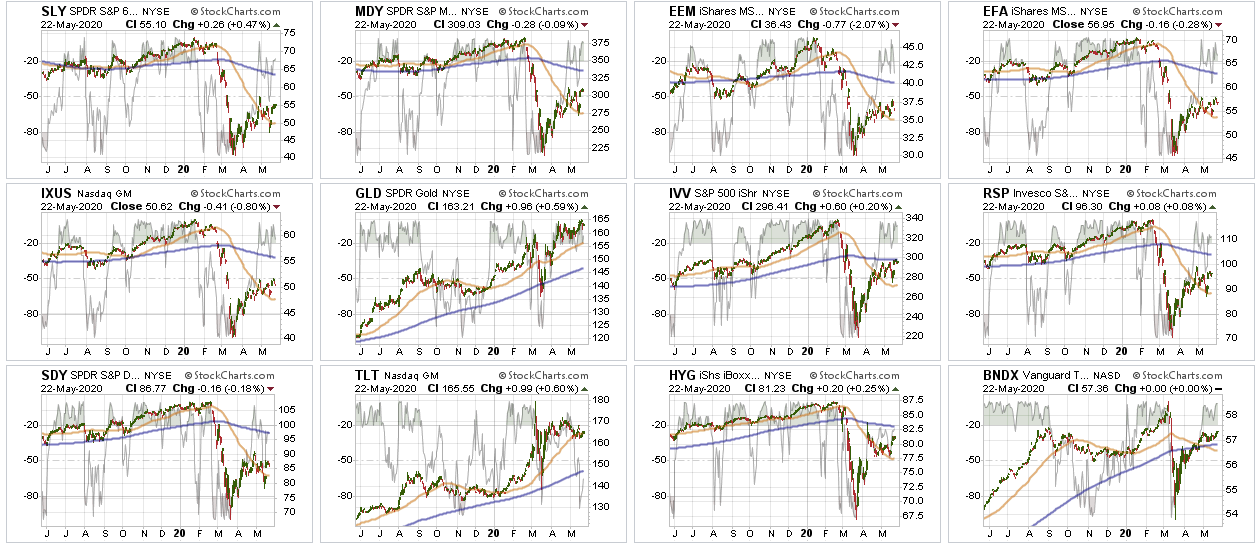
Small-Cap (SLY) and Mid Cap (MDY) – We continue to avoid these sectors for now aggressively, and there is no rush to add them anytime soon. Be patient, small, and mid-caps are lagging badly. You can not have a “bull market” without “small and mid-cap” stocks participating.
Current Position: None
Emerging, International (EEM) & Total International Markets (EFA)
Same as Small-cap and Mid-cap. Given the spread of the virus and the impact on the global supply chain.
Current Position: None
S&P 500 Index (Core Holding) – Given the overall uncertainty of the broad market, we previously closed out our long-term core holdings. We are using SPY and QQQ index ETF’s for trading positions only for now.
Current Position: None
Gold (GLD) – Previously, we added additional exposure to IAU this past week and currently remain comfortable with our exposure. We rebalanced our GDX position back to target weight previously.
We are also maintaining our Dollar (UUP) position as the U.S. dollar shortage continues to rage and is larger than the Fed can offset.
Current Position: 1/2 weight GDX, 2/3rd weight IAU, 1/2 weight UUP
Bonds (TLT) –
As we have been increasing our “equity” exposure in portfolios over the last few weeks, we added more to our holding in TLT to improve our “risk” hedge in portfolios. We did so again last week by adding to IEF, and TLT, and reducing SHY slightly.
Current Positions: SHY, IEF, BIL, TLT
Sector / Market Recommendations
The table below shows thoughts on specific actions related to the current market environment.
(These are not recommendations or solicitations to take any action. Such is for informational purposes only related to market extremes and contrarian positioning within portfolios. Use at your own risk and peril.)
Portfolio / Client Update
This past week, the market remained range-bound between the 61.8% retracement level and the 200-dma. As discussed previously, there is some short-term upside, but as we head into the summer months, the relative risk/reward ratio is not in our favor. (Please see the analysis in the main body of this week’s missive.)
While it certainly seems that no matter how dire the data is, the market only wants to go higher, such is also the trap. We are mindful of how markets work over longer periods, but also realize performance is important to you. Therefore we continue to add exposure and balance risk as we can.
Changes
Our process this week remains the same. We continue to work around the edges to add exposure while managing risk. In models, we added to our position in Clorox (CLX), after taking profits previously and added Phillips (PHG), the maker of UV lighting.
We also brought our exposures in positions that were underweight to target weight, including increasing our exposure to energy slightly.
We offset those increases in equity risk with additions to our bond and gold holdings. Our process is still to participate in markets while preserving capital through risk management strategies.
For now, there is much more “trading” activity than usual as we work out way through whatever market is going to come. Is the bull market back? Maybe. Maybe Not. Once the bottom is clearly in, we will settle back down to a longer-term, trend-following, structure. Now is not the time for that.
We continue to remain defensive and in an excellent position with plenty of cash, reduced bond holdings, and minimal equity exposure in companies we want to own for the next 10-years. Just remain patient with us as we await the right opportunity to build holdings with both stable values, and higher yields.
Please don’t hesitate to contact us if you have any questions or concerns.
Lance Roberts
CIO
THE REAL 401k PLAN MANAGER
A Conservative Strategy For Long-Term Investors
If you need help after reading the alert; do not hesitate to contact me
Model performance is a two-asset model of stocks and bonds relative to the weighting changes made each week in the newsletter. Such is strictly for informational and educational purposes only and should not be relied on for any reason. Past performance is not a guarantee of future results. Use at your own risk and peril.

401k Plan Manager Live Model
As an RIA PRO subscriber (You get your first 30-days free) you have access to our live 401k plan manager.
Compare your current 401k allocation, to our recommendation for your company-specific plan as well as our on 401k model allocation.
You can also track performance, estimate future values based on your savings and expected returns, and dig down into your sector and market allocations.
If you would like to offer our service to your employees at a deeply discounted corporate rate, please contact me.


