Inside This Week’s Bull Bear Report
- Analysis Of The Market As The Fed Cuts Rates
- How We Are Trading It
- Research Report –Labor Market’s Impact On Earnings
- Youtube – Before The Bell
- Market Statistics
- Stock Screens
- Portfolio Trades This Week
The Fed Cut Rates…Now What?
As noted last week, the trend of higher lows and the triggering of the MACD “buy signal” all suggested the recent correction phase was over. That was confirmed this past week, as the market broke out to new all-time highs following the 50 basis point cut in the Federal Reserve overnight lending rate on Wednesday.
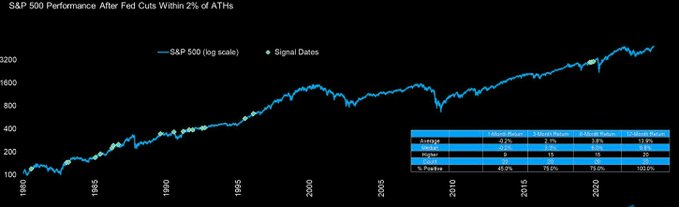
The market has continued to front-run the Fed’s rate cuts during the last two years. Each rally turned to disappointment as the Fed postponed while continuing to fight inflation. However, this past week, that battle was won. The question is, what happens next? A recent table from Carson Investment Research shows that near-term performance has been a mixed bag when the Federal Reserve has previously cut rates within 2% of all-time highs. However, returns over the next year are positive 100% of the time.

The difference in returns is whether there was a recession or not. There is little concern about a recession over the next 12 months, which should help support asset prices. However, since there are no guarantees, it is worth continuing to manage risk and maintain some hedges against a sharp pickup in volatility.
Technically Speaking
From a purely technical perspective, the market remains on a bullish buy signal and is not grossly overbought yet. On Friday, the market retested the breakout of the previous highs and held. Next week, if the market can hold these levels without breaking that support, the breakout will be confirmed, which should provide a bullish bias into the end of the month.

While the backdrop to the market is bullish, there is still some risk over the next month as we head into the beginning of earnings season and the November election. Speaking of earnings, analysts have been very busy downgrading estimates ahead of October.

Let me conclude: The bullish bias remains strong as the momentum chase continues. However, economic data, slowing earnings, and the upcoming election raise concerns. Risk management remains key, and we must be flexible in our positioning. Michael Lebowitz sent me a quote last week that I think sums up our views well:
“We don’t really care which way growth and inflation go. Not because it doesn’t impact our positioning, we’re just prepared to adjust.”
Now, let’s dig into that rate cut.
Need Help With Your Investing Strategy?
Are you looking for complete financial, insurance, and estate planning? Need a risk-managed portfolio management strategy to grow and protect your savings? Whatever your needs are, we are here to help.

Analysis Of The Market As The Fed Cuts Rates
As noted, the Federal Reserve reduced interest rates on Wednesday for the first time since 2020. The “bulls” are hopeful that Fed rate cuts and, ultimately, lower long-term rates will allow the rally that began in October 2022 to continue. However, some near-term concerns warrant some analysis.
To understand market returns post-Fed rate cuts, we must understand “why” the Federal Reserve is reducing the overnight lending rate.
The Fed has a few tools at its disposal:
- Open Market Operations – which is the buying and selling of securities to increase or decrease money supply.
- The Discount Rate – the interest rate charged between banks.
- Reserve Requirements – which controls the amount banks can lend and;
- Interest On Reserve Balances – changes can increase or decrease the opportunity cost that banks incur by not investing required reserves in interest-bearing assets.
Therefore, when the Federal Reserve cuts rates, the overall objective is to stabilize prices (i.e., control inflation) and stimulate economic growth (i.e., increase employment). The hope is that lowering financing costs will spur businesses and consumers to invest and borrow. Such will increase economic activity and employment. As Jerome Powell noted during his press conference:
“I don’t see anything in the economy right now that suggests that the likelihood of a recession, sorry, of a downturn, is elevated. You see growth at a solid rate. You see inflation coming down. You see a labor market that’s still at very solid levels. We don’t think we’re behind. We think this is timely, but I think you can take this as a sign of our commitment not to get behind.”
The Federal Reserve does not arbitrarily reduce interest rates but historically acts in response to concerns about declining economic growth and potential deflationary outcomes. Deflation, a negative inflation rate, is very hard to break as consumers retrench, expecting lower prices in the future. This psychological spiral of reduced consumption, leading to lower prices, further declines in consumption, and so on, can potentially create deep recessionary environments. That is why the Federal Reserve focuses on 2% annual inflation, which, in theory, should deliver stable economic growth and employment.
The Federal Reserve has historically cut rates as economic growth declines and unemployment increases. (Note: It appears that aggressive Fed rate-cutting cycles coincided with recessions; however, there is about a 9-month lag between the initial rate cuts and recession recognition.)

With this understanding, analysis of the historical relationship between rate cuts and market returns is worthwhile.
Analysis Of Market Returns Following Fed Rate Cuts
Over the last 24 months, the market has surged 45% in anticipation of rate cuts. If that sounds like a lot, it is. Currently, the market is pushing one of its largest deviations from the exponential growth trend in history. There have only been three other historical periods where such large, uninterrupted surges occurred: 1929, 1987, and 1999.
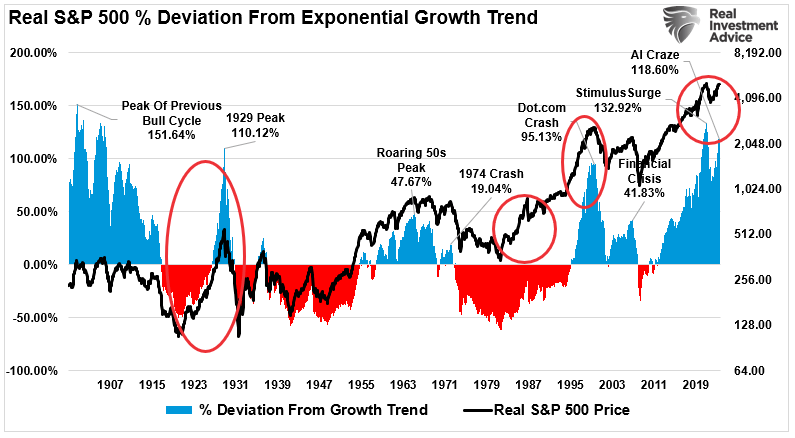
The issue with deviations from long-term growth trends is that they regularly precede reversions. The reason is that investor expectations exceed the earnings the underlying economy generates. Unsurprisingly, those reversions from more extreme deviations align with recessionary or credit-related events, and earnings growth expectations get realigned.
Following this week’s rate cuts, bullish optimism exploded as investors assumed market returns would increase further. There is certainly a case for that assumption based on previous history. As discussed in the table above, there have been 20 previous occasions where the Fed cut rates near all-time market highs. In all 20 instances, the markets were higher 12 months later.
However, the problem arises when earnings estimates don’t align with eventual outcomes. Some analysis from J.P. Morgan this past week clarifies the potential risk to investors.
Earnings Growth Is Key
They noted that the S&P 500 has rallied by about 25% in the past year, while historically, it averaged a gain of just 4% in the 12 months before the first Fed cut. Once rates start falling, equity performance has hinged on the economic growth outcome — eight of the last 12 easing cycles were accompanied by a recession, and four by a soft landing.

As is always the case with this type of analysis, you must be cautious. Analysis that uses “average” or “median” returns is fine, but it obfuscates the periods where markets had significant drawdowns. Furthermore, just because markets were higher 12 months later does not mean there were no corrections along the way.
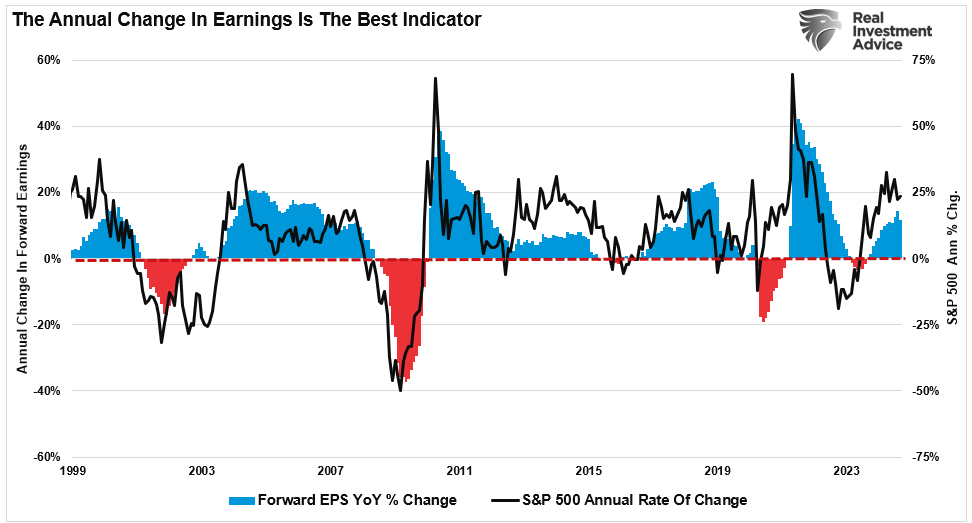
The crucial point is not whether the Federal Reserve cuts rates further but economic growth and its impact on earnings. As shown, there is a high correlation between the annual rate of change in the S&P 500 versus the annual growth in earnings.

The onset of a recession, or even a more aggressive economic slowdown, becomes the most significant risk. Given that earnings are derived from economic activity, any slowdown in consumer demand results in lower earnings. This is because:
- Rate cuts generally coincide with the Fed working to counter a deflationary economic cycle or financial event.
- As deflationary or financial events unfold, consumer activity contracts, which impairs corporate earnings.
- As corporate earnings decline, markets must reprice current valuations for lower earnings.
Recession Or Not?
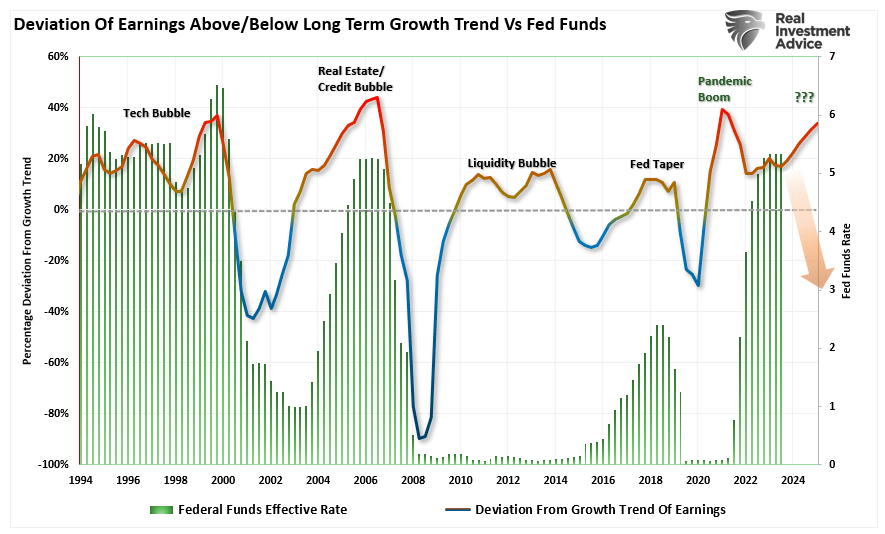
The chart below shows corporate earnings’ deviation from long-term exponential growth trends. You will note that the earnings deviation reverts when the Fed cuts rates. Therefore, while analysts are optimistic about earnings growth going into 2025, a Fed rate-cutting cycle will likely disappoint those expectations.
Unsurprisingly, as previously noted by Michael Lebowitz, since 1970, there have been nine instances in which the Fed significantly cut the Fed Funds rate. The average maximum drawdown from the start of each rate reduction period to the market trough was 27.25%. (Note: The three most recent episodes saw larger-than-average drawdowns. Of the six other experiences, only one, 1974-1977, saw a drawdown worse than the average.)

Markets are optimistic that the Federal Reserve will cut interest rates, but the economy will avoid a recession. Such is the “Goldilocks” scenario, where lower rates spur economic activity and increase economic activity. However, the question is whether the markets have already “priced in” the most optimistic outcomes.
For that, we will turn to technical analysis for some clues.
Technical Overview
As noted above, the market has rallied sharply over the last few weeks in anticipation of the Federal Reserve’s first rate cut since 2020. Interestingly, while the market rallied, several signs suggest investors’ “risk-taking” appetite is fading. As noted by Sentiment Trader on Wednesday:
“Momentum in stocks is back to being a compelling reason to stay invested. As we saw Monday, action like we’ve witnessed over the last two weeks has been a consistent precursor to further gains. That doesn’t mean everything agrees, and we’d be remiss, not to mention some of the dangers. It’s easy to pick a direction, play see-no-evil, and hope for the best. It’s much more difficult to weigh the evidence and adjust probabilities, hopefully resulting in a smoother ride over time.
In that vein, one curiosity that sticks out is the lack of risk appetite across markets. In stocks, optimism is objectively high (though not as extreme as it had been). It’s in other markets where the curiosity lies.“

What Sentiment Trader is referring to, in particular, is the rotation of the chase for equities from momentum stocks to defensive plays. Utilities, real estate, dividend stocks, bonds, and gold have all performed exceedingly well lately. However, those trades have been front-running the Federal Reserve rate cuts and are well ahead of any indication of an economic contraction. As shown, historically, Growth over Value, Small Caps, and Bonds rally the most FOLLOWING rate cuts. As noted above, downside risk may be building with already overbought markets.

Further analysis by Sentiment Trader showed that when such an environment has previously existed, stocks rising with falling risk appetite typically occurred close to a short-term market correction at best and a market peak at worst.

Negative Divergences Emerge
From a technical view, the market has rallied to the top of its long-term bullish trend and is trading 3 standard deviations above its 200-week moving average. Negative divergences in relative strength and momentum, combined with a significant deviation from the long-term mean, present investors with an intermediate-term risk.

As discussed in June, “These negative divergences have often preceded short- to intermediate-term corrective market actions. Could this time be different? Sure. The entire bet of the market remains mired in the Fed cutting rates. That narrative is still alive and well, at least on the surface. However, like walking across an ice pond, while you can hear the ice cracking beneath your feet, one is never sure exactly when it will give way.”
Furthermore, volatility has been rising in concert with high stock prices. That volatility pick-up is also a warning sign that the near-term upside may be limited.
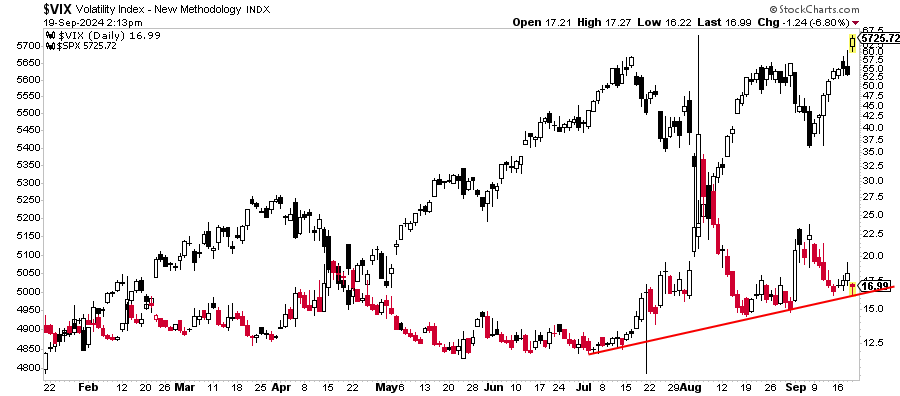
As Goldman Sachs recently noted:
“On average, over the past 30+ years, VIX has increased 6% from September to October, and we see upside risks to the current VIX levels given seasonality and upcoming macro/micro catalysts. Based on our seasonality of volatility study across regions, we have found a consistent pattern across major indexes of increased volatility from August to October.“

As noted, the market has a strong bullish bias and could rally in the short term. However, given the overbought conditions and investors’ excess optimism, the risk of a correction is not completely absent. As shown by investor allocations already at all-time highs, one has to ask exactly how many buyers are left to buy.

While the market is bullish on the Fed rate cuts, technically, it looks challenging for the markets to continue rallying from current levels. However, this does not mean they can’t; it also does not mean a more severe correction is imminent. It suggests that investors may need to be more prudent in their risks.
How We Are Trading It
The Federal Reserve’s rate cut this past week sent markets rallying to all-time highs, officially ending the correction that began in late July. With that correction process resolved, the next challenges will be the upcoming earnings season and the election in November.
With share buybacks heading into their “blackout period” over the next 45 days, removing a key buyer of equities could increase volatility in the short term. When paired with an already exuberant market, in terms of sentiment, the potential for disappointment increases.
In July, we recommended that profit-taking and rebalancing be prudent risk management processes with markets near all-time highs. That action proved useful heading into the August selloff. With that corrective process resolved, continue maintaining exposure to equities and use pullbacks to support adding exposure as needed.
While the long-term analysis certainly provides some levels of concern, the market’s short-term bullish backdrop requires a more optimistic stance. We continue to watch the data closely and allow our analysis to dictate our positioning. While this can sometimes counter “simple logic,” such is how markets can operate. Therefore, we continue to monitor our longer-term signals for important warning signs and trade the “market we have” in the short term.
Have a great week.
Research Report
Subscribe To “Before The Bell” For Daily Trading Updates
We have set up a separate channel JUST for our short daily market updates. Please subscribe to THIS CHANNEL to receive daily notifications before the market opens.
Click Here And Then Click The SUBSCRIBE Button
Subscribe To Our YouTube Channel To Get Notified Of All Our Videos
Bull Bear Report Market Statistics & Screens

SimpleVisor Top & Bottom Performers By Sector

S&P 500 Weekly Tear Sheet

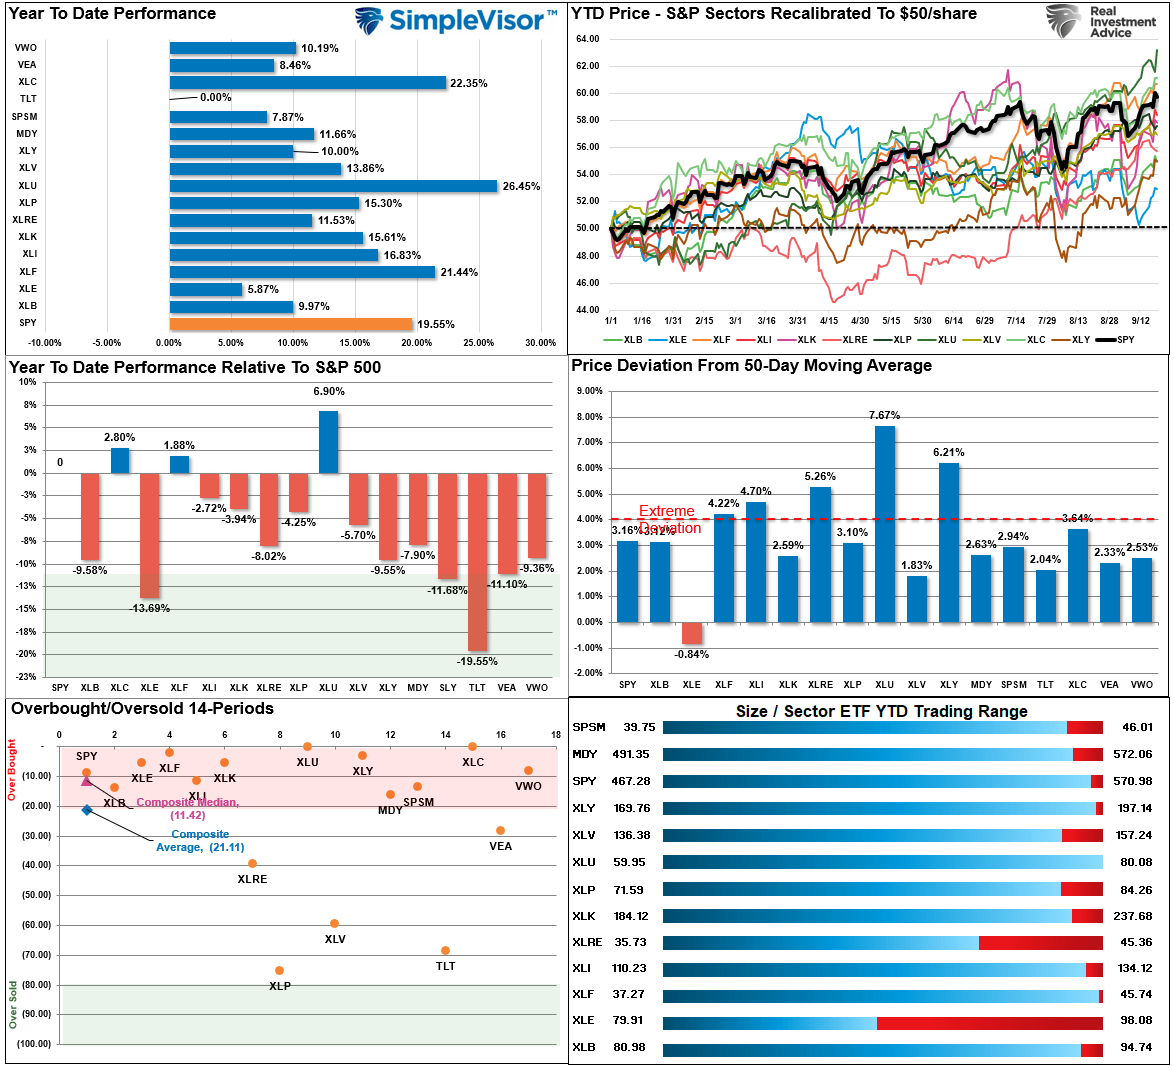
Relative Performance Analysis
We noted last week:
“That reflexive rally was extremely strong, with most sectors reversing their previous oversold conditions. The defensive sectors are extremely overbought, while Financials and Energy are oversold. The rally could continue this week, with the broad market challenging previous highs. However, with many sectors and markets returning to overbought conditions, the upside likely remains somewhat limited in the near term.”
That rally did continue this week, with the laggards playing catchup. Financials and Energy, Technology, Utilities, Communications, and Discretionary are overbought. Staples and Bonds are decently oversold. With the market up 20% year-to-date, I would not be surprised to see some consolidation or a small correction between today and the election. After the election, we could see a push towards 5900-6000 on the index to close out the year.
Technical Composite
The technical overbought/sold gauge comprises several price indicators (R.S.I., Williams %R, etc.), measured using “weekly” closing price data. Readings above “80” are considered overbought, and below “20” are oversold. The market peaks when those readings are 80 or above, suggesting prudent profit-taking and risk management. The best buying opportunities exist when those readings are 20 or below.
The current reading is 83.05 out of a possible 100.

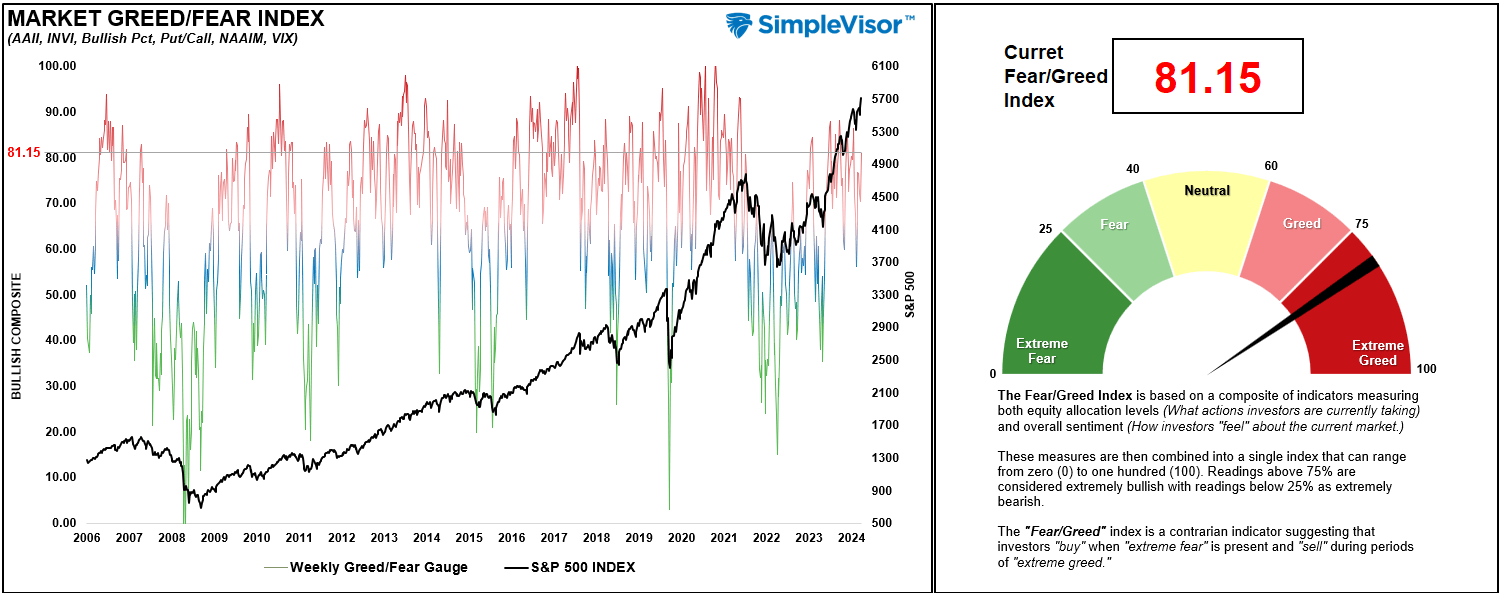
Portfolio Positioning “Fear / Greed” Gauge
The “Fear/Greed” gauge is how individual and professional investors are “positioning” themselves in the market based on their equity exposure. From a contrarian position, the higher the allocation to equities, the more likely the market is closer to a correction than not. The gauge uses weekly closing data.
NOTE: The Fear/Greed Index measures risk from 0 to 100. It is a rarity that it reaches levels above 90. The current reading is 81.15 out of a possible 100.
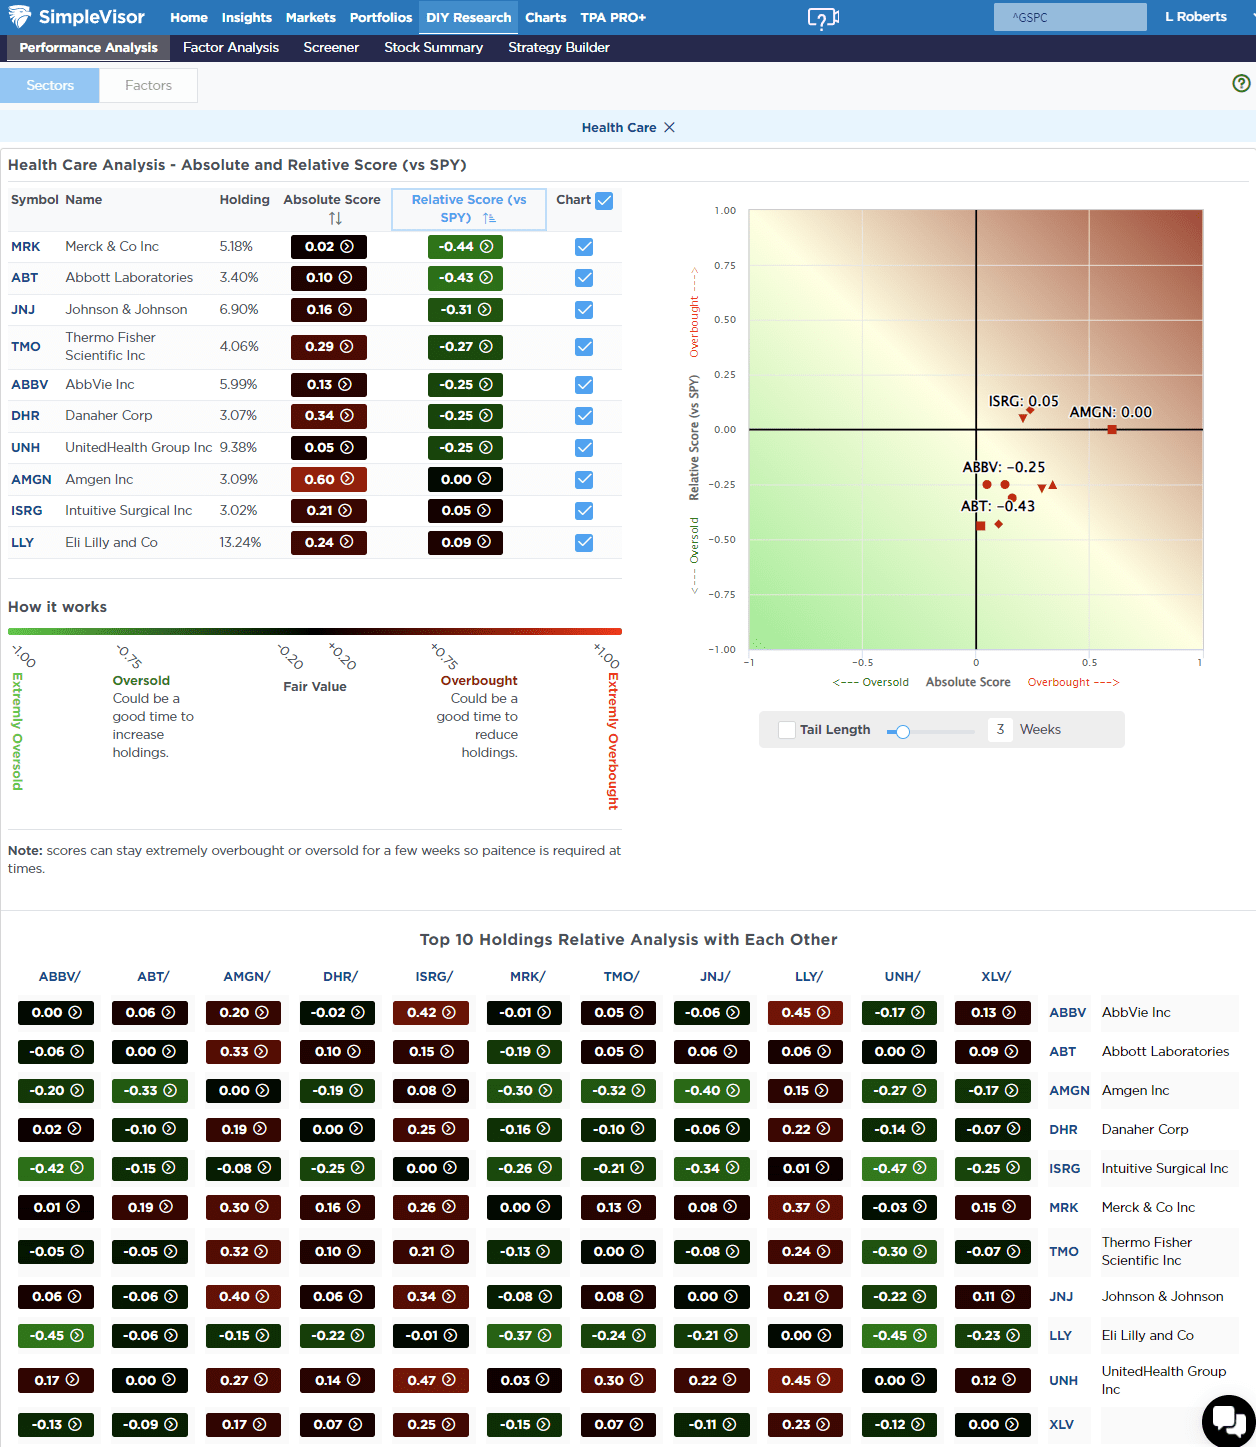
Relative Sector Analysis

Most Oversold Sector Analysis
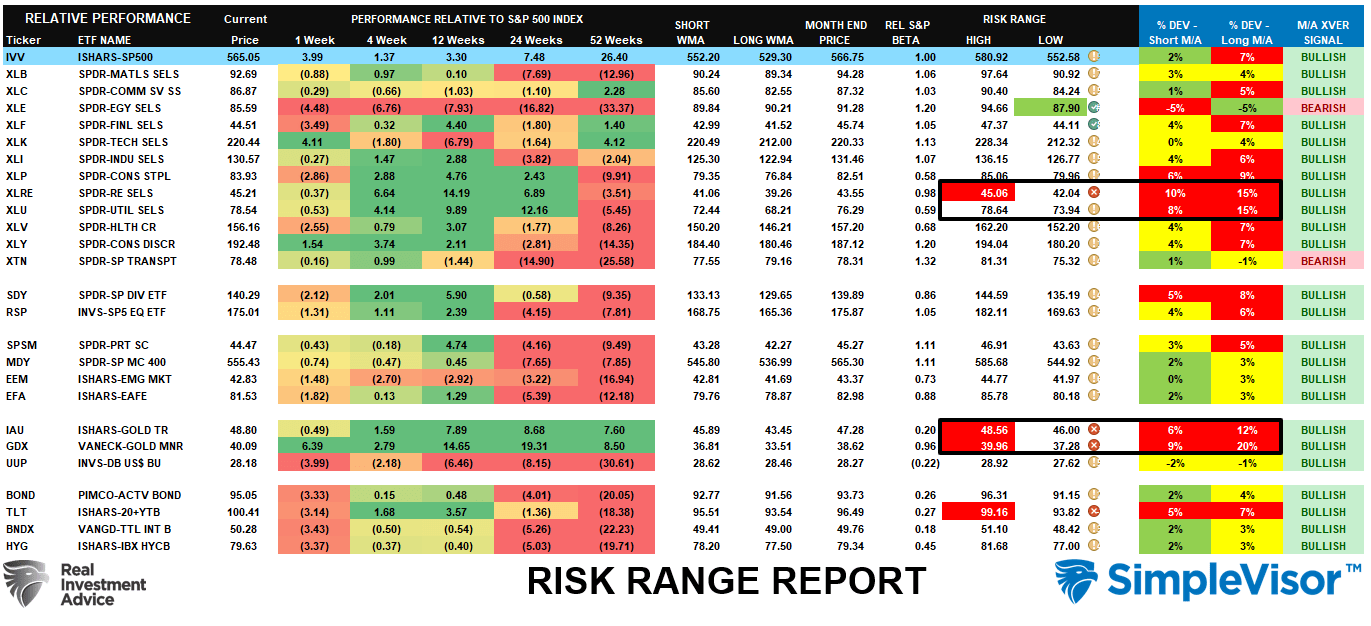
Sector Model Analysis & Risk Ranges
How To Read This Table
- The table compares the relative performance of each sector and market to the S&P 500 index.
- “MA XVER” (Moving Average Crossover) is determined by the short-term weekly moving average crossing positively or negatively with the long-term weekly moving average.
- The risk range is a function of the month-end closing price and the “beta” of the sector or market. (Ranges reset on the 1st of each month)
- The table shows the price deviation above and below the weekly moving averages.
The rally this past week was very strong as investors piled back into familiar trades that have worked well this year. Technology, Utilities, Real Estate, Gold, and Gold Miners are overbought, pushing double-digit deviations. Take profits in these sectors and rebalance accordingly, as they will pull back. On the other hand, energy is extremely oversold, and we are likely near a tradeable opportunity in that space. With almost all sectors on bullish crossovers, the bias is to the upside, so maintain equity exposure relative to your risk tolerance.
Weekly SimpleVisor Stock Screens
We provide three stock screens each week from SimpleVisor.
This week, we are searching for the Top 20:
- Relative Strength Stocks
- Momentum Stocks
- Fundamental & Technical Strength W/ Dividends
(Click Images To Enlarge)
RSI Screen

Momentum Screen

Fundamental & Technical Screen

SimpleVisor Portfolio Changes
We post all of our portfolio changes as they occur at SimpleVisor:
No Trades This Week
Lance Roberts, C.I.O.
Have a great week!

