
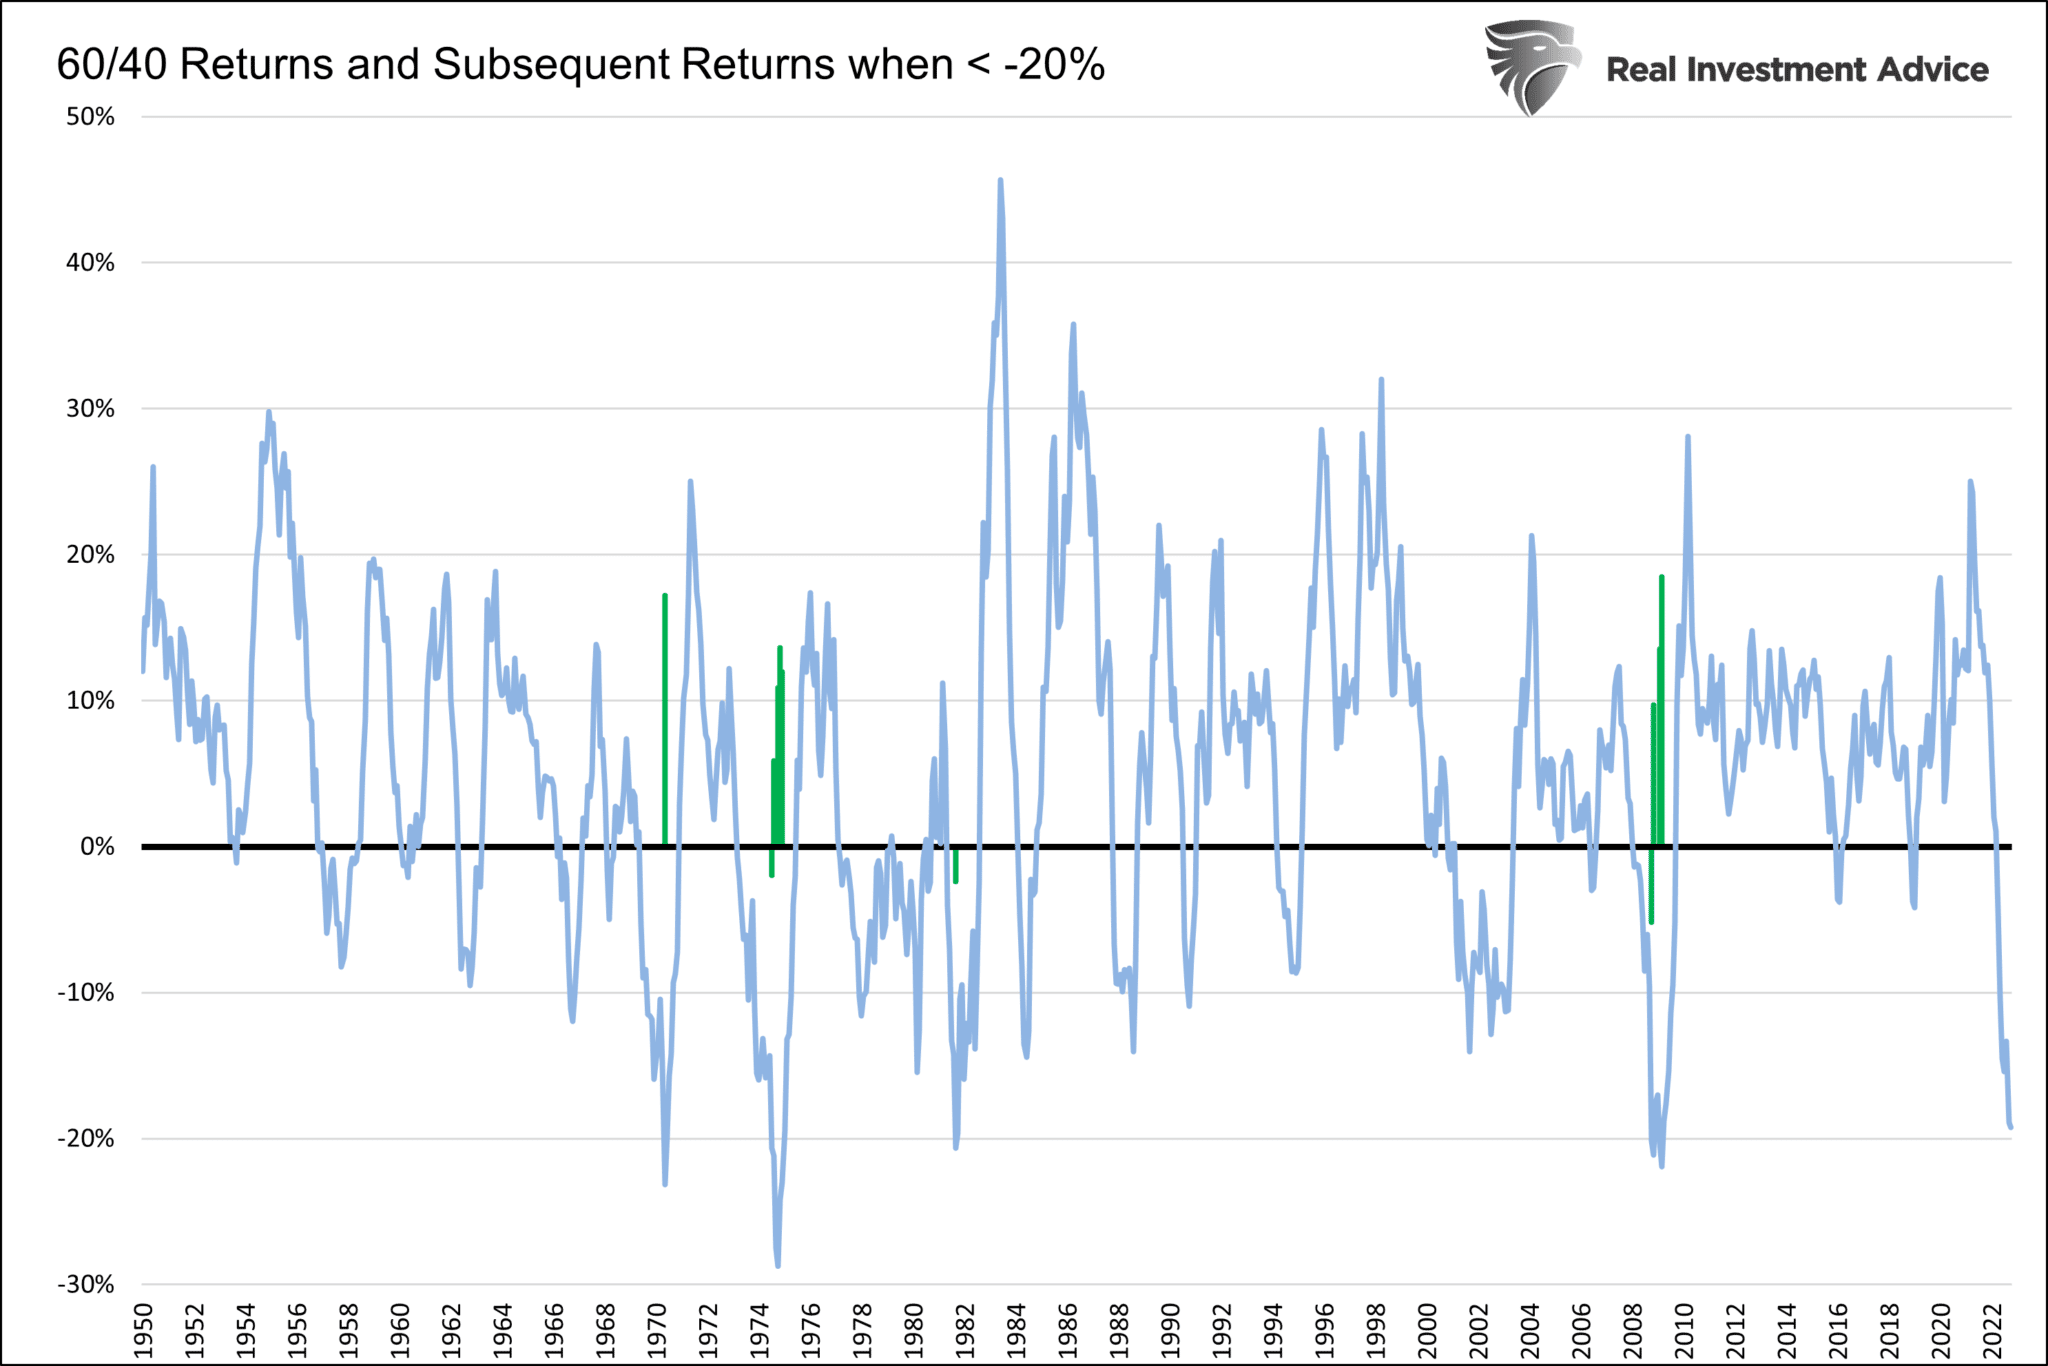
Since 1950 there have only been four other instances in which a balanced 60/40 stock/bond portfolio did as poorly as this year. Over the last 70 years, balanced portfolios averaged a 5.4% return, with over 70% of the monthly readings positive. The recent poor performance of balanced portfolios leads us to question what next year’s returns might be. The graph below shows annual returns by month for a balanced portfolio. In green, we show the subsequent 12-month returns for each instance where the balanced portfolio was down by 20% or more. Of the thirteen monthly times with greater than 20% declines, ten of the thirteen were followed by positive results. On average, a balanced portfolio was up nearly 8% in the following twelve months. Expanding the time horizon to two years, we find that returns for a balanced portfolio averaged 11%, and in all cases, they were positive.

What To Watch Today
Economy
- 8:30 a.m. ET: GDP Annualized, quarter-over-quarter, 3Q A (2.4% expected, -0.6% prior)
- 8:30 a.m. ET: Durable goods orders, September Preliminary (0.6% expected, -0.2% prior)
- 8:30 a.m. ET: Personal Consumption, quarter-over-quarter, 3Q A (1% expected, 2.0% prior)
- 8:30 a.m. ET: Durables excluding transportation, September Preliminary (0.2% expected, 0.3% prior)
- 8:30 a.m. ET: GDP Price Index, quarter-over-quarter, 3Q A (5.3% expected, 9.0% prior)
- 8:30 a.m. ET: Non-defense capital goods orders excluding aircraft, September Preliminary (0.2% expected, 0.3% prior)
- 8:30 a.m. ET: Core PCE, quarter-over-quarter, 3Q A (4.6% expected, 4.7% prior)
- 8:30 a.m. ET: Initial Jobless Claims, week ended Oct. 22 (225,000 expected, 214,000 prior)
- 8:30 a.m. ET: Continuing Claims, week ended Oct. 15 (1.385 million prior)
- 11:00 a.m. ET: Kansas City Manufacturing Index, October (-2 expected, 1 prior)
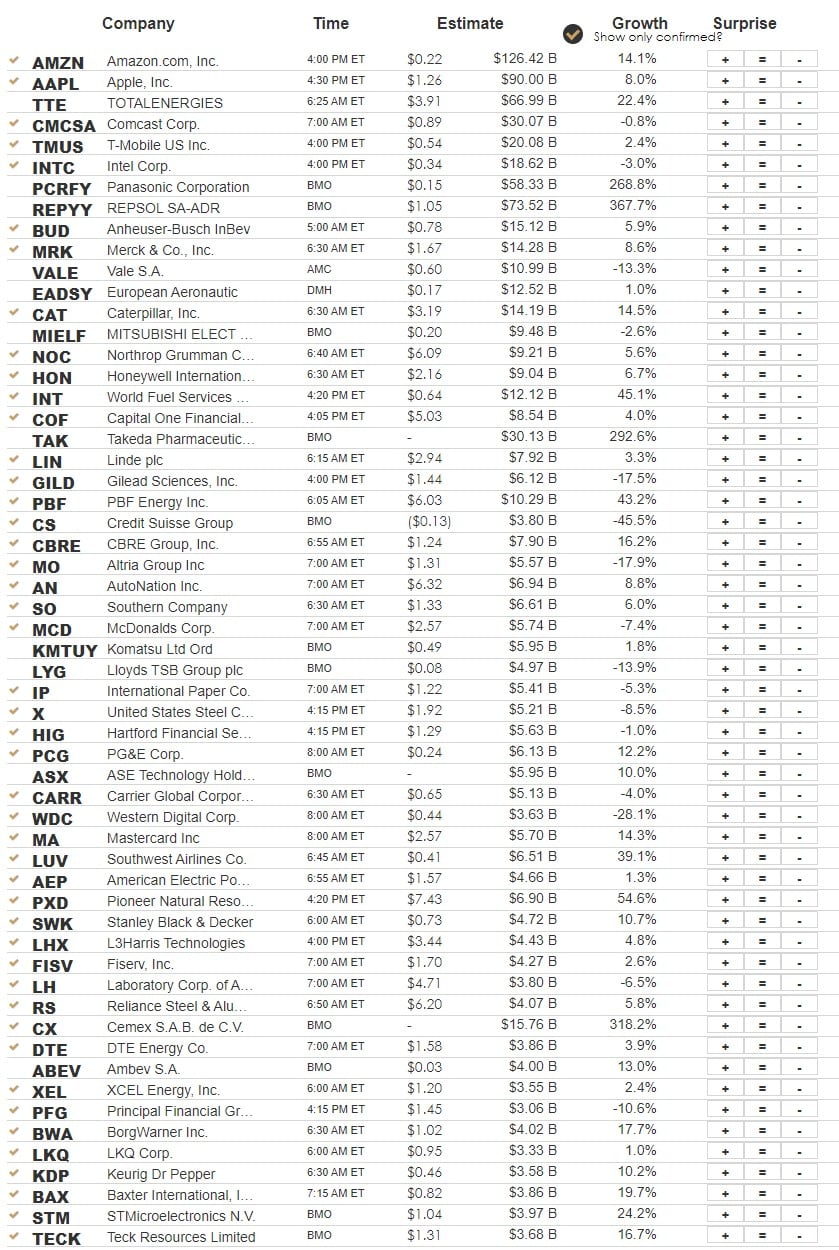
Earnings
Market Trading Update
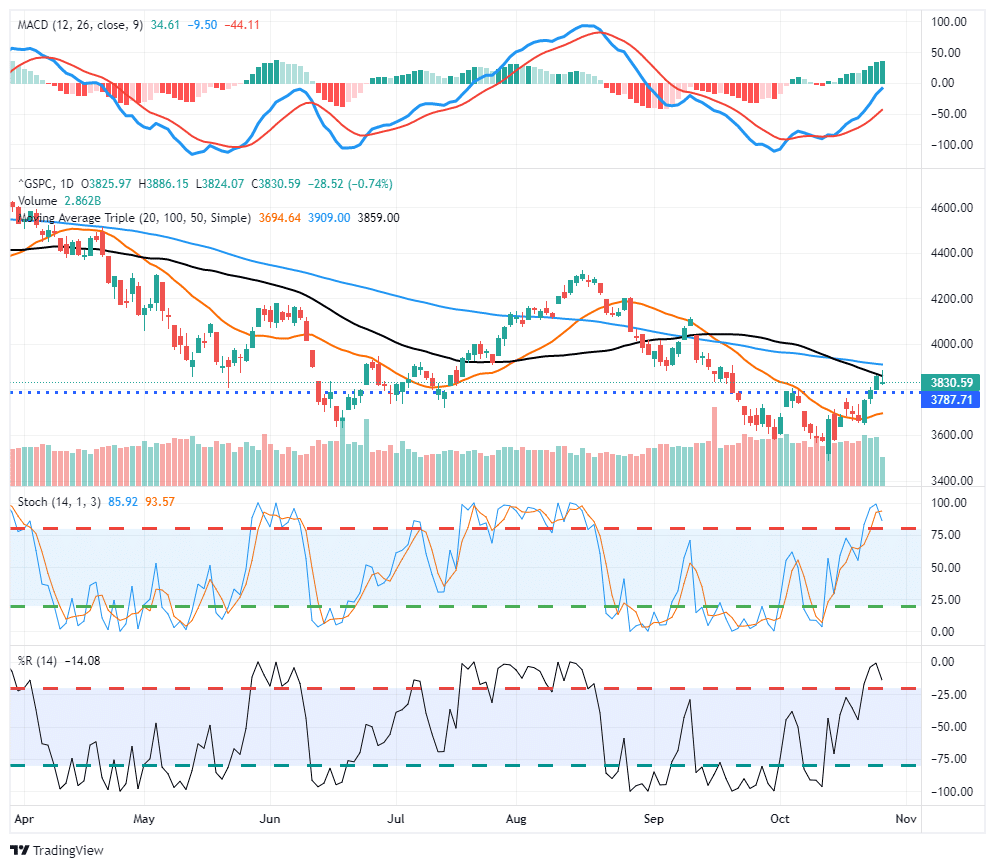
If it hadn’t been for the Megacap Technology names yesterday, the markets would have likely turned in a positive performance. However, such was not the case. The good news is that the rest of the market traded positively, and the S&P 500 did not violate the 3800 support level from Tuesday. However, while Facebook’s (META) earnings were disappointing, which was not surprising following Google’s report, we still have Apple (AAPL) and Amazon (AMZN) tomorrow. Those reports could weigh on technology shares further if the disappointment continues to run through these names. However, once the newsflow is complete, if the market can hold the 3800 support, a further rally is possible, particularly if the Fed shows some signs of reducing its aggressiveness next week.
Nonetheless, we still advise caution as this market is still tenuous at best, with many trapped longs looking for an exit. Trade carefully.
Big Stocks Getting Punished – Are We Close To The End
At the start of the year, we discussed how the Mega cap stocks were keeping the market afloat as the rest of the index was being pummeled by heavy selling. With many of those stocks exceptionally wrung out, the sellers have come for the “generals.” As Yahoo Finance noted this morning:
“Eight of the top 20 companies in the S&P 500 have lost more than $100 billion in market cap as of Wednesday — with Microsoft down $780 billion, Alphabet $650 billion, and Meta Platforms $555 billion. Nvidia, Apple, and Amazon have each lost more than $400 billion since the start of 2022.”
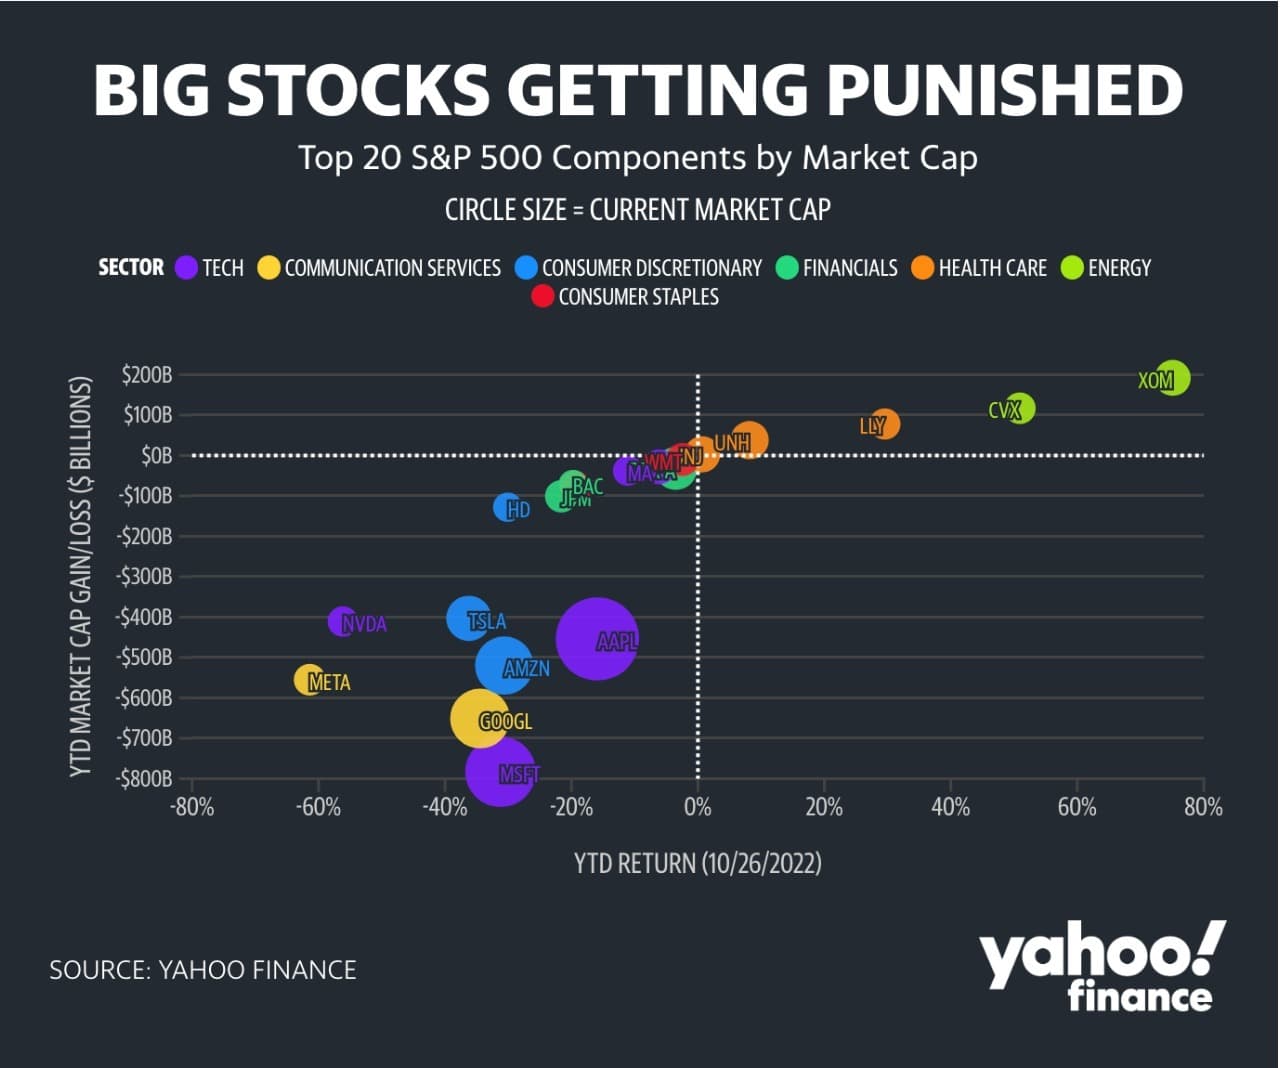
The good news is this also suggests we may be closer to the end of the bear market than not.
So Far, The Greatest October Ever for the Dow
It’s hard to believe, but if the Dow Jones Index finishes at current levels, it will be the best October in its history. The following commentary is courtesy of Ryan Detrick from the Carson Group.
The Dow is up 10.8% for the month, which would be the best October since Charlie Dow created the Dow in 1896. The other Octobers to gain 10%? 1982 and 2002. Both ended bear markets, and stocks had huge multi-year gains next.
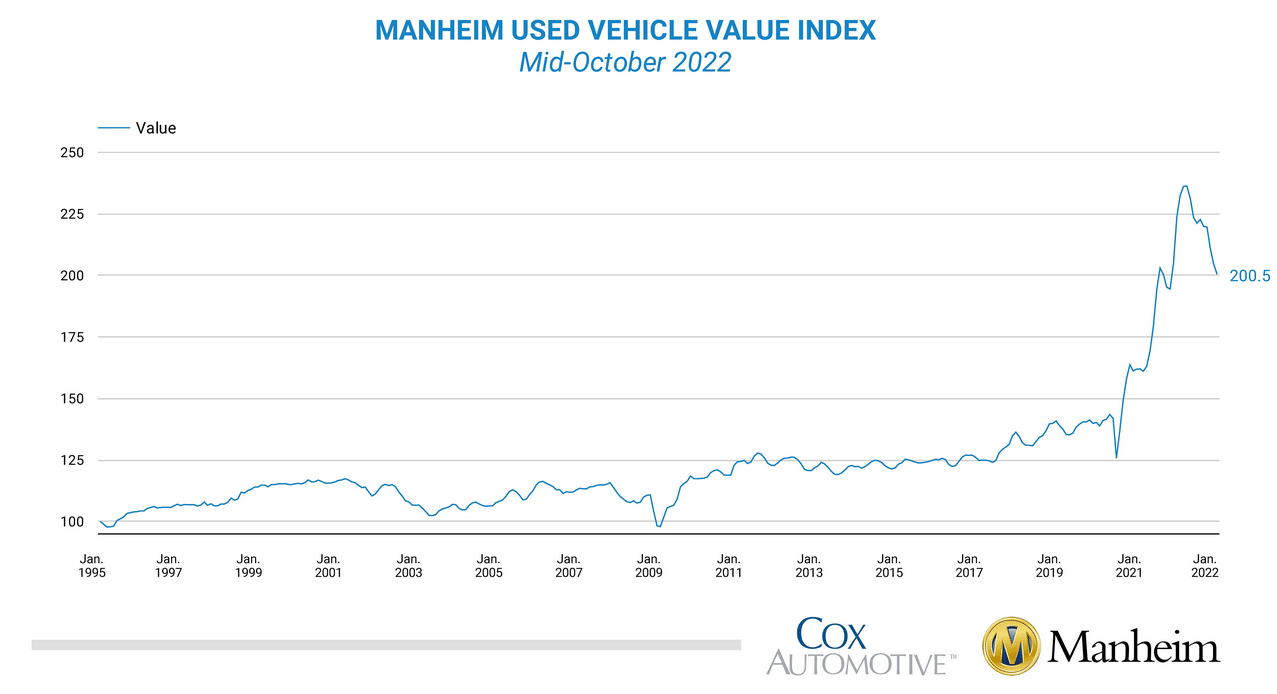
Car Prices are Unsustainable
We have shared a few charts over the last year showing how home prices as a percentage of income have risen well above historical norms. Not surprisingly, home prices are starting to drop rapidly. As we share below, auto prices are also well above traditional valuations. The first graph shows it now takes, on average, 42 weeks of income to purchase a vehicle. That is about 2.5 months more than it had been for the last ten years. The reason for that divergence is the sharp increase in used and new car prices with relatively smaller income increases.
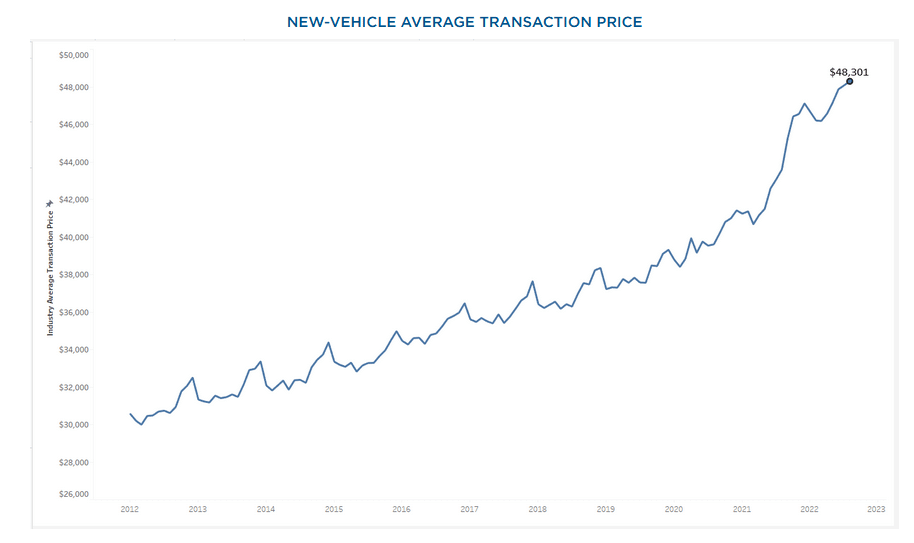
The second graph shows that used car prices are declining but still well above pre-pandemic norms. The third graph from Kelly Blue Book highlights that new car prices are about 15% to 20% above trend and have yet to fall. Given the dearth of new car supply over the last two years, it may take longer for new car prices to normalize. Assuming used car prices keep falling, cheaper used car alternatives should weigh on new car prices and sales.

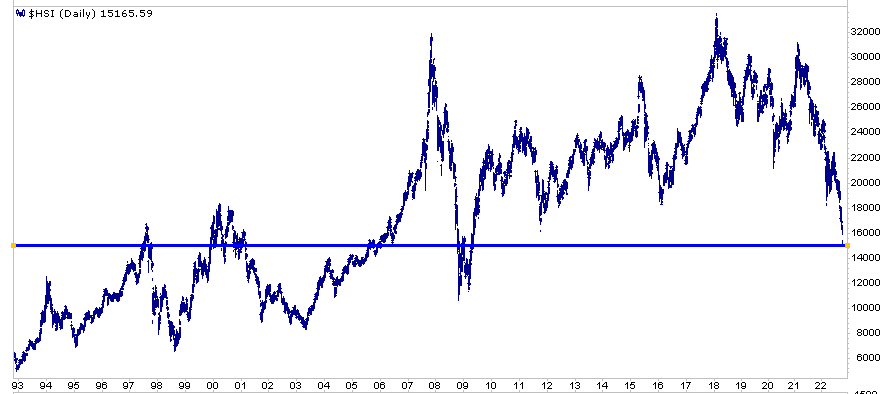
Value In China
If you are willing to overlook geopolitical risks, Hong Kong’s Hang Seng Index offers a lot of value. As the graph below shows, the index is now at the same level it was in the late 90s and early 2000s. In 1997, its P/E was at 20, Price to Sales at 10, and price to tangible book value at 3. Today its P/E is 6, and the price to sales and the price to book value are around 1.
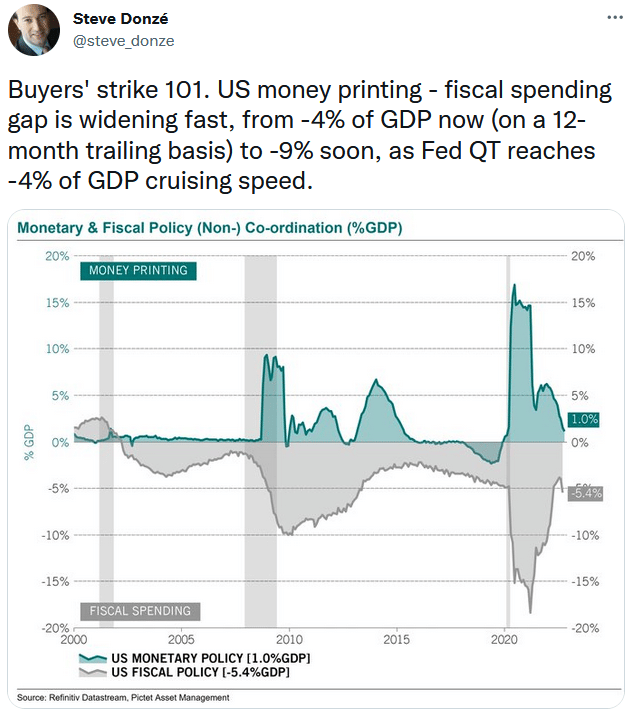
Tweet of the Day
Please subscribe to the daily commentary to receive these updates every morning before the opening bell.
If you found this blog useful, please send it to someone else, share it on social media, or contact us to set up a meeting.

