The VVIX and VIX Highlight Complacency
After a brief spurt of volatility accompanying the 6% market decline in April, implied volatility (VIX) and volatility of volatility (VVIX) have fallen back to multi-year lows. The lesser known volatitly gague VVIX is down to levels last seen ten years ago. VVIX measures the volatility of the VIX index. While they do correlate well, the VVIX is a slightly different measure. The VVIX formula is based on options trading on the VIX contract. The VVIX is telling us investors are not buying protection via calls on the VIX. The VIX is also at low levels but not ten-year lows.
Many analysts use volatility as a gauge of investor complacency. Both volatility measures shown below highlight that investors do not concern themlseves about a correction. At times, similar volatility levels have served as a warning to be prepared to take protective actions. However, while the VVIX and VIX are extremely low, many other technical indicators are not overbought. Further, the S&P just recently cleared its 20 and 50-day moving averages, so it’s not too extended from those key moving averages. The MACD is trending up but is far from being overbought. The market is very complacent, and we must stand guard. However, unlike the last time volatility was at current levels, other technical indicators are not yet providing affirmation of a coming downturn.

What To Watch Today
Earnings

Economy

Market Trading Update
Yesterday, our discussion centered on the recent breakout above the 50-DMA and the confirming bullish “buy signals” from the MACD. Of course, that is the very short-term analysis for the next few days to weeks. However, if we slow the price action down by looking at weekly data, we see that the market is again approaching more extreme overbought levels similar to those seen at the market’s peak in 2022.
As shown, the Relative Strength Index is rising and close to levels more normally associated with overbought markets. The deviation between the 13- and 34-week moving average is becoming more extreme, with the market trading nearly 9% above the longer-term mean. Lastly, the MACD signal, bottom panel, is on a buy signal, suggesting higher prices in the near term. However, that indicator pushes levels we have not seen historically outside of the stimulus-fueled buying frenzy following the pandemic.

Crucially, given this is weekly data, the more overbought conditions can last much longer than logic would predict. However, the data suggests that at some point later this year, we are still likely to see a larger corrective process (~10%) to reverse some of these conditions.

Consumer Discretionary Stocks Weaken
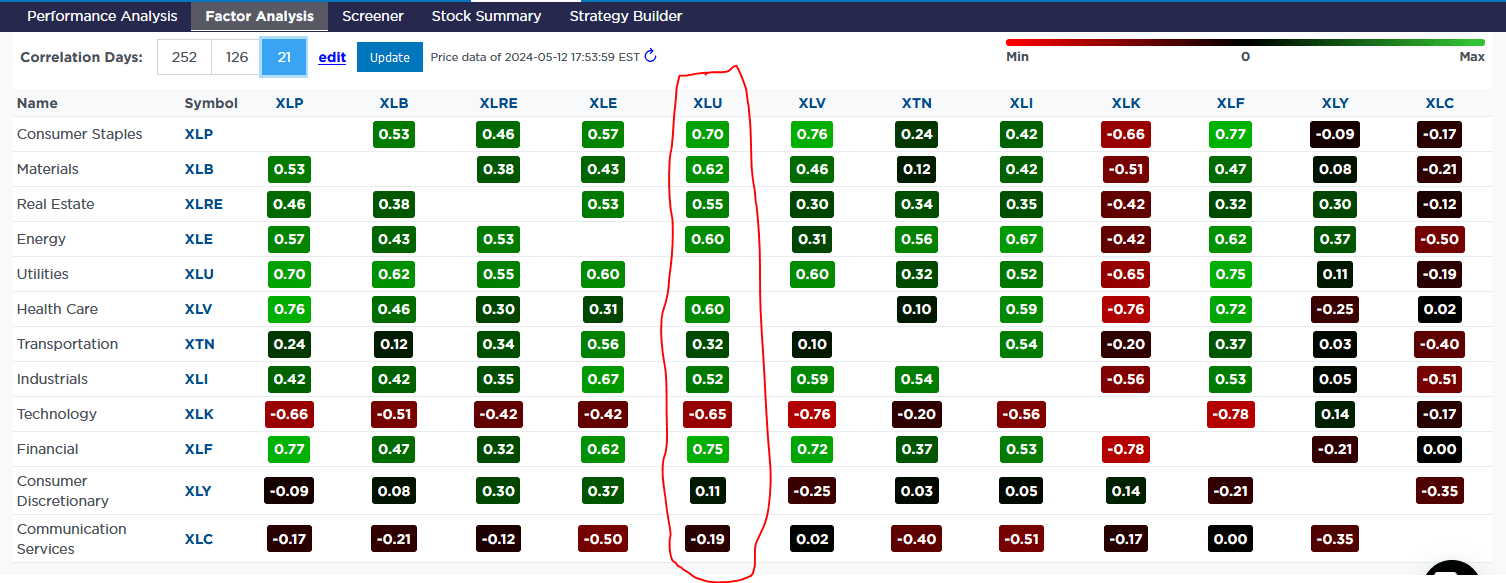
As the SimpleVisor analysis shows below, utilities continue to lead the market. Interestingly, the S&P 500 was up almost 1.50% this past week, making this past week’s instance a little more unique compared to the prior weeks’ outperformance. One of our questions regarding the strength of utilities was whether it was a safety play in a down market or a true sign that the sector could continue to lead in an up or down market. The rotation is overbought in the short term, but our analysis portends it may last longer. Further helping the sector is the realization that AI data centers will need a tremendous amount of investment into the utilities sector.
The second table shows that utilities are becoming very overbought on a relative basis and extremely overbought on an absolute basis. The third graph also shows its correlation to other sectors. If you are considering taking some profits, the table may give you some ideas on what to do with the proceeds.
The consumer discretionary sector is now the most oversold sector. Tesla, accounting for 12% of the sector and in a bear market, is partially responsible. However, other discretionary stocks have also had trouble recently. If you recall, Starbucks was down nearly 20% a week or so ago. There are some indications the consumer may be weakening. Retail Sales data on Wednesday will help better assess personal consumption.


Inflation Expectations
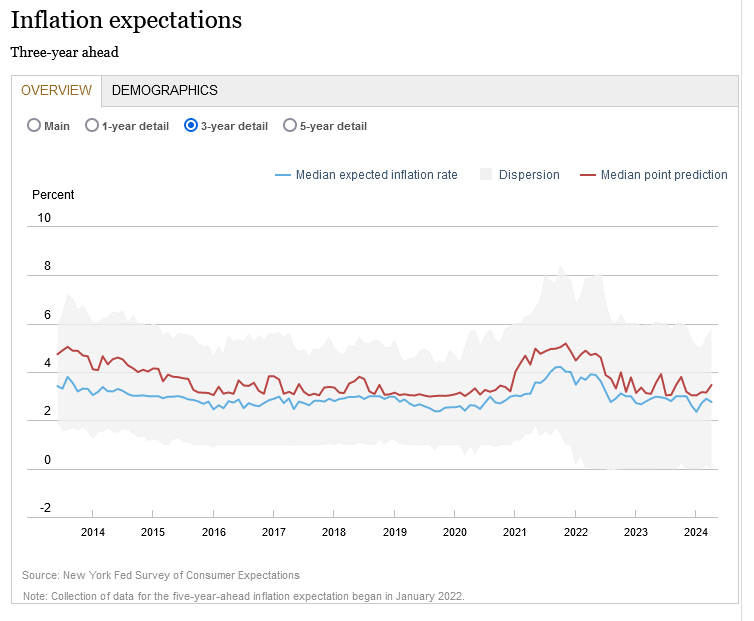
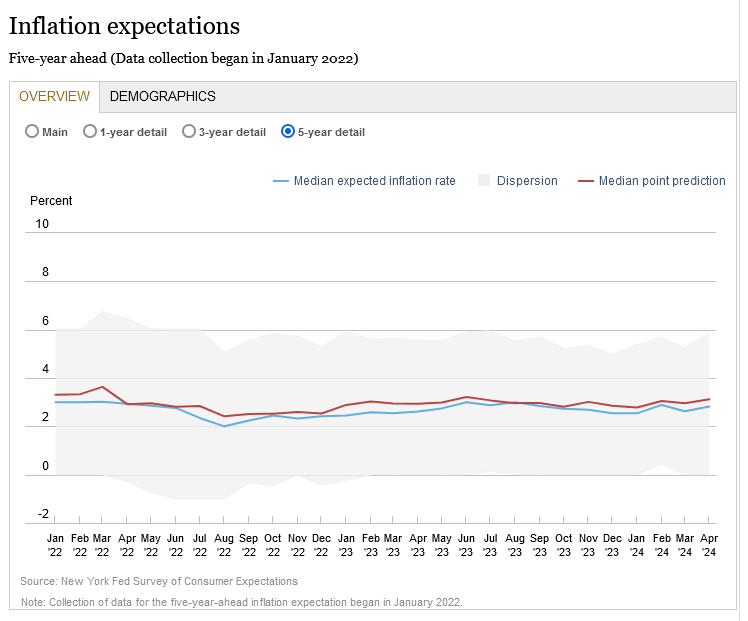
Yesterday, the New York Fed said three-year inflation expectations fell from 2.9% to 2.8%, but five-year expectations rose from 2.6% to 2.8%. Inflation expectations tend to run higher than actual inflation, as shown in the 3-year expectations graph below. Currently, 3-year expectations are very close to pre-pandemic levels. There is not enough data on five-year expectations to make a comparison. One-year expectations (not shown) are at 3.1%, a few tenths of a percent above pre-pandemic levels.
The Fed pays close attention to expectations, as they can be a self-fulfilling prophecy. Given that they are not surging higher, as some investors fear, we see nothing in this latest round of inflation expectations data to worry the Fed.
Tweet of the Day

“Want to achieve better long-term success in managing your portfolio? Here are our 15-trading rules for managing market risks.”
Please subscribe to the daily commentary to receive these updates every morning before the opening bell.
If you found this blog useful, please send it to someone else, share it on social media, or contact us to set up a meeting.


