
S&P 500 – A Bullish And Bearish Analysis
The S&P 500 index is a critical benchmark for the U.S. equity market, and its performance often dictates investor sentiment and decision-making. Between November 1, 2022, and September 6, 2024, the S&P 500 experienced a significant rally but not without […]

Technological Advances Make Things Better – Or Does It?
It certainly seems that technological advances make our lives better. Instead of writing a letter, stamping it, and mailing it (which was vastly more personal), we now send emails. Rather than driving to a local retailer or manufacturer, we order […]

Risks Facing Bullish Investors As September Begins
Since the end of the “Yen Carry Trade” correction in August, bullish positioning has returned with a vengeance, yet two key risks face investors as September begins. While bullish positioning and optimism are ingredients for a rising market, there is […]

Japanese Style Policies And The Future Of America
In a recent discussion with Adam Taggart via Thoughtful Money, we quickly touched on the similarities between the U.S. and Japanese monetary policies around the 11-minute mark. However, that discussion warrants a deeper dive. As we will review, Japan has […]

Red Flags In The Latest Retail Sales Report
The latest retail sales report seems to have given Wall Street something to cheer about. Headlines touting resilience in consumer spending increased hopes of a “soft landing” boosting the stock market. However, as is often the case, the devil is […]
Major Market Buy/Sell Review: 04-27-20
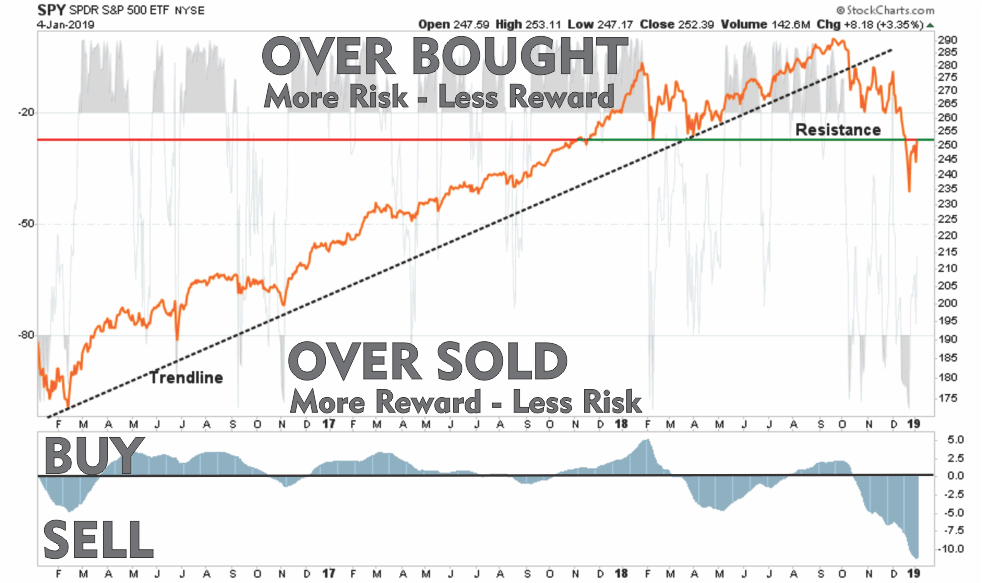
HOW TO READ THE CHARTS There are three primary components to each chart: The price chart is in orange The Over Bought/Over Sold indicator is in gray The Buy / Sell indicator is in blue. When the gray indicator is […]
Major Market Buy/Sell Review: 04-20-20
HOW TO READ THE CHARTS There are three primary components to each chart: The price chart is in orange The Over Bought/Over Sold indicator is in gray The Buy / Sell indicator is in blue. When the gray indicator is […]

10 Planning Rules that Drive Financial Success
Are You A “Basement” Thinker? Too often, we tend to focus on individual stocks and other investments that will hopefully lead to wealth. While that is O.K., it isn’t enough. The issue is investing without a sound “plan” is the […]
Major Market Buy/Sell Review: 04-13-20
HOW TO READ THE CHARTS There are three primary components to each chart: The price chart is in orange The Over Bought/Over Sold indicator is in gray The Buy / Sell indicator is in blue. When the gray indicator is […]