
- This Is Nuts
- Portfolio Position Review
- MacroView: Has The Fed Trapped Itself?
- Financial Planning Corner: By The Numbers For 2020
- Sector & Market Analysis
- 401k Plan Manager
Follow Us On: Twitter, Facebook, Linked-In, Sound Cloud, Seeking Alpha

Catch Up On What You Missed Last Week

Market Review & Update
When you sit down with your portfolio management team, and the first comment made is “this is nuts,” it’s probably time to think about your overall portfolio risk. On Friday, that was how the investment committee both started and ended – “this is nuts.”
We have been discussing the overbought, extended, and complacent market over the last couple of weeks, but on Friday, I tweeted out a couple of charts that illustrated the excess.
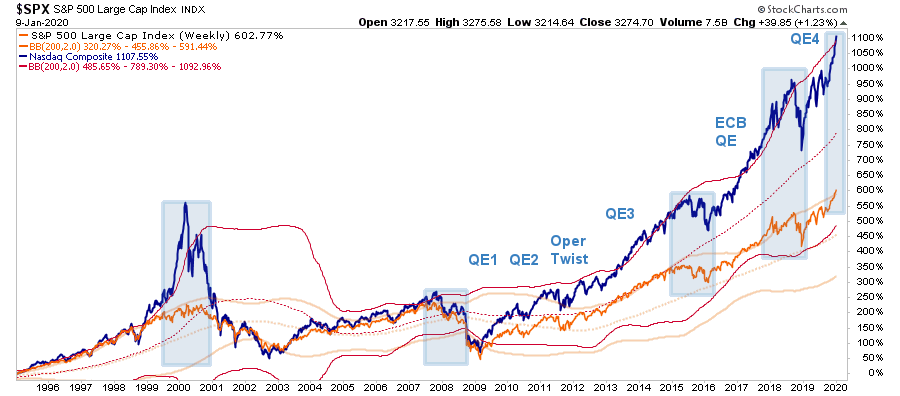
The first chart was comparing the Nasdaq to the S&P 500 index. Both are banded by 2-standard deviations bands of the 200-WEEK moving average. there are a couple of things which should jump out immediately:
- The near-vertical price acceleration in the markets has been a historical hallmark of late-stage cycle advances, also known as a “melt up” phase.
- When markets get more than 2-standard deviations above their long-term moving average, reversions to the mean have tended to follow shortly after that.

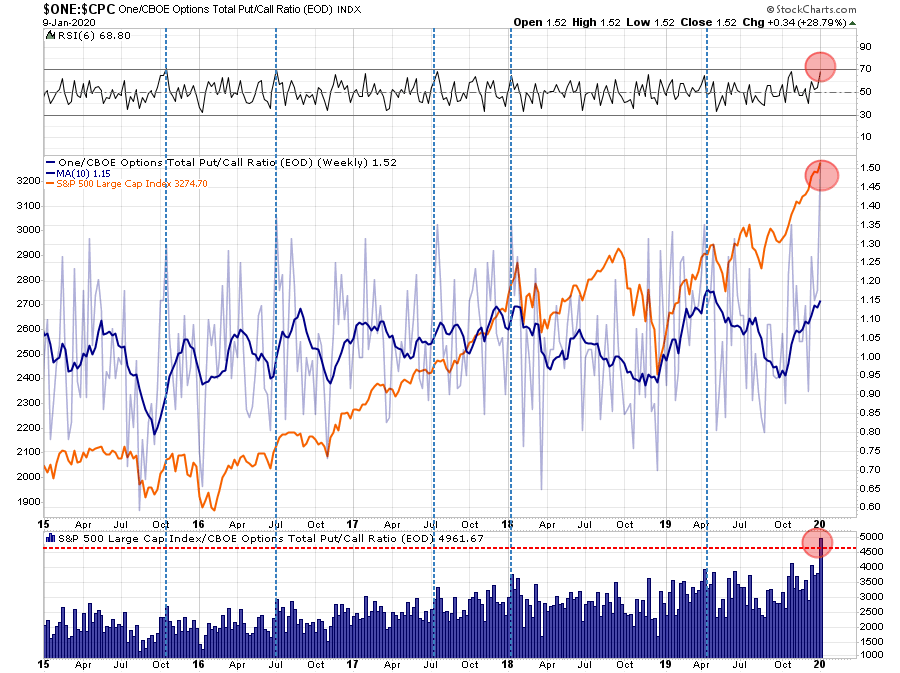
Currently, both of those conditions exist in the chart above. However, if it were only price acceleration, we would just be mildly concerned. However, investor complacency has also reached more extreme levels with PUT/CALL ratio now hitting historically high levels. (The put/call ratio is the ratio of “put options” being bought on the S&P 500 (theoretically to hedge risk) versus the number of “call” options purchased to “lever up” risk.)
Lastly, all of our indicators from momentum to relative strength are all suggesting risk substantially outweighs reward currently.
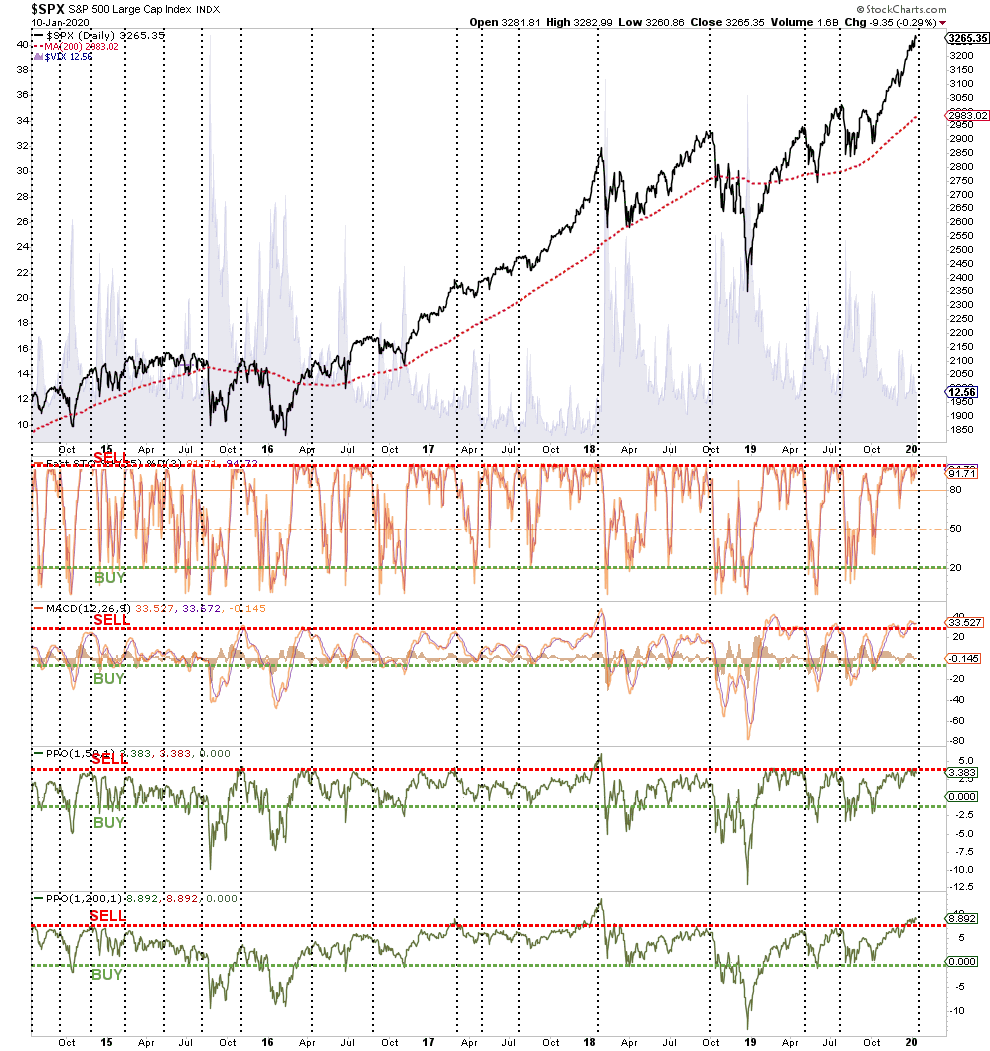
While none of this means the market will “crash,” it does suggest the risk/reward ratio is not in favor of the bulls short-term.
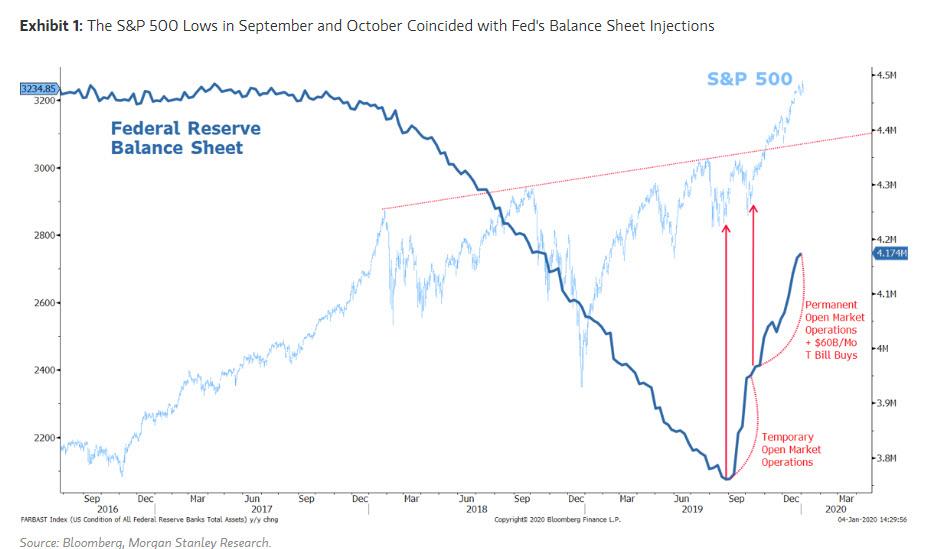
However, we are mindful that in the short-term, the market is currently obsessed with the Fed’s monetary interventions (the topic of this week’s MacroView), which are supportive of the markets currently. However, as my friend and colleague Doug Kass summed noted this week:
“It is growing increasingly clear to me that global stock markets are in the process of making a speculative move (driven by global liquidity) that may even compare to the advances that culminated in the seminal market tops in the Fall of 1987 and in the Spring of 2000.
As today’s trading day comes to a close, it is apparent that, like the 1997 Long Boom paradigm expressed in a column in Wired Magazine during the dot.com bubble –– the current market is similarly viewed as in its own, new liquidity-based paradigm.
No longer is the market hostage to the real economy or sales and profit growth – stuff I have spent four decades analyzing. Instead, liquidity is seen as an overriding influence, actually it has become the sine quo non.
As such, historical valuations become increasingly irrelevant, and price momentum is the lodestar.“
He is right.
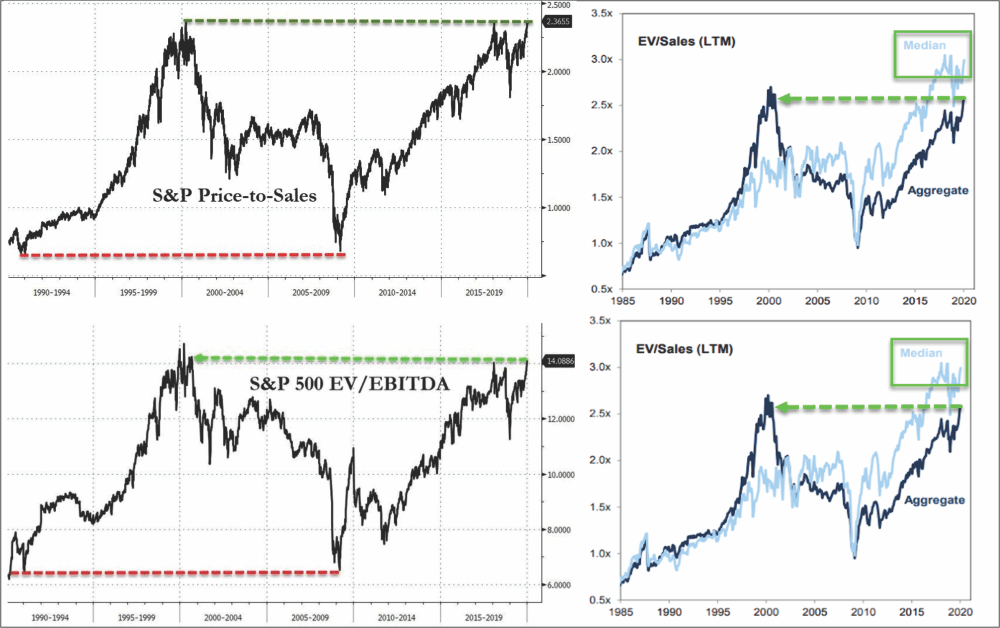
Currently, almost every single valuation metric is at historic extremes, yet investors continue to take on increasing levels of risk due to nothing more than “F.O.M.O – Fear Of Missing Out.”
As Doug goes on to note:
“We live in unusual times – in which central bankers have adopted policy unlike any point in history. Near-zero interest rates around the world have become commonplace and are accepted with little thought given to the adverse consequences. Forgetting history, central bankers seem to have no idea that they have created another monster again – just as they did in 1999.
Meanwhile, corporate profits are lower (year over year), and the rate of global GDP growth remains below the historic trendline – as it takes more and more debt to deliver a unit of production.
The climb in stocks will likely end badly as it is not supported by the fundamental (social, economic, political and geopolitical) backdrop and, increasingly, classical valuation metrics have moved to the highest percentiles in history (enterprise value/EBIT, price to sales, market capitalizations to GDP, etc.)
Yes, “this is nuts,” which is why we took profits out of portfolios on Friday.

Portfolio Positioning
On Friday, we began the orderly process of reducing exposure in our portfolios to take in profits, reduce portfolio risk, and raise cash levels.
In the Equity Portfolios, we reduced our weightings in some of our more extended holdings such as Apple (AAPL,) Microsoft (MSFT), United Healthcare (UNH), Johnson & Johnson (JNJ), and Micron (MU.)
In the ETF Sector Rotation Portfolio, we reduced our overweight positions in Technology (XLK), Healthcare (XLV), Mortgage Real Estate (REM), Communications (XLC), Discretionary (XLY) back to portfolio weightings for now.
The Dynamic Portfolio was allocated to a market neutral position by shorting the S&P index itself.
Let me state clearly, we did not “sell everything” and go to cash. We simply reduced our holdings to raise cash, and capture some of the gains we made in 2019. When the market corrects we will use our cash holdings to either add back to our current positions, or add new ones.
One of the areas we have been discussing recently is the opportunity that may be presenting itself in the Energy sector. With oil prices rising, and valuations better than other areas of the market, there are some trading opportunities starting to appear.
While our portfolios are designed to have longer-term holding periods, we understand that things do not always go as planned. This is why we enter positions on a trading basis only, which are short-term until both the position, and the overall thesis, starts to mature.
Last week, we presented some technical analysis on three major energy ETF’s and seven individual companies which may be presenting a trading opportunity in the near future. You can view all of our portfolio models, which are live accounts, at RIA PRO. (Try the service for 30-days RISK FREE)
But from a broad perspective, the Energy sector is showing some signs of life. The break above the 200-dma, as well as the downtrend from previous highs, gives the sector a much more bullish tone currently. However, there are still many issues that overhang the energy market in the longer-term from cash flows, to leverage, to economic demand, which will likely keep energy markets fairly range-bound through 2020 and beyond.

The complete analysis we presented to RIAPRO clients last week is presented here.

3300 To 3500, And Back Again
In July of 2019, we laid out our prognostication the S&P 500 could reach 3300 amid a market melt-up though the end of the year. On Friday, the market touched 3280, which, as they say, is “close enough for Jazz.”
However, with the Federal Reserve having “turned on the liquidity taps,” it is entirely possible the markets could continue their upward momentum towards 3500.
The potential “fly in the ointment” is if the economic, employment, and profit data fail to recover as anticipated. With 2020 earnings estimates already cut markedly heading into the year, further downward revisions will likely begin to weigh on investor sentiment.
Friday’s employment report was weak and exposed the anomaly caused by the autoworkers strike in the blockbuster November report. CEO and CFO confidence remain very suppressed currently, and if their views don’t start to improve markedly in the short-term we are likely to start seeing much weaker employment reports.
While the markets could certainly see a push higher in the short-term from the Fed’s ongoing liquidity injections, the gains for 2020 could very well be front-loaded for investors.
Taking profits and reducing risks now may lead to a short-term underperformance in portfolios, but you will likely appreciate the reduced volatility if, and when, the current optimism fades.

The Macro View

If you need help or have questions, we are always glad to help. Just email me.
See You Next Week
By Lance Roberts, CIO
Financial Planning Corner
REGISTER NOW for our most popular workshop: THE RIGHT LANE RETIREMENT CLASS
- The Westin, Austin at the Domain- 11301 Domain Drive, Austin, TX 78758
- February 8th from 9-11am.

You’ll be hearing more about more specific strategies to diversify soon, but don’t hesitate to give me any suggestions or questions.
by Danny Ratliff, CFP®, ChFC®
Market & Sector Analysis
Data Analysis Of The Market & Sectors For Traders
S&P 500 Tear Sheet

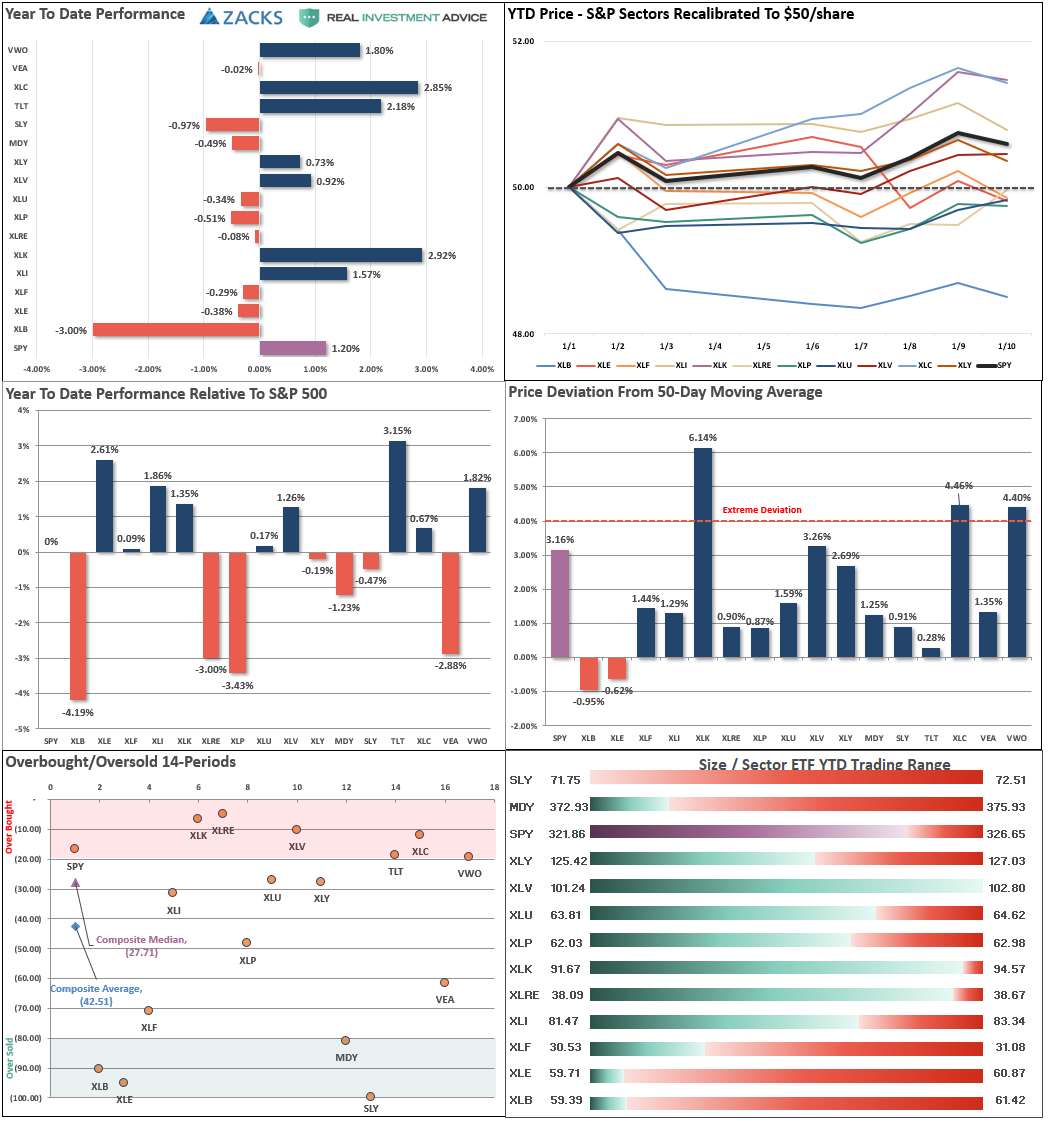
Performance Analysis
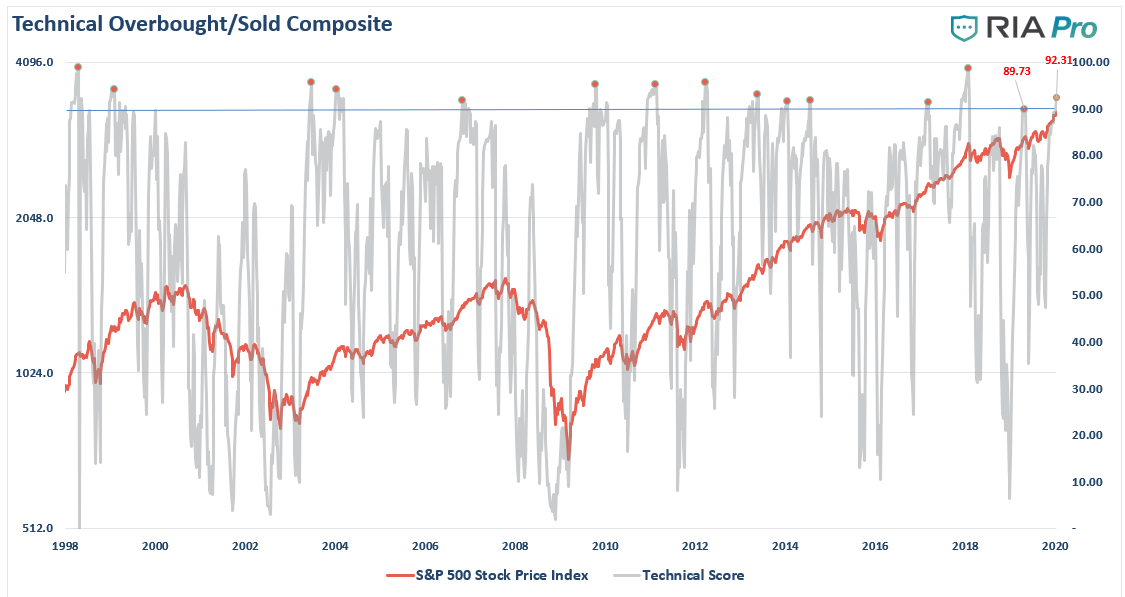
Technical Composite 
ETF Model Relative Performance Analysis
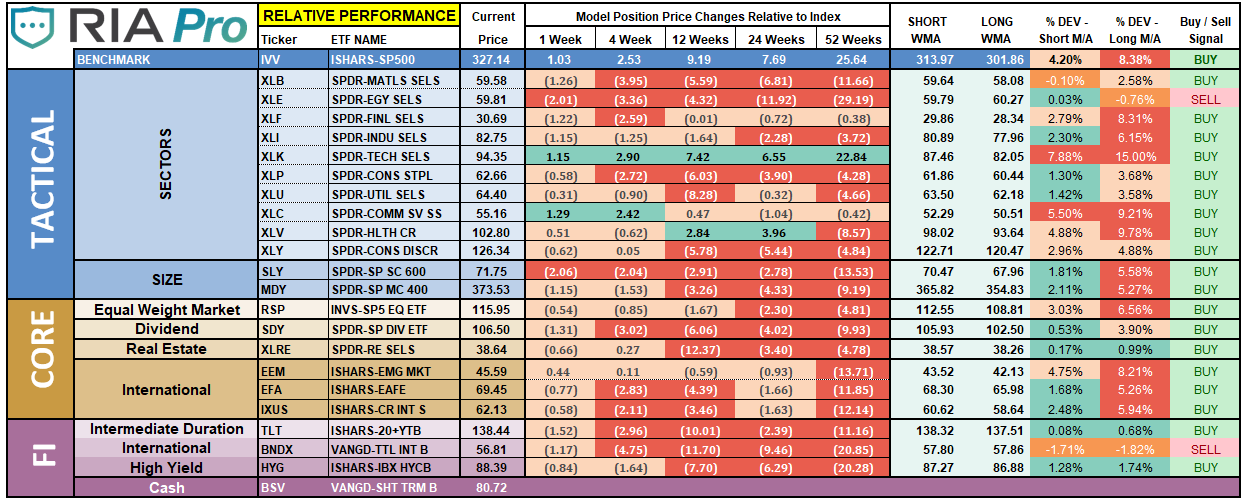
Sector & Market Analysis:
Be sure and catch our updates on Major Markets (Monday) and Major Sectors (Tuesday) with updated buy/stop/sell levels
Sector-by-Sector
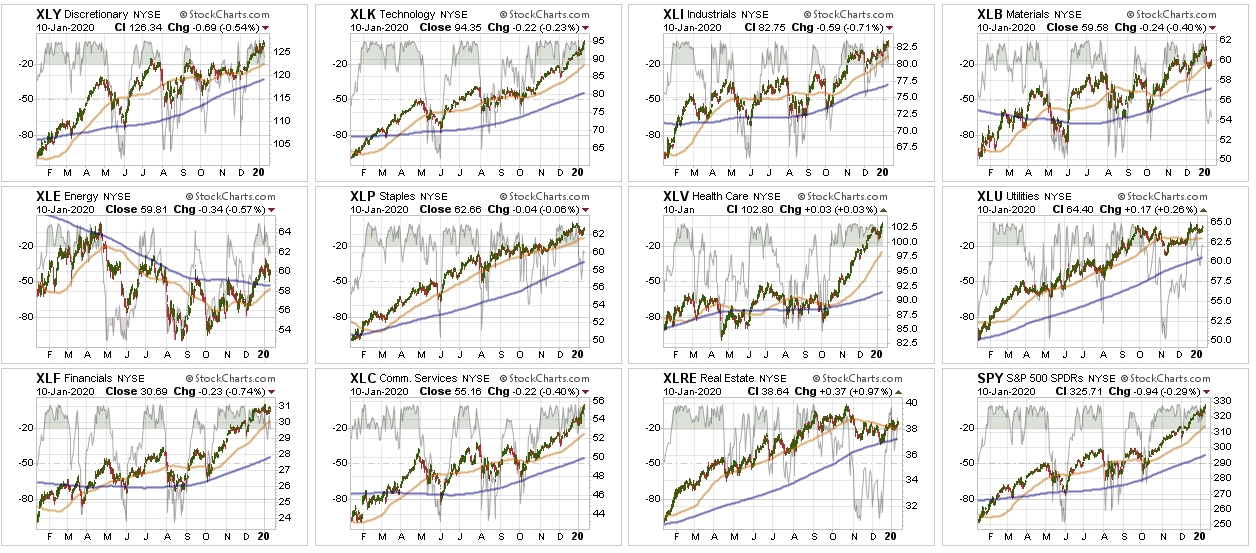
Improving – Energy (XLE), Communications (XLC)
The improvement in Energy stalled this past week as the Iran hostilities came and went literally in a matter of hours. While the sector has cleared the downtrend channel and the 200-dma it remains overbought short-term, but is beginning to correct that condition. We are looking for an entry point near the 200-dma if it holds.
As recommended last week, we reduced our weighting in XLC slightly on Friday just to take in some profits. Our thesis of a push in the sector due to the holiday shopping season came to fruition, but now the entire sector is just extremely extended.
Current Positions: 1/2 weight AMLP, Underweight XLC
Outperforming – Technology (XLK), Healthcare (XLV), Financials (XLF)
We noted previously that Financials have been running hard on Fed rate cuts and more QE and that the sector was extremely overbought and due for a correction. That correction/consolidation started last week and continued this week. We recommended taking profits previously, and that remains good advice again this week with the sector still very overbought.
We also recommended last week to take profits in Technology and Healthcare, which have not only been leading the market but have gotten extremely overbought. On Friday, we took profits in both sectors and reduced our weights back to target portfolio weight.
Current Positions: Reduced from overweight to target weight XLK, XLV
Weakening – Industrials (XLI)
Industrials, which perform better when the Fed is active with QE, has broken out to new highs, but is still consolidating at a high level and has begin to underperform on a relative basis to the S&P 500. Given the sector is extremely overbought, we will wait for this correction to play out before adding to our current position.
Current Position: 1/2 weight XLI
Lagging – Real Estate (XLRE), Staples (XLP), Discretionary (XLY), Materials (XLB), and Utilities (XLU)
After a run to new highs, Staples continues to consolidate and hold above its 50-dma. Since taking profits previously, we are just maintaining our stop loss on the sector currently.
Discretionary, after finally breaking out to new highs, has gotten very extended in the short-term. We reduced our position slightly to take in profits. We remain optimistic on the sector for now. However, the sector is extremely overbought so a correction is needed that doesn’t violate support at the 50-dma to add back to our exposure.
XLRE has been weak as of late as interest rates have been on the rise. We remain weighted in the sector for now but may increasing sizing opportunistically if we see weakness begin to form in the leading sectors of the market.
Current Position: Target weight XLY, XLP, XLRE, 1/2 weight XLB
Market By Market
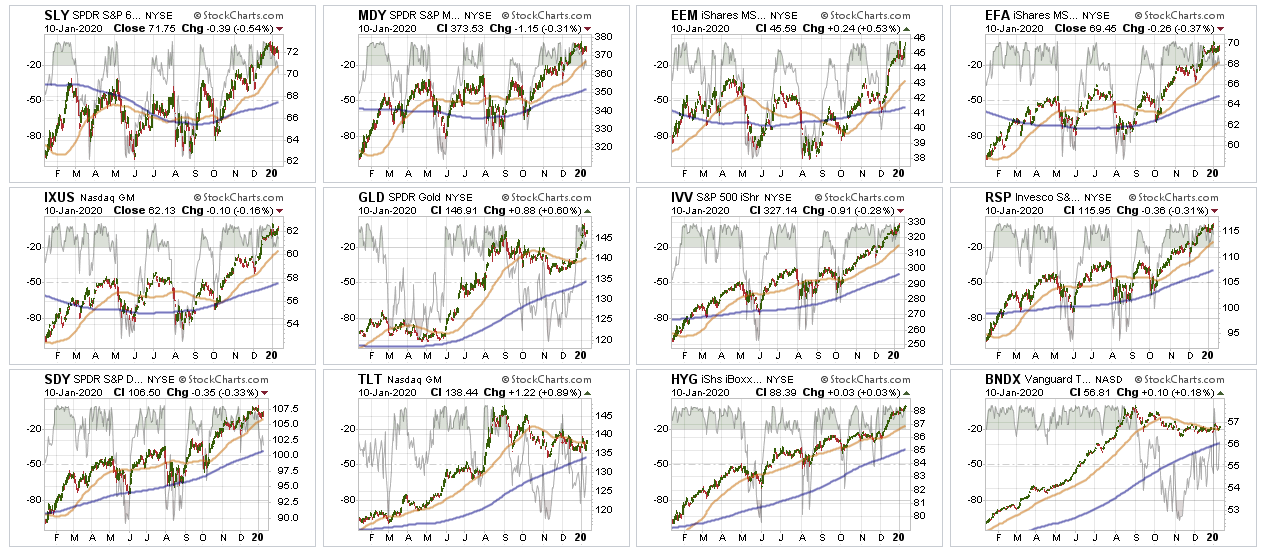
Small-Cap (SLY) and Mid Cap (MDY) – Small- and Mid-caps broke out of the previous ranges as the rotation to risk occurred, but over the last couple of weeks, the relative performance has fallen flat as the focus has returned to chasing the largest of large-cap names. As noted two weeks ago, we added to our small-cap holdings with a small-cap value ETF, and the pullback we expected is in progress. We are holding that position for now, but are tightening up our stops.
Current Position: KGGIX, SLYV
Emerging, International (EEM) & Total International Markets (EFA)
Emerging and International Markets, rallied recently on news of a “trade deal” and finally clearly broke above important resistance. However, like small and mid-caps above, international stocks relative performance has also stalled. As discussed two weeks ago, we added positions in both emerging market and international value positions, however, we are tightening up our stops to protect our capital investment.
Current Position: EFV, DEM
Dividends (VYM), Market (IVV), and Equal Weight (RSP) – These positions are our long-term “core” positions for the portfolio given that over the long-term markets do rise with economic growth and inflation. Currently, the short-term bullish trend is positive, and our core positions are providing the “base” around which we overweight/underweight our allocations based on our outlook.
Be aware that all of our core positions are EXTREMELY overbought. A short-term correction or consolidation is likely before a further advance can be made.
Current Position: RSP, VYM, IVV
Gold (GLD) – As noted two weeks ago, Gold was holding support at the $140 level and registered a buy signal. GDX has also held support and turned higher with a triggered buy signal. Over the last two weeks, gold has broken out to highs, however, miners have turned lower as the “value” rotation shifted back to momentum. We previously took our holdings back to full-weights after taking profits earlier this year. However, we are tightening up our stop levels.
Current Position: GDX (Gold Miners), IAU (Gold)
Bonds (TLT) –
Bonds rallied back above the 50-dma on Friday as money rotated into bonds for “safety” as the market weakened on Friday. There is a consolidation with rising bottoms occurring currently, which suggests we may see further weakness in the market with a “risk off” rotation into bonds.
Add to bonds here with a stop at $136 for TLT as a benchmark.
Current Positions: DBLTX, SHY, IEF
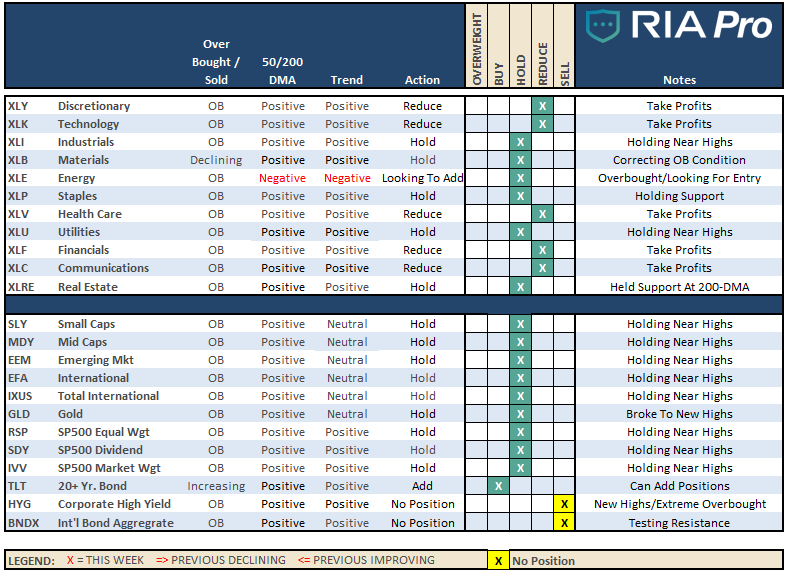
Sector / Market Recommendations
The table below shows thoughts on specific actions related to the current market environment.
(These are not recommendations or solicitations to take any action. This is for informational purposes only related to market extremes and contrarian positioning within portfolios. Use at your own risk and peril.)
Portfolio/Client Update:
Next week, Michael Lebowitz is coming to town, and we are hosting very small group events to discuss our portfolio and investing outlook for 2020. We are recording the presentation, and will share it with you next week in this newsletter as our MacroView.
Over the last several months, we have discussed adding “value” to the portfolio, increased our “gold” holdings, and continue to run shorter-duration in our bond portfolios. One of the big macro-themes we are studying is a weaker U.S. Dollar relative to the rest of the world, which could significantly shift our focus from “stocks” to commodities and other assets that benefit from a weaker currency.
Please read our previous “MacroView” which discussed our view in this regard.
As noted in the main missive this week, the market is extremely extended, overbought, and complacent. As such, market corrections occur regular in this type of environment regardless of the underlying bullish thesis.
As such, on Friday, we took actions to slightly reduce portfolio risk, and raise cash. While this may lead to some short-term underperformance in portfolios, you will appreciate the reduced volatility if a correction occurs over the next 3-4 weeks as expected.
Therefore, here are our portfolio actions we have taken:
- New clients: We are holding off onboarding new client assets until we see some corrective action or consolidation in the market.
- Dynamic Model: We previously started building the “core equity” of the portfolio. We have now taken the model to “market neutral” by adding an equal weight of a short S&P 500 index.
- Equity Model: We reduced our holdings in AAPL, MSFT, AGNC, CVS, HCA, JNJ, MU, and UNH. We remain long these positions, but they were extremely overbought so we reduced our position slightly to take in profits.
- ETF Model: We reduced our holdings in REM, XLC, XLK, XLV, and XLY. Again, these sectors were overweight their target weightings in the model so we have reduced those holdings back to target weight to capture gains and reduce portfolio risk.
Note for new clients:
It is important to understand that when we add to our equity allocations, ALL purchases are initially “trades” that can, and will, be closed out quickly if they fail to work as anticipated. This is why we “step” into positions initially. Once a “trade” begins to work as anticipated, it is then brought to the appropriate portfolio weight and becomes a long-term investment. We will unwind these actions either by reducing, selling, or hedging if the market environment changes for the worse.
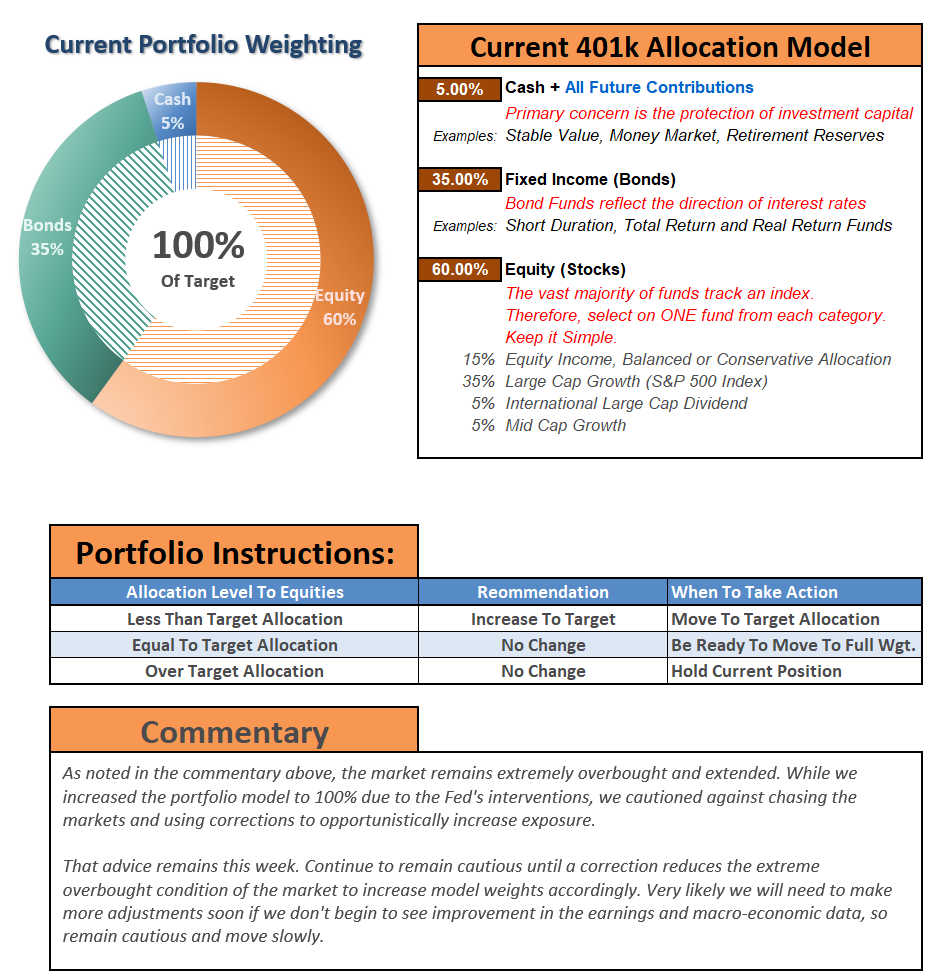
THE REAL 401k PLAN MANAGER
A Conservative Strategy For Long-Term Investors
The 401k plan allocation plan below follows the K.I.S.S. principle. By keeping the allocation extremely simplified it allows for better control of the allocation and a closer tracking to the benchmark objective over time. (If you want to make it more complicated you can, however, statistics show that simply adding more funds does not increase performance to any great degree.)

If you need help after reading the alert; do not hesitate to contact me.
Click Here For The “LIVE” Version Of The 401k Plan Manager
See below for an example of a comparative model.
Model performance is based on a two-asset model of stocks and bonds relative to the weighting changes made each week in the newsletter. This is strictly for informational and educational purposes only and should not be relied upon for any reason. Past performance is not a guarantee of future results. Use at your own risk and peril.

401k Plan Manager Live Model
As an RIA PRO subscriber (You get your first 30-days free) you have access to our live 401k p
The code will give you access to the entire site during the 401k-BETA testing process, so not only will you get to help us work out the bugs on the 401k plan manager, you can submit your comments about the rest of the site as well.
We are building models specific to company plans. So, if you would like to see your company plan included specifically, send me the following:
- Name of the company
- Plan Sponsor
- A print out of your plan choices. (Fund Symbol and Fund Name)
If you would like to offer our service to your employees at a deeply discounted corporate rate, please contact me.


