
🔎 At a Glance
- Why WWIII fears failed (again) to derail markets
- S&P 500 breaks out – What the technicals say next
- The Fed’s transitory mistake still haunts rate policy
- “I missed the rally. What do I do now?
- Portfolio updates & sector strategy shifts
- Market stats, screens, and risk indicators
💬 Ask a Question
Have a question about the markets, your portfolio, or a topic you’d like us to cover in a future newsletter?
📩 Email: lance@riaadvisors.com
🐦 Follow & DM on X: @LanceRoberts
📰 Subscribe on Substack: @LanceRoberts
We read every message and may feature your question in next week’s issue!
📊 Weekly Market Trading Overview
The S&P 500 and the Nasdaq both set all-time highs this week. This feat seems remarkable given the barrage of negative headlines, geopolitical risks, and a Federal Reserve intent on not cutting rates. However, the bulls remain decisively in control of the market as it closed above the 6100 level amid a backdrop of weakening economic data, dovish undertones from the Federal Reserve, and continued strength in mega-cap tech. Despite some pockets of sector underperformance, key technical indicators suggest bullish momentum remains intact, but with caveats beneath the surface.
- Price Action: The index broke out from a brief consolidation zone between 6000 and 6050, closing the week at all-time highs with strong follow-through on increasing volume.
- Moving Averages:
- The index remains well above its 20-day, 50-day, and 200-day moving averages — a classic bullish configuration.
- The 20-day MA is acting as near-term dynamic support, currently around 6050.
- A “Golden Cross” is approaching with the 50-day set to cross above the 200-day moving average next week.
- RSI (Relative Strength Index): Hovering around 72, indicating short-term overbought conditions, but is consistent with strong market uptrends.
- MACD: Remains is on a bullish crossover, confirming upward momentum.

Flows And Positioning
- Fund Flows: EPFR and Bank of America data showed inflows into large-cap U.S. equity funds this week, particularly in technology and communications sectors.
- Hedge Fund Positioning: Net exposures remain elevated, particularly in concentrated names like Nvidia, Microsoft, and Apple, suggesting institutional conviction and heightened risk if leadership falters.
- Retail Participation: This week, retail flows picked up slightly, driven mainly by options activity, especially in mega-cap tech and AI-related names.
- Equal Weight S&P 500 (RSP): Lagged behind the cap-weighted index and remains under its February highs, reinforcing narrow breadth.
- Small Caps: The Russell 2000 underperformed, weighed down by rising energy prices and concerns about refinancing risk.
Risks To Monitor Next Week
- Breadth Divergences: New index highs not confirmed by the average stock could signal weakening internal strength.
- Overbought Conditions: Short-term technicals suggest a pullback is possible before the next leg higher.
- Earnings Season Ahead: Elevated expectations for mega-cap tech could result in volatility if results disappoint.
Looking Ahead to Next Week
Given the S&P 500’s breakout to new highs amid narrow leadership and overbought technicals, investors should approach next week with a balanced stance. Remain constructive on the broader trend while respecting the potential for short-term volatility.
July tends to be a better-performing month overall; therefore, portfolio positioning should emphasize quality large-cap growth, particularly in sectors demonstrating strong momentum. However, monitor breadth as a cue to trim excess risk as needed. Tactically, this is a prudent time to review stop-loss levels, maintain appropriate diversification, and watch for signs of broadening participation to validate further upside.

Need Help With Your Investing Strategy?
Are you looking for complete financial, insurance, and estate planning? Need a risk-managed portfolio management strategy to grow and protect your savings? Whatever your needs are, we are here to help.

⚙️ WWIII – The Death Of Another Narrative
This past week, another narrative died. The U.S. attack on Iranian nuclear facilities on June 21, 2025, was described as a precise strike, with President Trump claiming it “completely and totally obliterated” Iran’s key nuclear enrichment facilities. Iran’s response, including a missile attack on a U.S. military base in Qatar, was intercepted and resulted in no U.S. casualties, signaling a limited retaliation. Markets interpreted this as a de-escalation, as Iran avoided actions like closing the Strait of Hormuz, which would have severely disrupted global oil supplies. Iran’s symbolic retaliation, along with no response from its allies, China and Russia, signaled the end of the WWIII narrative.
Of course, the WWIII narrative was only the latest promoted by the “perma-bears.” Throughout the last three years, there have been numerous failed narratives:
- De-dollarization,
- The debt and deficit time bomb,
- Deepseek
- Peak CapEx expenditures in data centers
- Tariffs
- Moody’s debt downgrade
- Sell America
- and, of course, WWIII.
Yet, as shown, the S&P 500 index continues to perform well over that period.
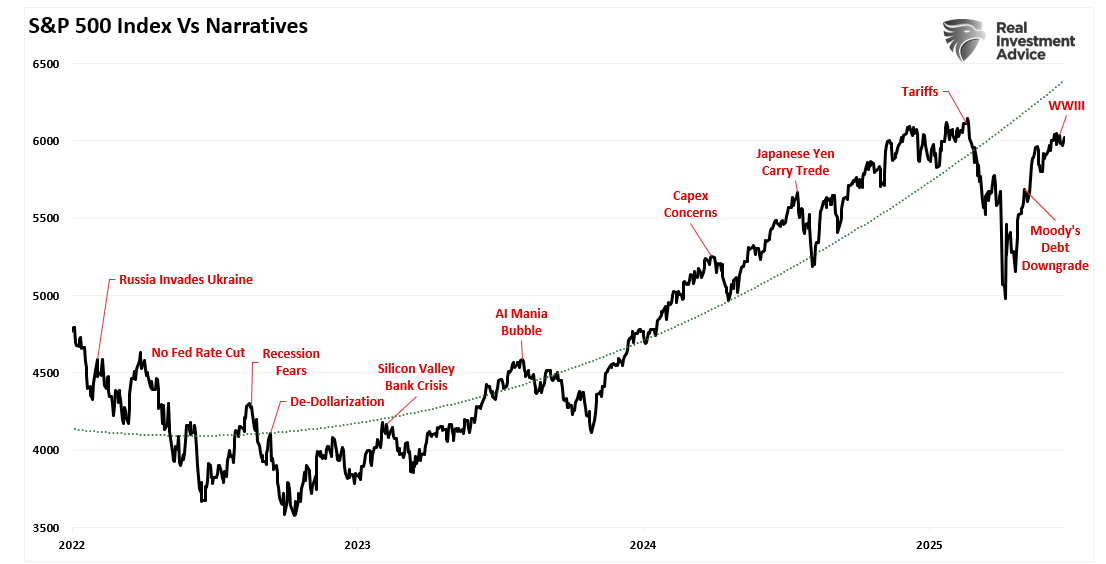
While the market’s journey higher from 2021 was indeed bumpy, as all markets are, falling victim to mainstream narratives has been costly. While some narratives have more impact than others, the question is whether or not the anticipated event will affect future earnings growth in the short term. For example, in March, the market reacted negatively to President Trump’s “Liberation Day” announcement, but not to the concerns of WWIII. The reason is that tariffs can have a future impact on corporate earnings growth across the entirety of the financial markets. In contrast, an Iranian conflict would only impact a few companies (travel and leisure) while benefiting others (energy and defense).
Earnings Outlook Remains Positive
Despite the media-driven headlines, earnings estimates remain positive and are expected to accelerate into 2026. In other words, the numerous “bearish” narratives failed to create a more significant market downturn because the market assessed that those events would not lead to profoundly negative earnings revisions. (It is important to note that the annual rate of change of the S&P 500 index is highly correlated with the annual growth rate of earnings.)
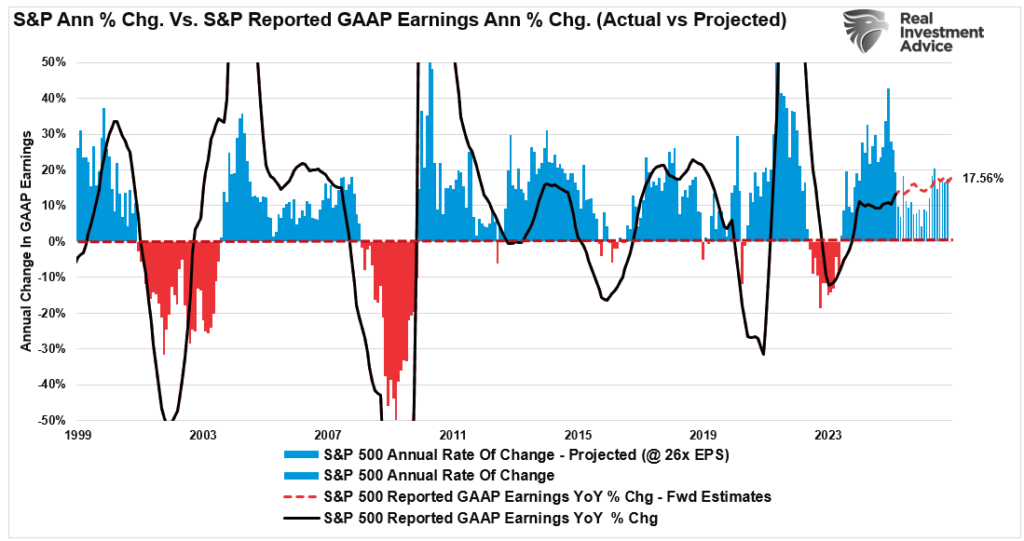
However, some events have led to deeper market corrections because those events resulted in sharp downward revisions to forward earnings estimates.

Over the last two years, we have steadily pushed back against the bearish narratives. As we noted in “Narratives Change, Markets Don’t:“
“The need for a narrative is deeply rooted in our psychology. As pattern-seeking creatures, we crave coherence and predictability. Chaos triggers anxiety. It feels dangerous, uncontrollable, and unsettling. In investing, this anxiety is magnified by the direct impact on our wealth and financial security. We regain a semblance of control by latching onto the narrative, no matter how tenuous. The narrative tells us why things are happening and what might happen next, which soothes our natural fear of uncertainty.”
As discussed in that article, “Negativity bias” influences how we process information, including financial news and market narratives. This is why “bearish”-leaning podcasts and articles generate the most clicks and views.
What is most important to investors is that the market absorbs all negative media narratives over the long term. The recent barrage of negative narratives surrounding debts, deficits, tariffs, inflation, wars, Trump, etc., is all just there to feed your negative bias. However, zooming out, investors who have stayed away from investing in the financial markets to “avoid the loss” of potential adverse outcomes have paid a dear price in reduced financial wealth.
In other words, there is always a “reason” not to invest. But that is usually when the best opportunities to put capital to work appear.
Remember, historically, whatever “narrative” grabs media headlines will eventually change. The markets don’t.
📉 I Missed The Rally. What Do I Do Now?
You’re not alone if you missed the recent rally to all-time highs. Many investors remain paralyzed by the sharp pullback we saw in March and April—a classic example of loss aversion at work. After watching portfolios draw down earlier in the year, it’s understandable to hesitate when prices are again at record levels. But letting fear dictate long-term investment decisions often leads to poor outcomes.
From a portfolio management perspective, the goal isn’t to “chase” the market or make up for lost gains in one big move. Instead, investors should reframe the question: What is the market telling me about risk, opportunity, and positioning right now? With the S&P 500 at all-time highs, the trend is bullish. Yet, the rally has been narrow, led by a handful of mega-cap names, while many stocks remain below their highs. That divergence creates both opportunity and caution.
If you’re sitting on excess cash, the prudent strategy is gradually re-engaging the market. Dollar-cost averaging into core equity positions helps mitigate the emotional pressure of market timing. Focus on sectors with strong earnings momentum and reasonable valuations. At the same time, downside risk can be managed through proper allocation, hedging, and keeping some dry powder for volatility.
Remember, the best portfolios are built over time, not in a single trade. Let the market come to you. Patiently add exposure when setups align with your risk tolerance and investment objectives. Missing the bottom doesn’t mean you’ve missed the bull. But staying sidelined out of fear guarantees you’ll miss future gains. Risk is always present—but so is opportunity. The key is managing one while staying open to the other.
📊 Portfolio Tactics
With the market breakout of the bullish flag discussed in our Daily Market Commentary, we are rebalancing portfolios and putting some of our idle cash back to work in areas that have recently become more oversold and are turning back up.
Each section below details the additions or changes to each model and the percentage change to the current holding.
Equity Model
- Increase each of the folding holdings by 1% of the portfolio value:
- WMT, COST, V, LLY, ABBV, BRK-B
- Initiate a 1% position in each of the following:
- BLK, KMI, NOW
ETF Model
- Increase each of the following sectors to their specific new target weights (% of total portfolio value)
- XLF – 6%
- XLY – 4%
- MGK – 9%
Dividend Growth Model
- Rebalance all remaining positions to 2.75% of the portfolio.
- Sell 100% of FRT and MDT.
- Initiate a 2.75% position in UGI and AMGN
- Increase AMZN, GOOG, and AAPL to 4.5% of the portfolio.
- Leave META, NVDA, and MSFT at current weights.
🎤 From Lance’s Desk
This week’s #MacroView blog explains how the Fed’s delayed reaction to post‑pandemic inflation, keeping stimulus active long after recovery, has eroded its credibility, shaped its cautious outlook on tariffs, and raised the risk that it may hold rates too high, for too long.
Also Posted This Week:
- Iran Struck By U.S.: Markets, Risk, and Rational Investing
- Fueling AI Data Centers: Behind The Meter Solutions- Part 1
🎥 Watch & Listen
In this video, Lance Roberts explains how the recent spike—and equally sharp slide—in oil prices, now hovering around the 50‑day moving average near $60, is signaling cooling economic demand despite a strong market rally, and why that trend could shape investor sentiment through summer.
Subscribe To Our YouTube Channel To Get Notified Of All Our Videos
📊 Market Statistics & Analysis
Weekly technical overview across key sectors, risk indicators, and market internals

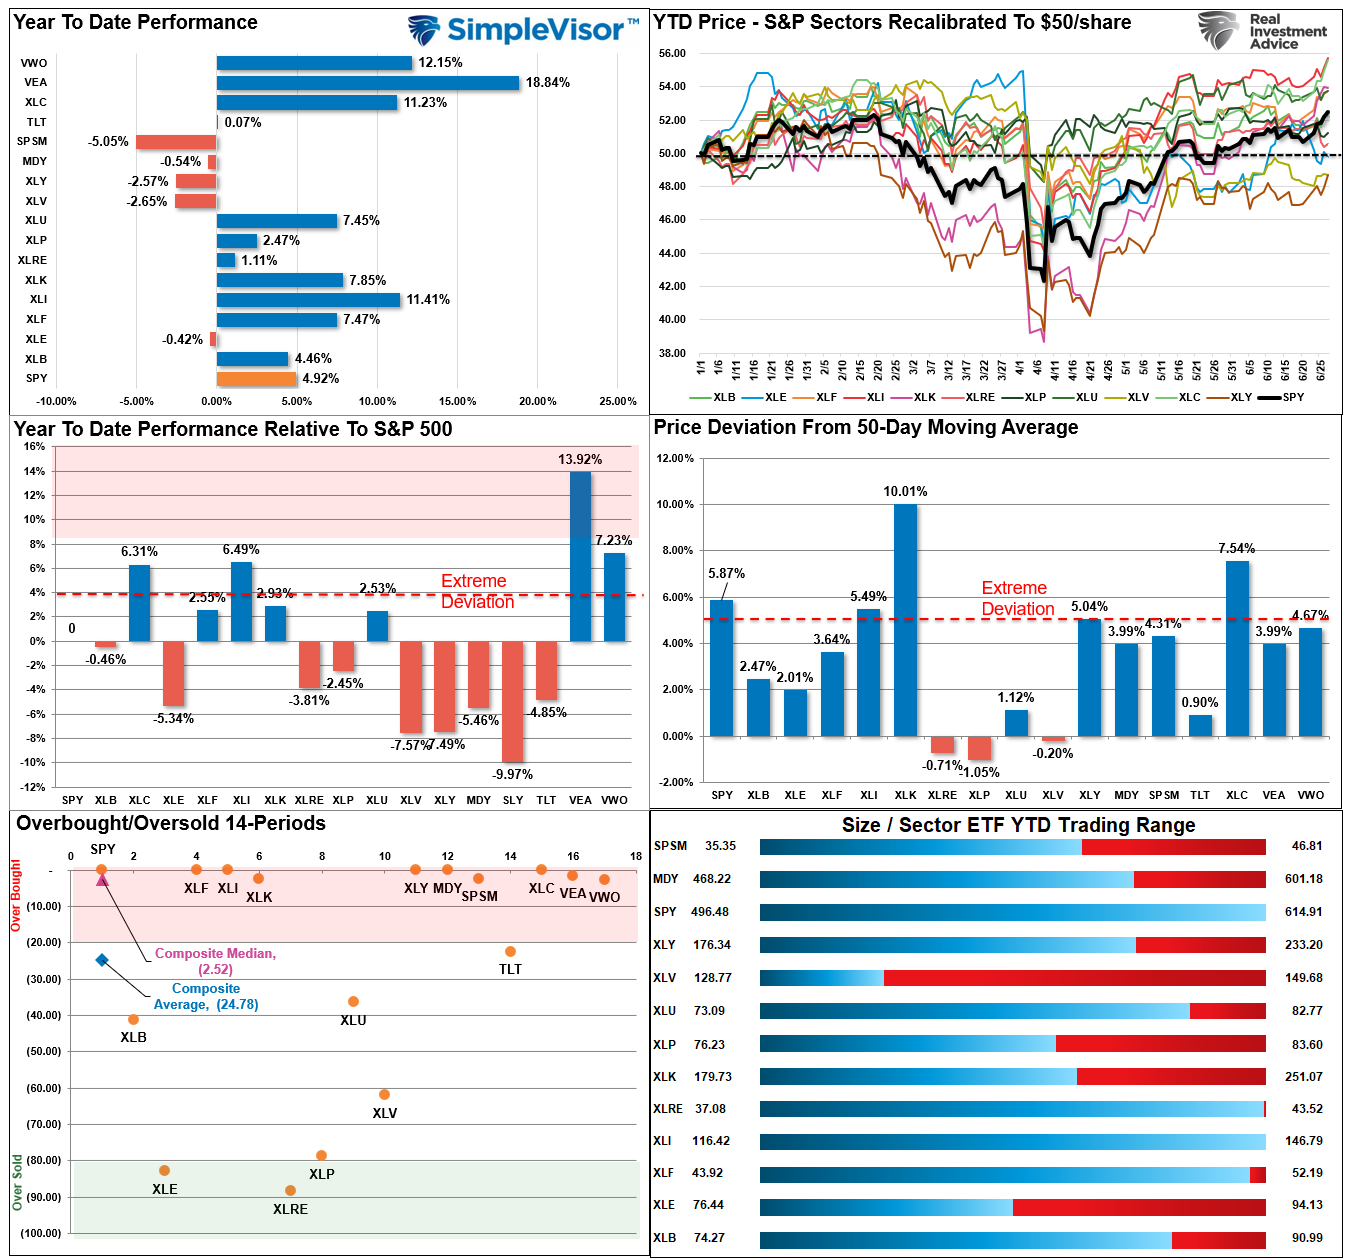
🧩 Market & Sector X-Ray: Overbought
The market advanced this past week and broke to all-time highs, pushing several sectors and markets into more overbought conditions. Energy, real estate, staples, and healthcare are lagging. Meanwhile, international, emerging markets, small and mid-cap, financials, technology, and discretionary are the most overbought. After the recent gains, investors should consider rebalancing portfolios and taking profits.
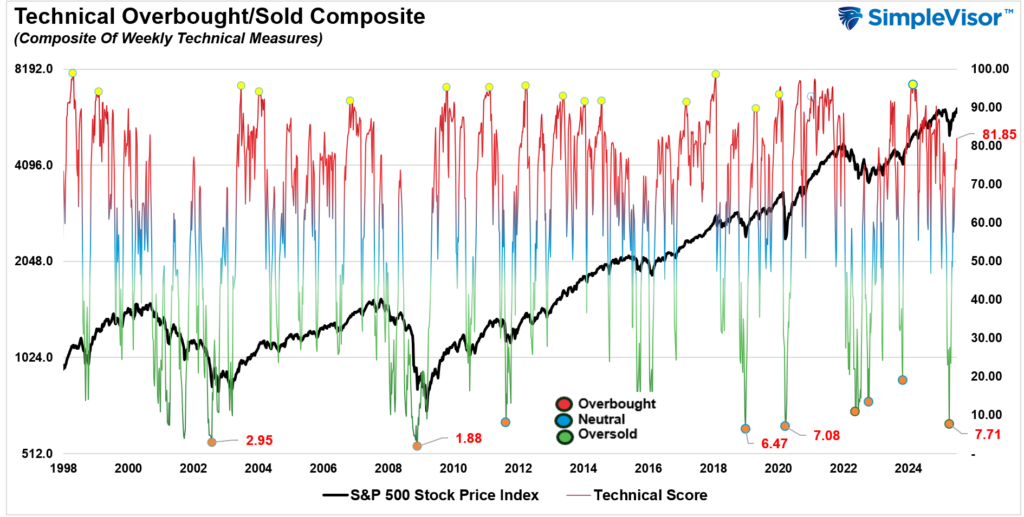
📐 Technical Composite: 81.85 – Overbought, Risk Rising
Markets are pushing into more overbought territory, and pullbacks to support are likely.
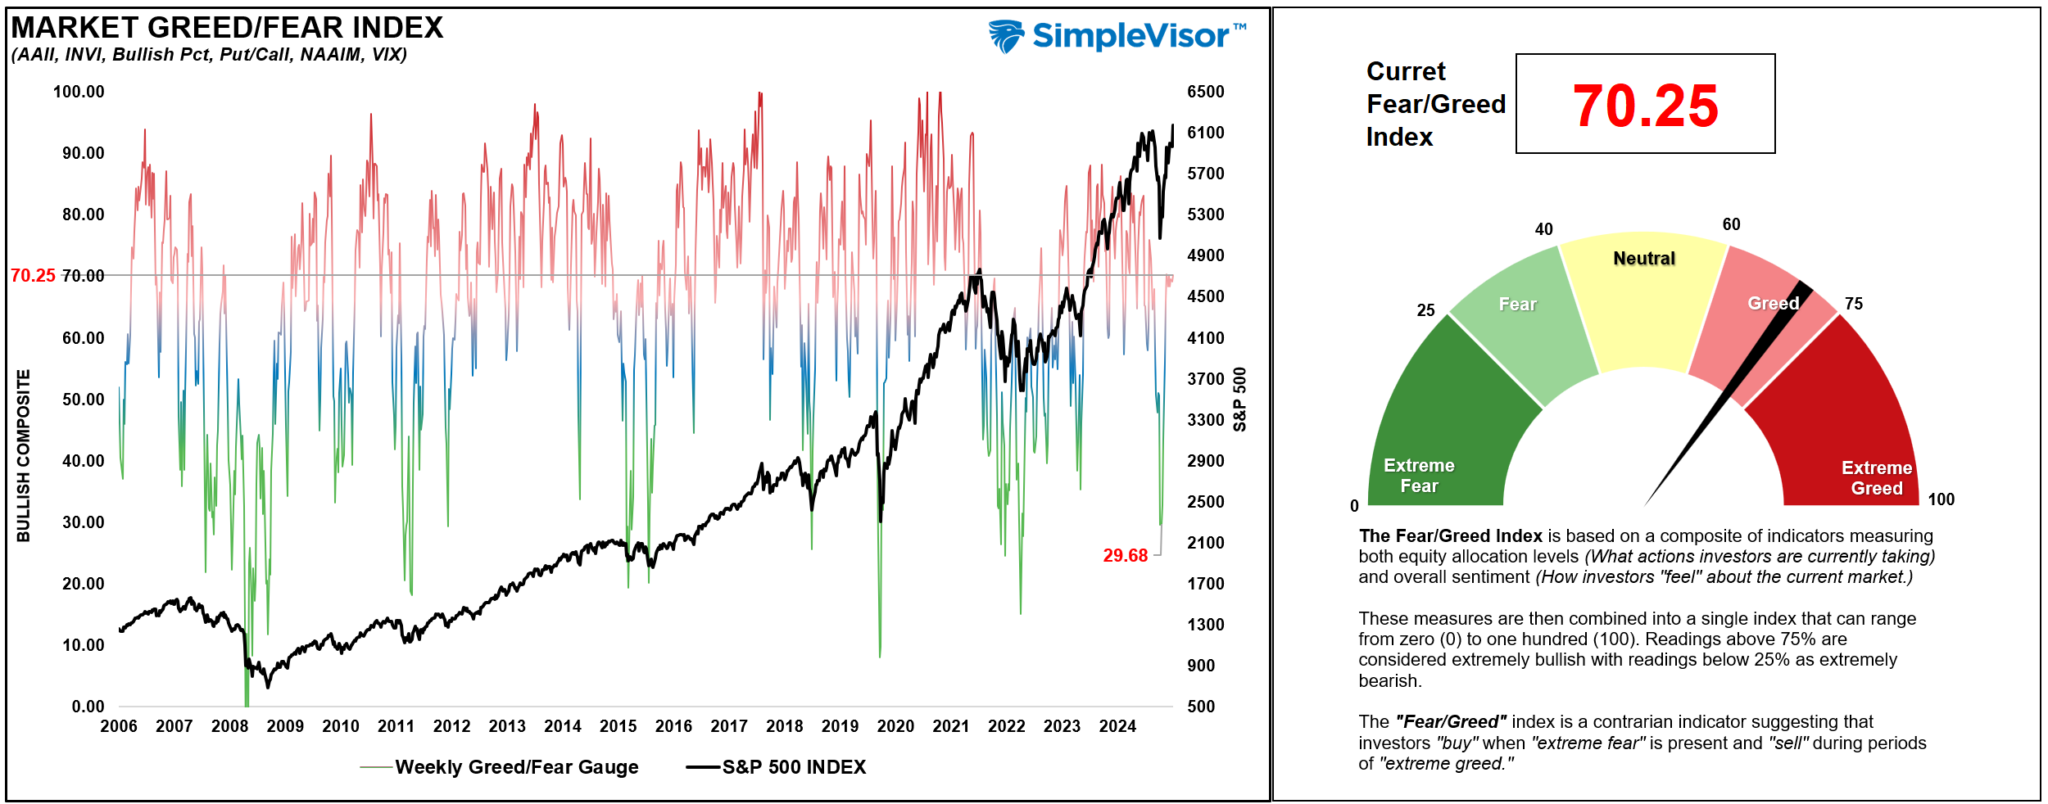
😐 Fear/Greed Index: 70 – Greed Levels Are Rising
Investor psychology and risk appetite are rising but not yet euphoric. Current readings suggest that the “herd” still controls the market, keeping a bullish footing intact.
🔁 Relative Sector Performance
Real Estate, Staples, and Materials underperformed the most this week as investors chased Technology and Communications. With the leaders in more extreme overbought territory, a rotation to Staples and Healthcare is likely.

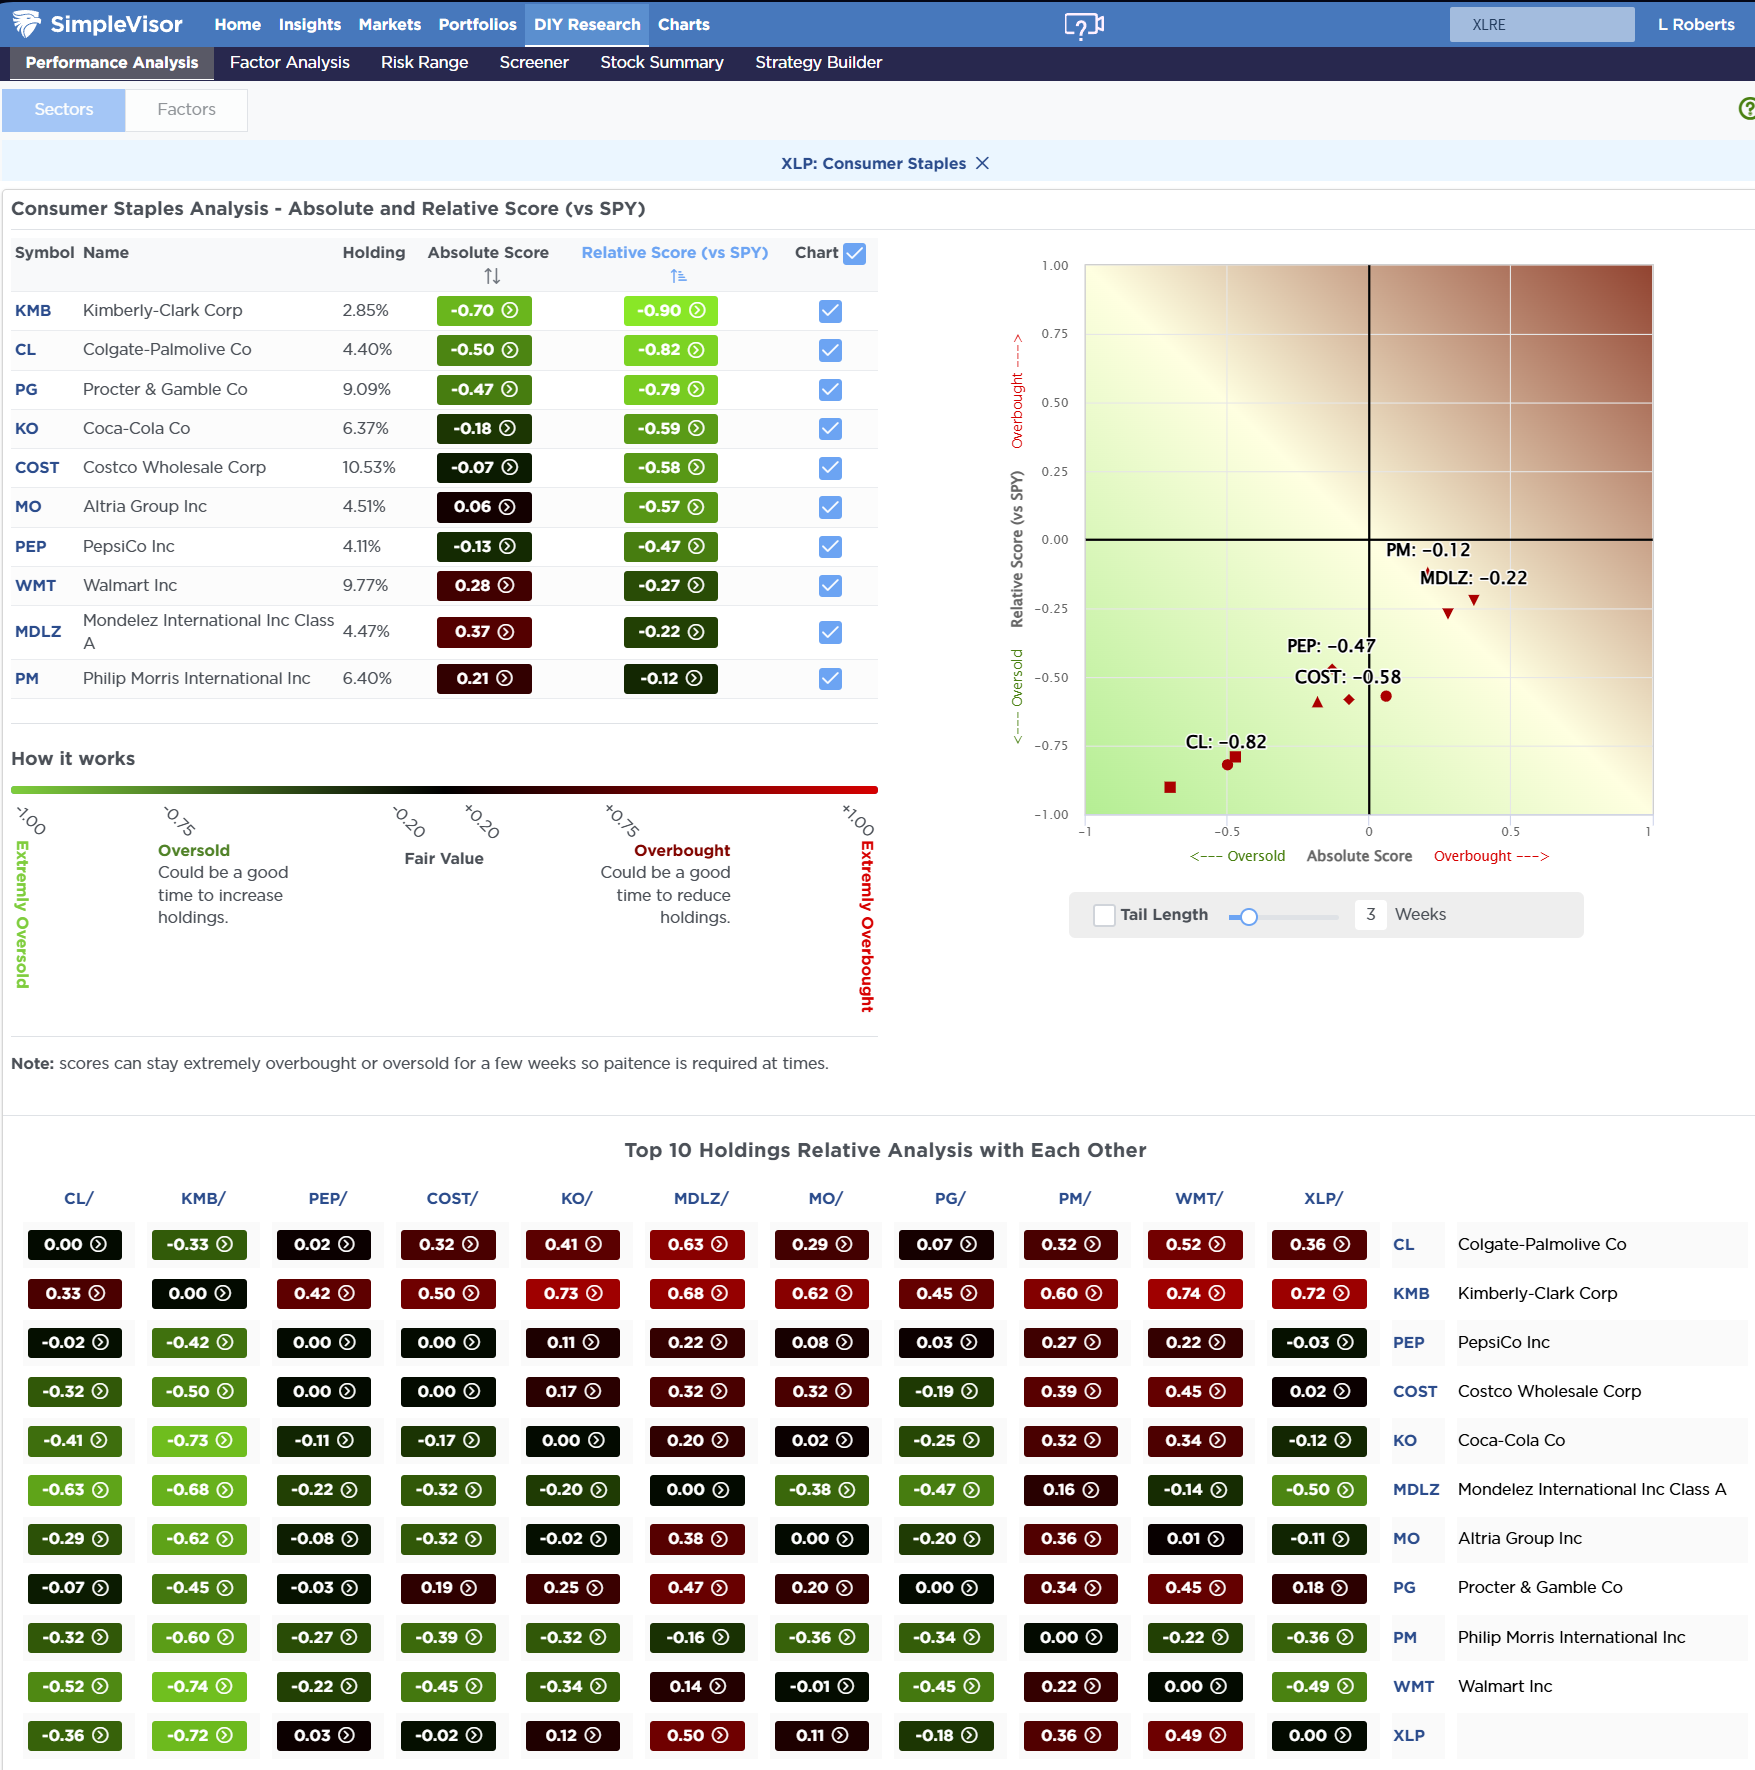
🧊 Most Oversold Sectors
As noted, Healthcare and Staples are two of the market’s more oversold sectors, which could catch inflows from a risk-off rotation. KMB, CL, and PG are currently the most oversold in the Staples sector.
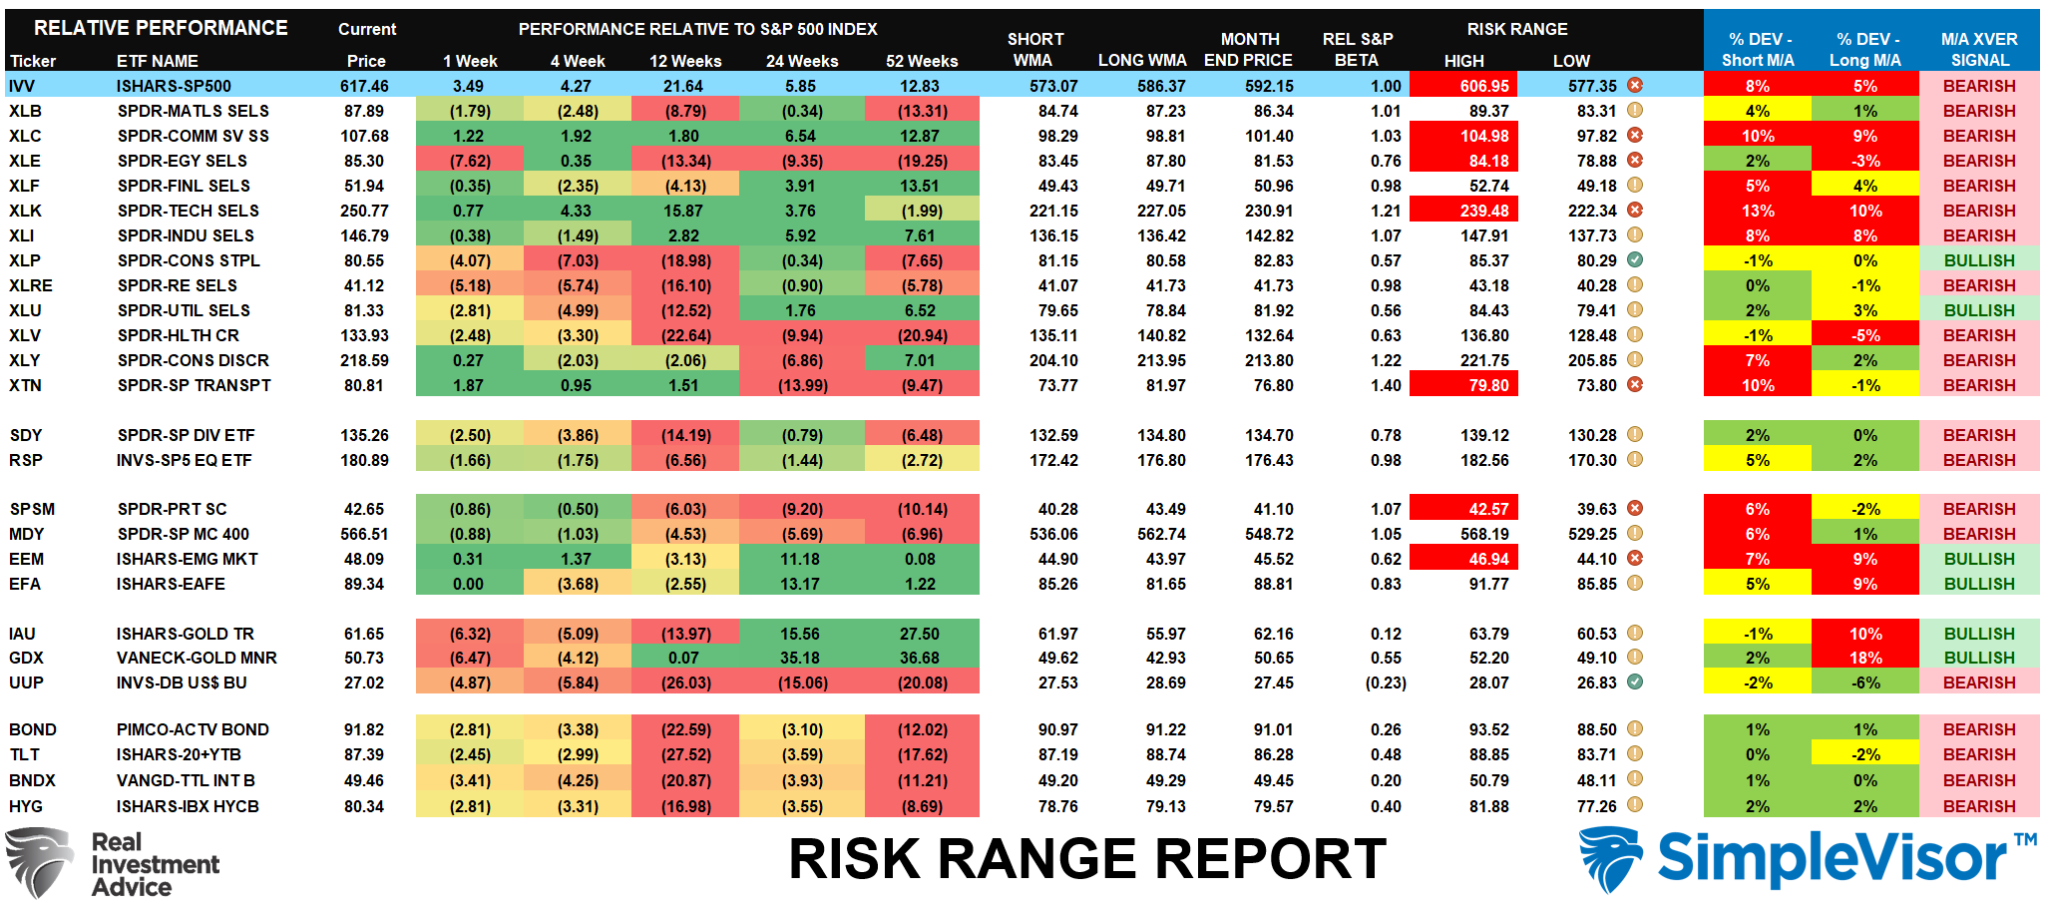
📊 Sector Model & Risk Ranges
The S&P 500 index, Communications, Technology, and Transportation are trading far above their monthly risk ranges. With the recent improvement in the overall index, we should start seeing a reversal of some of the numerous bearish crossovers, supporting a continuation of the bullish advance.
Have a great week.
Lance Roberts, CIO, RIA Advisors

