
Over the last fourteen years, as we share below, the US government credit rating has slipped from AAA to AA. Moody’s was the first to cut the USA from AAA to AA in 2011. Fitch followed in 2023, and Moody’s did the same last weekend. Now that the USA government is fully rated AA by the three major bond rating agencies, let’s consider a better-rated alternative: Johnson & Johnson (JNJ). JNJ is AAA, and alongside Microsoft, it is one of the only two large domestic companies rated AAA by S&P. As of the Monday morning open, JNJ’s 10-year notes are opening at 5.08%, up from 4.97% on Friday. The ten-year US Treasury note is opening at 4.54%, up 10 bps from 4.44%. The yield changes are similar despite the rating action only directed at the USA.
If the market were genuinely concerned about Moody’s downgrade of the USA, one would expect the spread between the two bonds to tighten, not stay the same or even slightly widen. Thus, might this pop-in yield be more a function of Scott Bessent’s renewal of tariff threats this past weekend? The market still believes that tariffs will result in inflation. Thus, higher tariffs might lead to more inflation, which would impact all bond yields.
As an aside, the downgrade will not impact liquidity in the capital markets. Treasuries are essential regulatory liquid assets for banks and provide high-quality collateral in repo transactions. Basel banking regulations assign 0% risk weights to bonds rated AAA to AA-, rendering the downgrade inconsequential for capital requirements. The collateral status of Treasuries in repo markets is also unaffected, as AAA through AA- bonds fall in the same haircut category.

What To Watch Today
Earnings

Economy
- No notable economic releases.
Market Trading Update
In yesterday’s commentary, we noted that the market was very overbought and needed a short-term correction. One would have suspected that the Moody’s downgrade would have done the trick, but the bulls immediately rushed in to buy the early morning dip. For now, the “bears” can’t catch a break as every dip is quickly met with buyers. As discussed previously, with stock buybacks in full swing and professional investors underexposed to equities, the need to chase the rally remains. Such is problematic from two standpoints. First, if you are out of the market, trying to figure out how to get back in is painful. Secondly, it is hard to justify making profits and reducing risk if you are in the market. Both are equally problematic, as this rally will eventually correct, but usually just at the point where investors tend to make the most mistakes.
That said, there is building evidence that the April correction is over. Sentiment Trader posted an excellent analysis on Monday, which confirms much of the same data we have discussed with you over the last two weeks. Most notably, despite the concerns about a recession, debt downgrade, and tariffs, there has been a sudden bullish shift in market momentum. To wit:
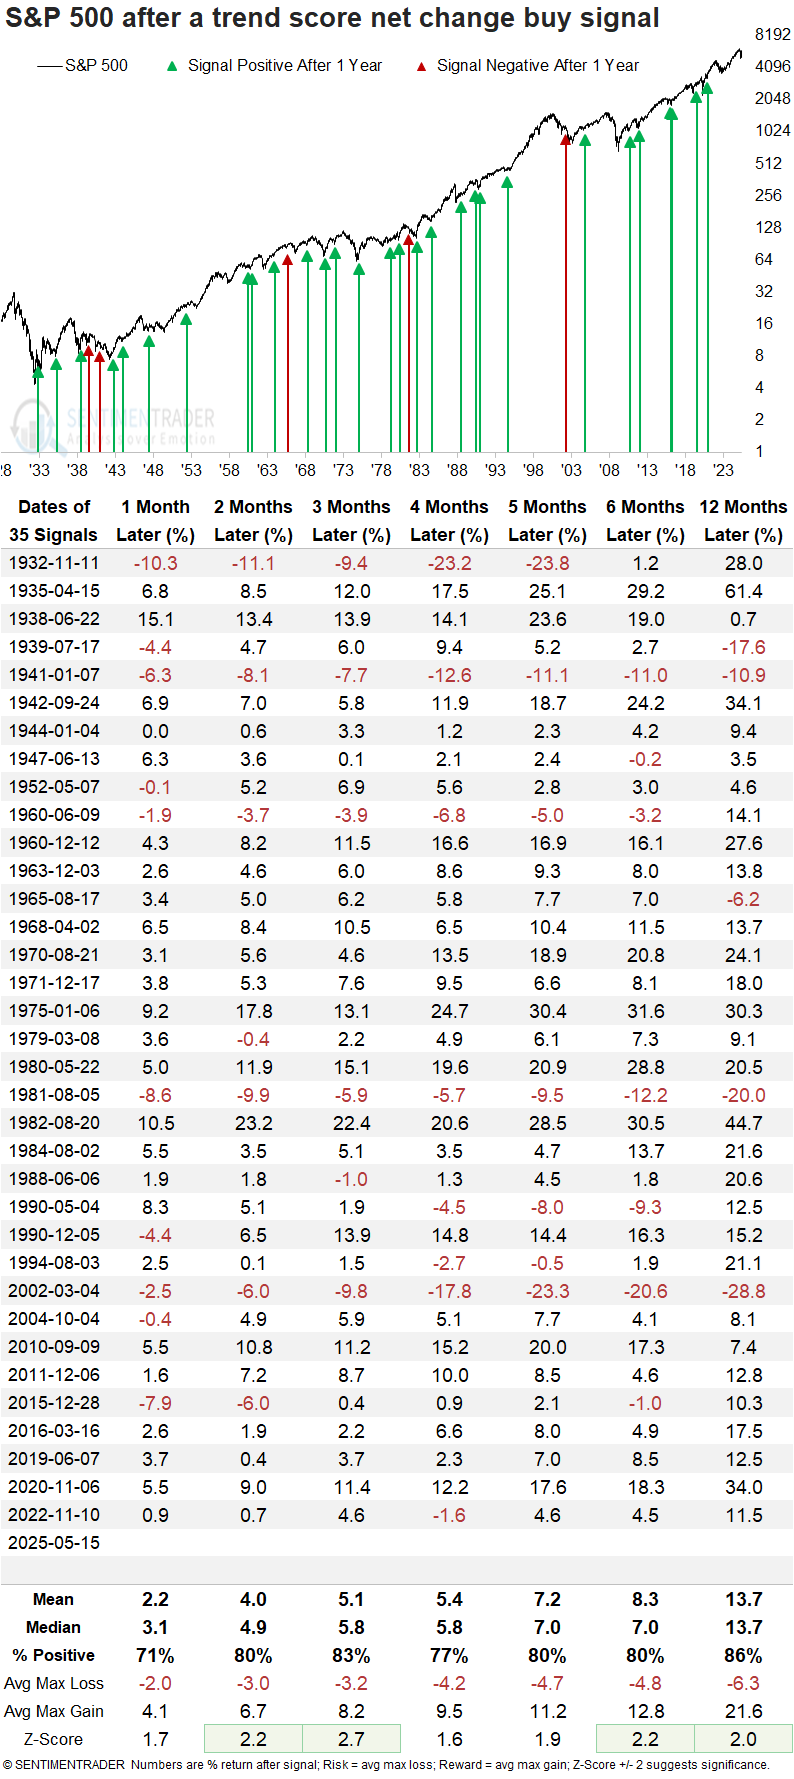
“This trend score surge occurs when the composite increases by four or more points over five days, proving to be a timely signal for momentum regime changes, often preceding sustained directional moves. Further supporting the shift from a downtrend to an uptrend, the S&P 500 and Nasdaq 100 saw notable increases in trend scores, marking their first net change signals since the recovery from the 2022 bear market. Two additional conditions are required to trigger the signal: the trend score must reset below 2, and the index must show positive short-term momentum alongside the net change surge.”

Of course, the obvious question is how the market has performed historically following the trend score buy signal.
“Whenever the S&P 500’s trend score climbed by four points over five days, the world’s most benchmarked index displayed excellent returns and consistency over the next year. Furthermore, four out of seven horizons exhibited significance relative to random returns. Of the five instances when the S&P 500 declined a year later, all but one,1965, occurred during a well-established downtrend, with signals emerging 169 to 584 days after the peak. By contrast, the latest signal emerged just 61 days from the high.”
While the historical data is very bullish and suggests that investors remain focused on maintaining equity risk, it does not preclude the market from short-term corrections to relieve overbought conditions as we have currently. However, the data does suggest that those dips should be bought, and equity exposure should be increased to target levels. As Sentiment Trader concluded:
“A composite incorporating ten trend-following indicators recently experienced a significant upward shift, triggering a buy signal for the S&P 500. Comparable signals have led to favorable outcomes, with the world’s most benchmarked index rising 86% of the time over the following year and posting a median gain of 13%. A similar signal was also triggered for the Nasdaq 100, which has shown even more compelling forward returns. In past instances, the Nasdaq 100 advanced in all but one case over the next 12 months, highlighting the strength and consistency of this trend-based setup across major equity benchmarks. The weight of the evidence continues to build in favor of the bulls.”
We agree.

Finally, In Overbought Territory
1,100 S&P 500 points in six weeks, and the market is firmly in overbought territory. While other indicators like MACD and RSI have already marked the overbought condition, the SimpleVisor absolute analysis finally concurs. As highlighted in the red box and circle below, over half of the sectors have decently overbought scores. In particular, communication, utilities, and financial stocks are most overbought. The overbought condition is more evident on the factor page shown in the second graphic. 17 of the 22 factors have absolute scores over 50, with foreign markets and large-cap growth stocks being the most overbought.


Moody’s Debt Downgrade- Does It Matter?
This morning, markets are reacting to Moody’s rating downgrade of U.S. debt. For those promoting egregious amounts of “bear porn,” this is nirvana for fear-mongering headlines that gain clicks and views. However, as investors, we need to step back and examine the history of previous debt downgrades and their outcomes for both the stock and bond markets. Let’s start with what the Moody’s rating agency stated about its rating change.
“This one-notch downgrade on our 21-notch rating scale reflects the increase over more than a decade in government debt and interest payment ratios to levels that are significantly higher than similarly rated sovereigns.”
Moody’s had been a holdout in keeping U.S. sovereign debt at the highest credit rating possible, and brings the 116-year-old agency into line with its rivals. Standard & Poor’s downgraded the U.S. to AA+ from AAA in August 2011, and Fitch Ratings also cut the U.S. rating to AA+ from AAA in August 2023. We will review these previous downgrades momentarily. However, the reason for Moody’s debt downgrade is unsurprising.

Tweet of the Day

“Want to achieve better long-term success in managing your portfolio? Here are our 15-trading rules for managing market risks.”
Please subscribe to the daily commentary to receive these updates every morning before the opening bell.
If you found this blog useful, please send it to someone else, share it on social media, or contact us to set up a meeting.

