
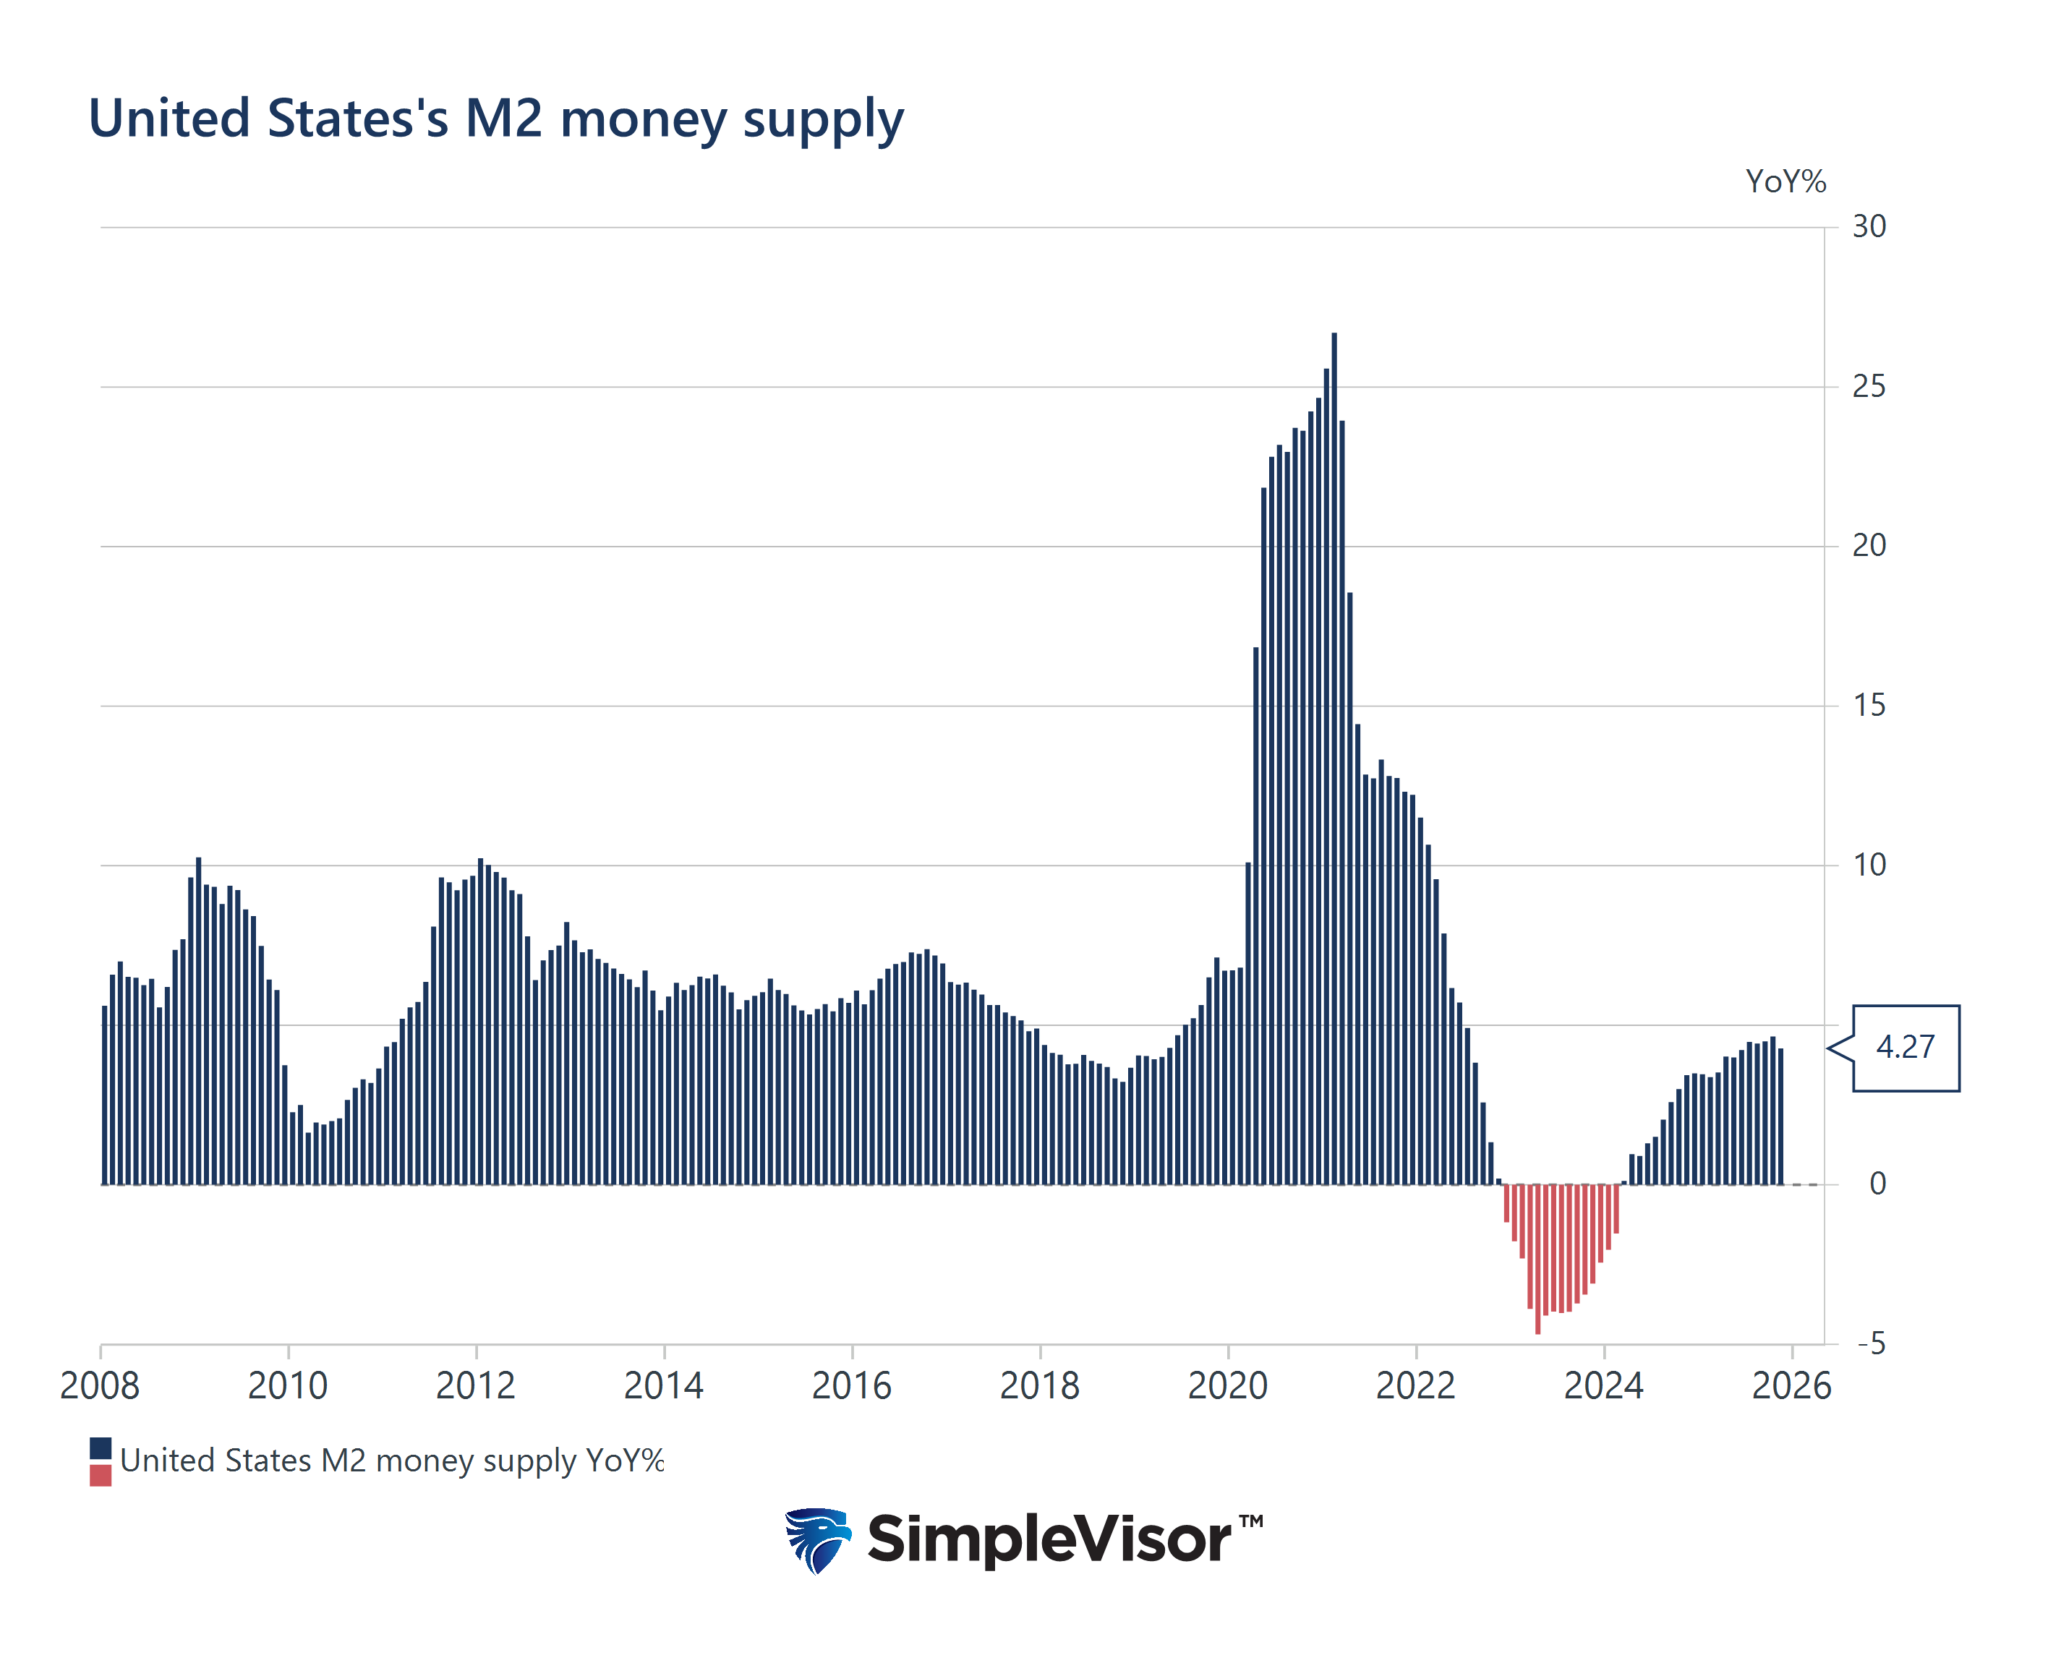
Supporting the dollar-debasement narrative is the claim that money supply growth is out of control. For instance, we saw a post claiming “US money creation is happening at an alarming pace.” Specifically, he says the money supply increased by $1.65 trillion in 2025. Quoting the money supply, as he does, in absolute dollar terms is meaningless. To properly gauge money supply growth, one should compare the rate of change in the money supply compared to the economy’s growth rate (GDP). As shown below, M2 grew by 4.27% year over year. Nominal GDP grew by 5.71%. In other words, the money supply grew more slowly than the economy. Furthermore, money supply growth is slightly below the pre-pandemic average, despite a recent uptick in economic growth.
If money grows in line with the economy’s productive capacity, it helps maintain price stability by aligning the money supply with the quantity of goods and services produced and demanded. When money grows faster than real output, inflation occurs. Conversely, when the money supply grows more slowly than GDP, liquidity shortages can constrain growth and increase the risk of deflation. Simply put, aligning money supply growth with economic growth supports stable prices, efficient capital allocation, and sustainable long-term expansion. If anything, the fact that money is not growing as fast as the economy should raise disinflationary flags, not “alarming” concern.
What To Watch Today
Earnings

Economy

Market Trading Update
With the S&P 500 closing at 6940 on Friday, the technical conditions reveal a market in a controlled but consolidative state as key milestones approach. The index maintained its uptrend established late last year and into early January, signaling continued bullish momentum as higher highs and higher lows remain intact. This trend is supported by the S&P 500’s recent successful test of the 20-day moving average, with breadth indicators such as advancing stocks and total market participation expanding beyond just mega-cap technology names.

Price action through the week saw the S&P 500 navigate around near‑record levels while consolidating within a tight range just below the psychologically significant 7000 level, which acts as immediate resistance. Both the technical selling and options market dynamics ahead of earnings could just be prepositioning against potential disappointment risk. However, if earnings are better than feared, this could lead to a rather explosive move higher if the rising wedge pattern resolves bullishly. Short‑term momentum indicators on the daily chart suggest neutral to slightly bullish conditions, with the trend slowing but without reversing. The market’s current structure shows typical consolidation behavior after a strong advance, often preceding a continuation rather than an abrupt reversal when broader breadth remains supportive.
On the downside, the index remains supported by key levels that traders and investors should monitor. These include the prior breakout zones and the 50‑day moving average, which has acted as a dynamic support floor through recent pullbacks. A decisive break below these supports could signal a loss of short‑term trend conviction, though weekend risk events, such as geopolitical developments or policy news, could still influence price action once markets reopen after the Martin Luther King Jr. holiday.
From a volatility perspective, U.S. equity volatility metrics remain subdued, although volatility has risen mildly. We could see a further pickup in volatility with earnings season and macroeconomic data releases, which are known to act as catalysts for directional breaks.
In sum, the S&P 500’s technical profile remains constructive but range‑bound near resistance. Support levels are holding for now, and trend measures remain bullish above the key breakout levels. The next directional move will likely hinge on the market’s ability to clear resistance above 7000 or to test deeper support levels that define the current trend structure.
KEY TECHNICAL LEVELS – S&P 500 Index (SPX)
| Level | Role | Comment |
|---|---|---|
| 7100 | Next resistance | Next upside extension above a 7000 breakout |
| 7000 | Immediate resistance | Psychological barrier near all‑time high |
| 6940 | Friday close level | Current trading pivot |
| 6909 | Near‑term support | 20-day moving average |
| 6829 | Secondary support | 50-day moving average |
| 6742 | Deeper support | 100-day moving average |

The Week Ahead
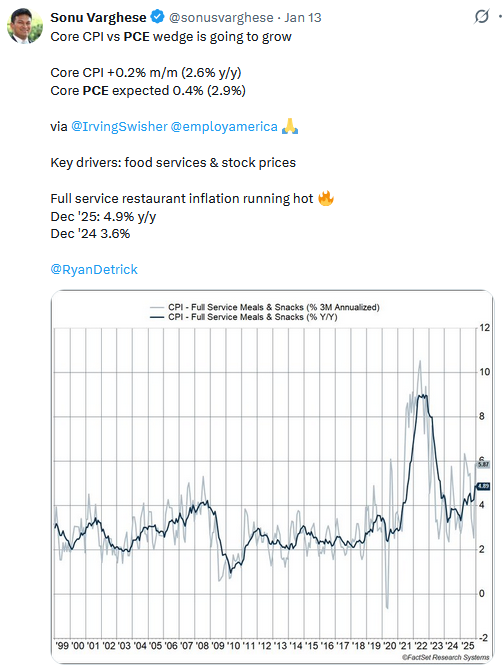
The highlight of the holiday-shortened week will be Thursday’s PCE prices data. Given the recent positive inflation data from the BLS, investors will look for confirmation in PCE. Bear in mind that the Fed relies most heavily on PCE prices, not CPI. The consensus estimate has Core PCE at +0.4% monthly and 2.9% annually. This would indicate slightly higher inflation than the CPI.
The Fed will be in its media blackout period this week as they approach next week’s FOMC meeting. As we share below, the odds of a rate cut at this meeting are a mere 5%.
The pace of earnings announcements will increase this week.
- Tuesday: Netflix, MMM, and United Airlines
- Wednesday: J&J, Charles Schwab, Kinder Morgan
- Thursday: Visa, P&G, Abbott, Intel, and Southwest Air
- Friday: NextEra, Schlumberger

AI Productivity, Employment, and UBI
It is expected that AI productivity increases will vastly transform the U.S. economy. Firms are utilizing AI productivity enhancements to automate repetitive tasks, and research and coding functions have already been implemented. The obvious problem is that when machines perform functions once done by humans, what are the humans supposed to do for income? This increase in AI productivity is measurable across various sectors, as supply chains operate more efficiently, data analysis accelerates, and customer service utilizes automated agents to streamline tasks. Manufacturing, once considered a stable sector of the economy, is increasingly using robotics to reduce labor costs. Professional services are also increasingly displacing workers in medical, legal, and other areas of the service economy to improve output (read: profits) per worker.
This is not a new thing. It has been accelerating since the invention of the fax machine and phone answering devices. The use of AI productivity-enhancing technology is becoming increasingly apparent. But as shown, the shift by corporations to focus on worker productivity is ongoing.

Recent corporate statements confirm this shift. At a 2025 financial conference, JPMorgan Chase reported that AI adoption doubled productivity gains in certain operations from 3% to 6%, with some roles seeing efficiency increases of 40% to 50%. Other banks said AI allows them to accomplish more work with the same headcount.
In theory, the promise of AI productivity increases is alluring. While firms can produce more with fewer inputs, humans will have more time to pursue education, leisure, and spend time with their families, increasing overall health and happiness. Again, that is theory, and the subject of today’s commentary.
Tweet of the Day
“Want to achieve better long-term success in managing your portfolio? Here are our 15-trading rules for managing market risks.”
Please subscribe to the daily commentary to receive these updates every morning before the opening bell.
If you found this blog useful, please send it to someone else, share it on social media, or contact us to set up a meeting.

