
If Congress can’t come to a budget resolution in the next 24 hours, the government will shut down. Sound familiar? We have become numb to the prospect of a government shutdown because it occurs so frequently. Most often, continuing resolution bills are agreed upon before a shutdown, thus enabling the government to continue operating. In all but three of the last 47 years, a continuing resolution bill has provided “temporary” funding. 1997 was the last year that Congress actually agreed upon a budget. The graph below, courtesy of Statista, illustrates the 21 instances of government shutdowns that have occurred since 1976.
The media is once again making a big deal about the potential for another government shutdown. While a government shutdown may have negative consequences for government workers and employees working in industries closely tied to the government, the economic impact is likely to be minimal. This is especially true if the shutdown only lasts a few days. However, as we share in the Tweet of the Day below, the BLS will not release the employment report if the government is closed.
From a stock market perspective, the 21 shutdowns shown below have had a negligible effect. In fact, on average, the S&P 500 has gained 0.5% during shutdowns since 1976. The most recent, in December 2018, was the longest on record. Yet it also had the highest stock market return at 6.9%. Of the 21 instances, the maximum loss over the shutdown period was 3.4% (October 10, 1976). Moreover, 71% of the cases posted a positive return. If this instance is like the others, investors should not fear a shutdown.

What To Watch Today
Earnings

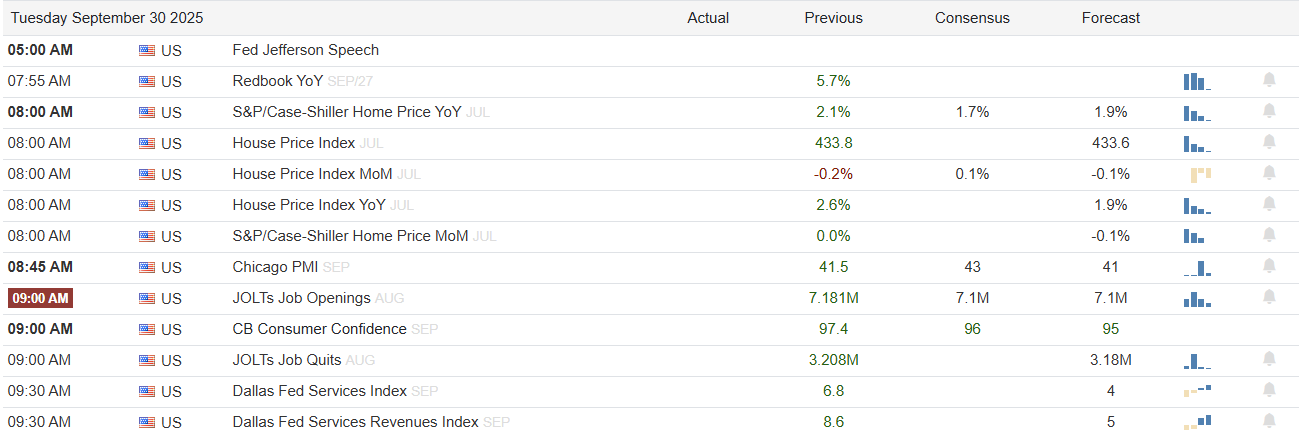
Economy
Market Trading Update
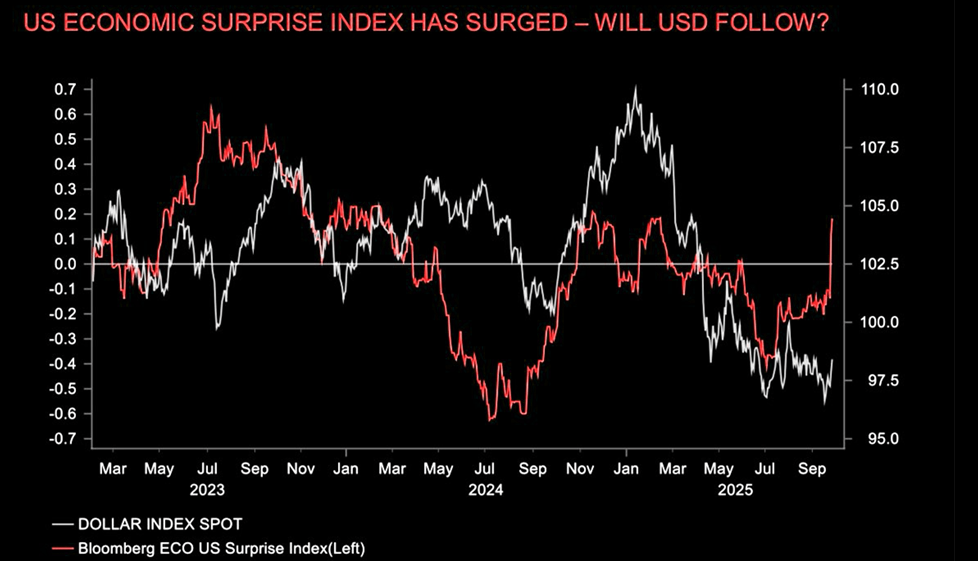
Yesterday, we provided the technical update for the week. One trade that is setting up to be much more bullish is the US Dollar. First of all, the dollar has been in a long basing period and has worked off the massive overbought condition from the last rally in 2022, as shown. With the dollar turning up on a weekly MACD buy signal and improving weekly RSI from low levels, the setup for a stronger dollar trade is improving.

Secondly, as with Trump’s first term, the second year of the Presidency, as policy begins to show positive economic impacts, has also been a bullish backdrop. Given that economists are expecting a resurgence of economic growth next year, such a trend would also correspond with a stronger dollar.
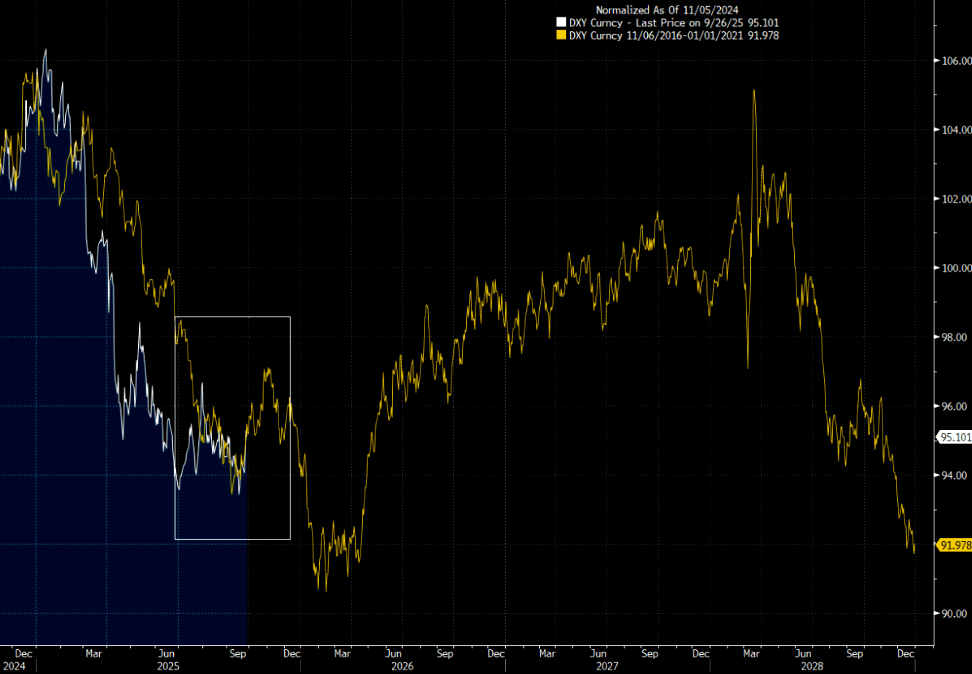
Furthermore, given the massive short position against the dollar right now, a reversal to catch up with economic strength would provide a significant tailwind as hedge funds begin to short-cover their positions.
With the stronger dollar trade beginning to show some strength, particularly given that the dollar tends to rally following Fed rate cuts, there is a negative consequence. A strong dollar will impact corporate profit margins, particularly for multinationals, and will also work against dollar-denominated trades. As such, investors should examine their portfolios for risks that have developed with the reversal of the previously overbought dollar, to now very oversold.
Such reversals are often the thing that surprises complacent investors the most.

Bad Breadth In Context
In yesterday’s Commentary, we noted the market’s bad breadth as follows:
Furthermore, breadth remains weak, with only about 49% of S&P components above their 20-day average and only 56% above their 50-day average. With markets consistently hitting new highs, the breadth should be much stronger. Negative divergences continue in momentum and relative strength oscillators (RSI, MACD), hinting at waning upside pressure.
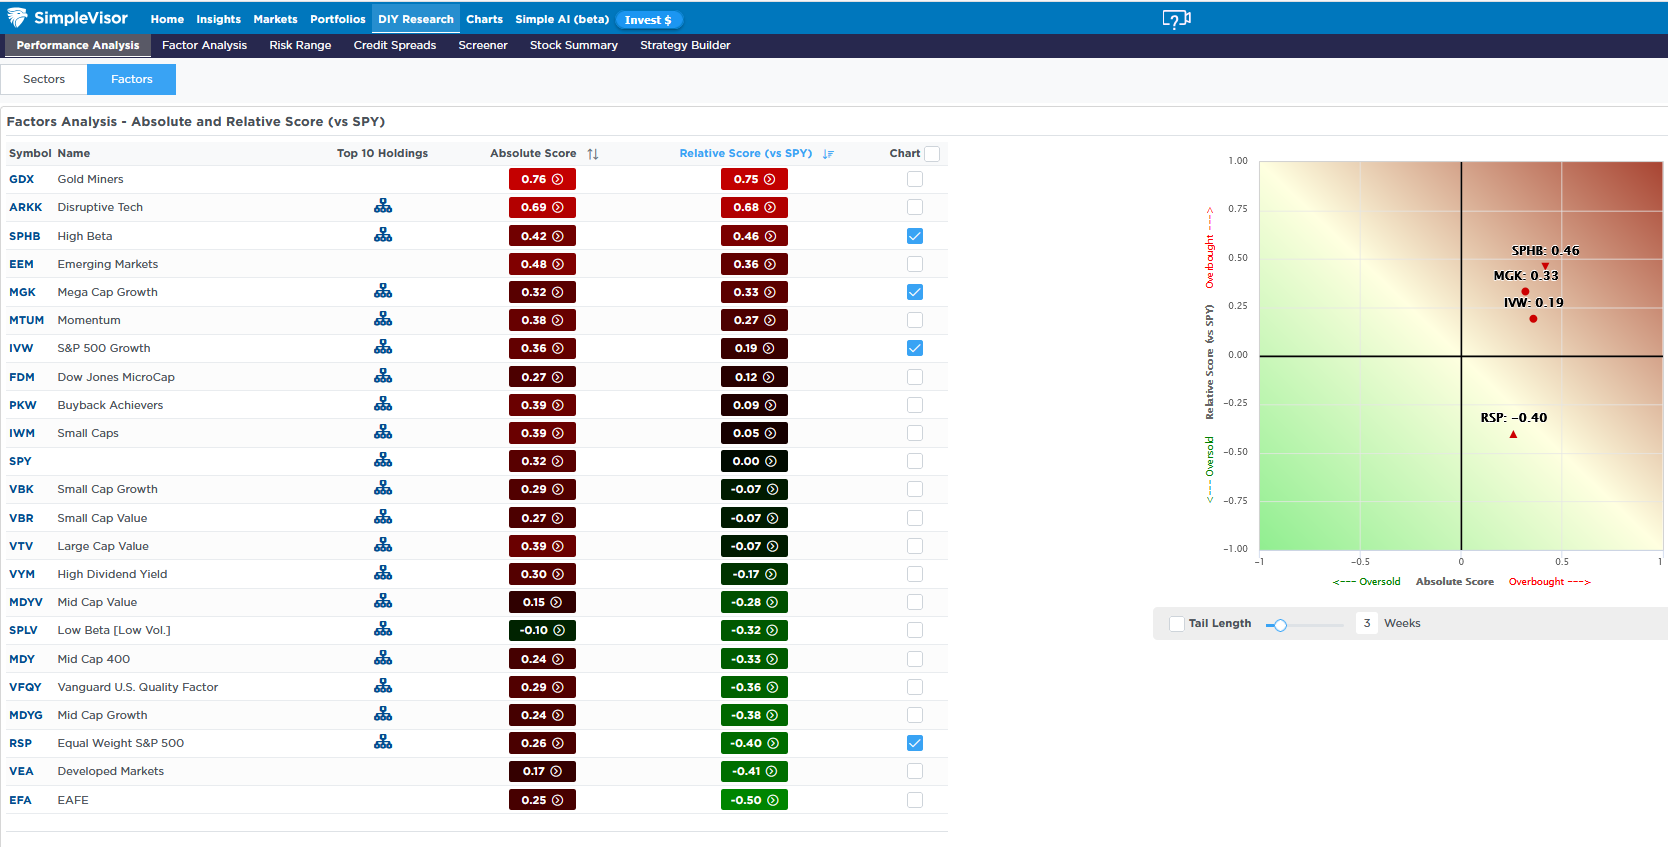
Further evidence can be found in the SimpleVisor relative analysis tool. Note that in the first graphic, the S&P 500 equal-weighted ETF (RSP) is the third most oversold factor. At the same time, the S&P 500 growth, mega-cap growth, and high beta are among the most overbought. For context on the relationship over the last year, we share two more graphics from SimpleVisor. As we highlight, the second graphic shows that the correlation between the excess returns of RSP and the mega-cap and large-cap growth ETFs is running negative and at about half to two-thirds of one standard deviation below normal. In other words, the relationship is not average, but neither is it statistically lopsided. The third graphic displays a graph illustrating the correlation’s position relative to all other instances over the past year. As we circle, it is in the lowest 25% of instances. This does point to bad breadth, but the market has certainly seen worse over the last year.


RSI (Relative Strength Index): Timing The Next Correction
In the world of technical analysis, there is one reliable indicator for measuring market risk. The relative strength index (RSI) measures overextension (in either direction). Developed by J. Welles Wilder in 1978, the RSI is a momentum oscillator. As such, it measures the velocity and magnitude of price changes, plotting those on a scale from 0 to 100.
At its core, the RSI compares the magnitude of recent gains to recent losses over a chosen lookback period. Investors commonly use a lookback period of 14 days to estimate whether a market (or stock) is overbought or oversold. Readings above 70 are often flagged as “overbought,” while readings below 30 are considered “oversold.” The chart below shows a stock market sample versus the 14-day RSI.

Why is it so helpful? Learn Why
Tweet of the Day
“Want to achieve better long-term success in managing your portfolio? Here are our 15-trading rules for managing market risks.”
Please subscribe to the daily commentary to receive these updates every morning before the opening bell.
If you found this blog useful, please send it to someone else, share it on social media, or contact us to set up a meeting.

