
🔎 At a Glance
- Subprime Crises 2.0: Will Private Credit Be The Trigger
- Market Brief & Technical Review
- From Lance’s Desk: Rubino: Fiat Currencies Are In A Death Spiral – RIA
- Market stats, screens, and risk indicators
🏛️ Market Brief – A Tough Market Week
This past week was another disappointing one. Markets opened the week surging after President Trump posted on Truth Social that U.S.-Iran talks had been “very good and productive” and that he was halting strikes on Iranian power plants. Brent crude fell more than 10% in a single session, its biggest single-day drop since early March, while the S&P 500 gained 1.15%. It was the kind of relief rally that tempts investors into believing a corner has been turned. It wasn’t.
By Wednesday, Iran had rejected the U.S. ceasefire proposal as “one-sided and unfair.” Oil reversed and climbed higher. Then, Thursday delivered the gut punch with the S&P 500 falling 1.7%, its worst single-session decline since the war began. With that, the market failed to hold the 200-day moving average on the retest. Investors hit the “sell” button across asset classes in a rush for liquidity. It was a tough week all around.
The macro backdrop darkened further. Futures markets pushed the probability of a Fed rate hike by year-end to 52%, which is the first time it has crossed the 50% threshold, as Brent topped $110 and inflation fears intensified. The OECD also sharply revised its 2026 U.S. inflation forecast to 4.2%, up from the Fed’s 2.7% projection. Consumer sentiment reflected the pain, with the University of Michigan’s final March reading falling to 53.3. Year-ahead inflation expectations also stalled at 3.4% after six consecutive months of declines, driven almost entirely by the post-conflict gasoline shock.
Outside of Iran, the news didn’t get much better. The ongoing private credit deterioration, the subject of today’s commentary, continued. Apollo Global Management capped redemptions on its $25 billion Apollo Debt Solutions BDC after withdrawal requests reached 11.2% of shares, more than double its 5% quarterly limit, and paid investors roughly 45 cents on the dollar for deferred requests. Aries Capital Management also capped withdrawals as well. Overall, the private credit contagion, which began with Blue Owl in February, has now spread to Blackstone, BlackRock, and Apollo, which are the industry’s largest names.
Overall, what this past week made unmistakably clear is that the market is no longer trading on earnings, valuations, or Fed guidance. It is trading on oil, and oil is trading on the Strait of Hormuz. Until there is durable evidence of de-escalation, with a cessation of hostilities and a reopening of energy shipping lanes, every rally should be treated as a trade, not a trend. The 200-day moving average has been breached, and as noted last Monday, a sustained period below that level has consequences for forward returns. The question heading into next week is not whether to be cautious, but how cautious to be.
Which brings us to the market.
📈Technical Backdrop – Market Breaks The 200-DMA
The S&P 500 closed Friday at ~6,370, completing a fifth consecutive weekly loss and putting the index 9.0% below January’s all-time high of 7,002, which is on the doorstep of an official correction. As noted above, this past week was a masterclass in false hope.
The technical picture continues to deteriorate across all time frames except the longest. The index is now 4% below its 200-DMA (~6,620), with the 50-DMA, 100-DMA, and 200-DMA all stacked above as resistance. The VIX topped 31, above 30 for the first time since March 2025, a level that historically precedes tactical bounces of 3–8%. The Relative Strength Index (RSI) is firmly oversold, also suggestive of a reflexive bounce. All that is needed in any positive catalyst to spark a buying frenzy.
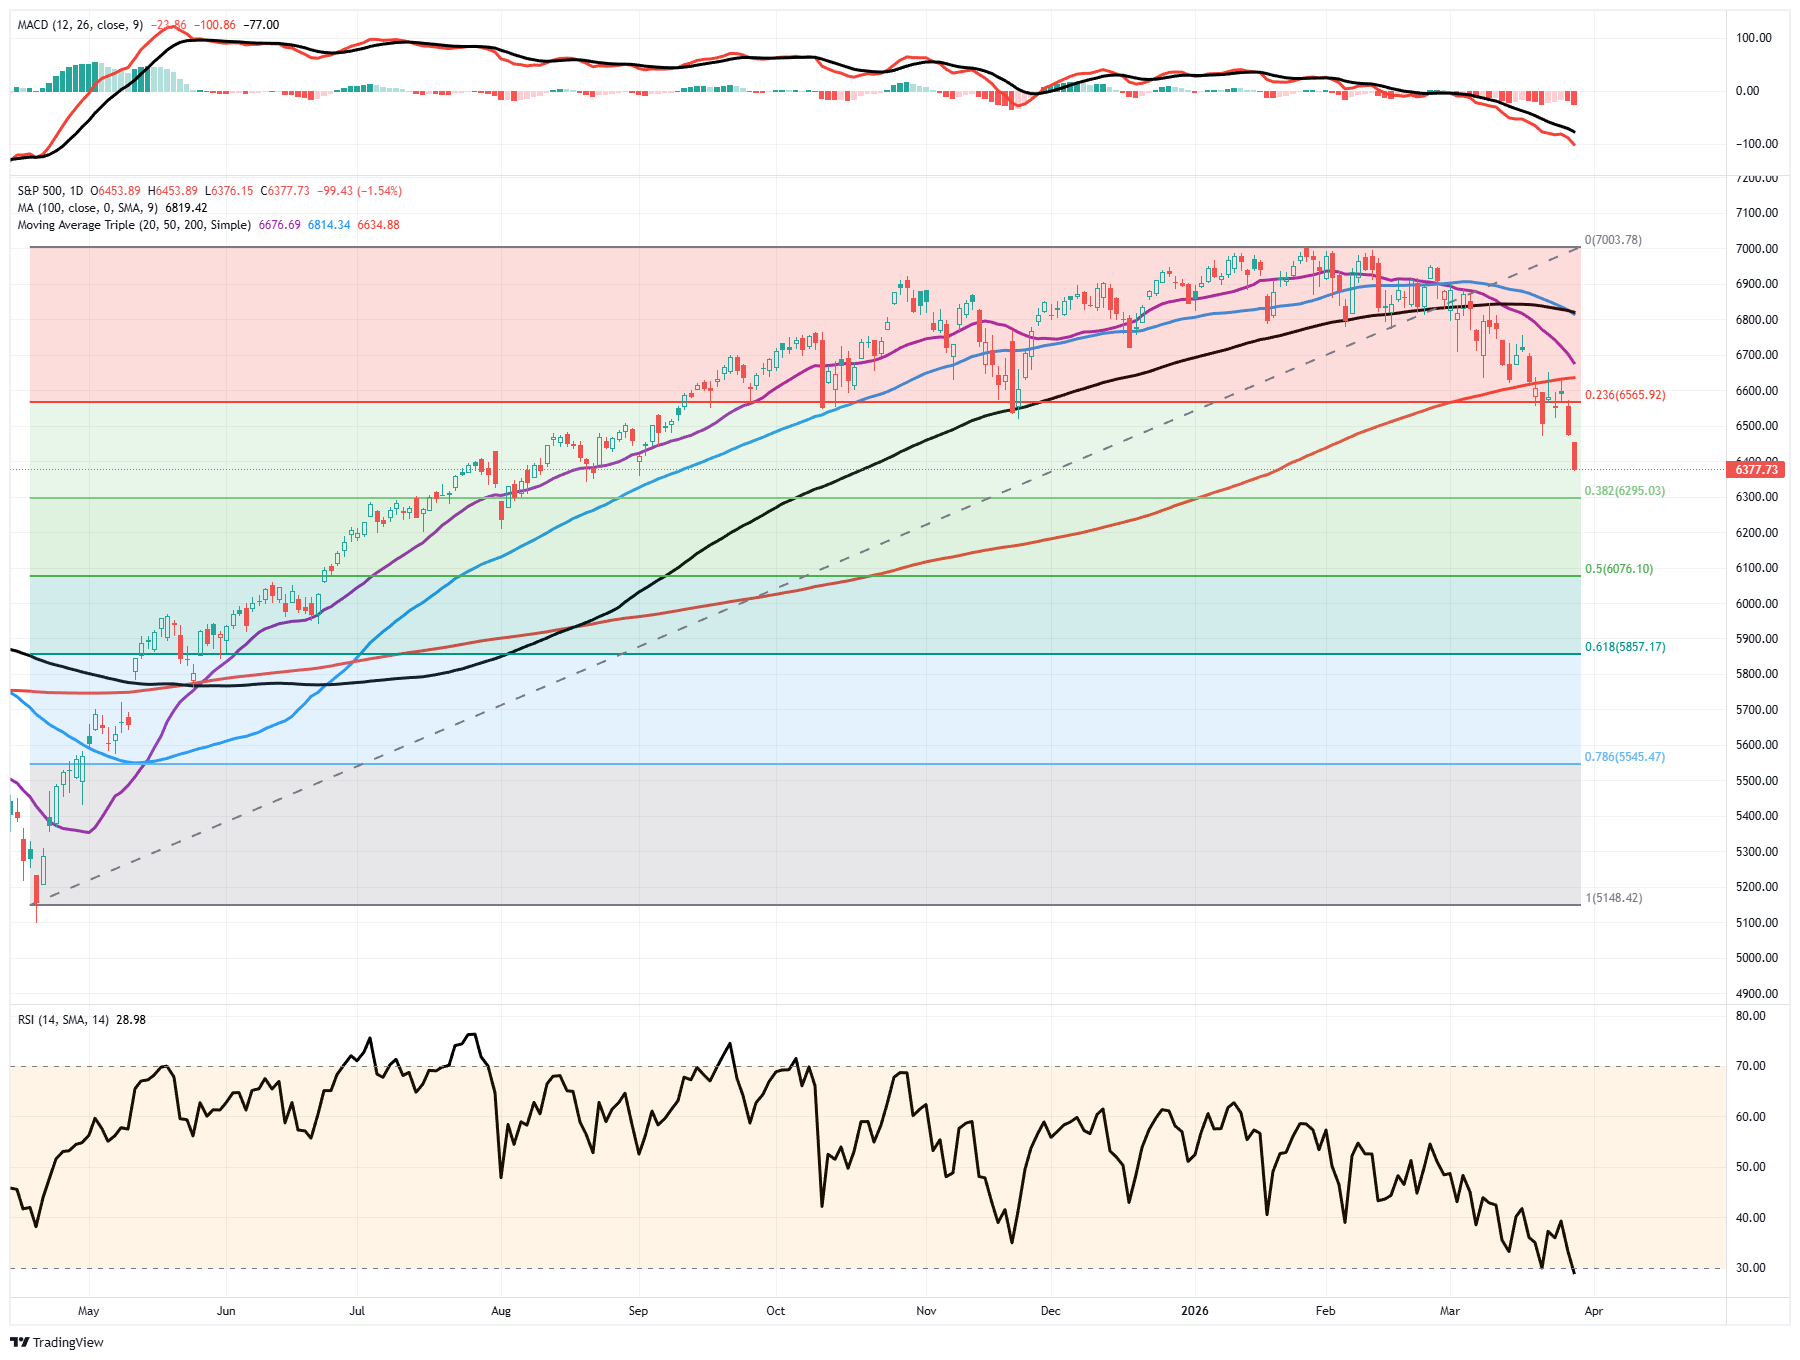
Notably, the MACD remains deeply negative, and every rally attempt this month has been sold within 48 hours. J.P. Morgan captured the paradox: the S&P 500 is down only ~9% despite oil rising 70% and the Fed shifting from pricing two cuts to a 50% probability of a hike, and software falling 20%. As we noted recently, a much larger correction is underway in the market.

Bottom line: We are one bad week from an official 10% correction. The 200-DMA break data we reviewed two weeks ago suggested a 10–15% further drawdown before a durable bottom, and we’re tracking right through that range. Wells Fargo’s worst-case scenario of 6,000 is no longer abstract. With the VIX above 30 and the RSI in oversold territory, the market is building conditions for a tradeable bounce. The emphasis on tradeable, not durable.
Use rallies to reduce risk and rebalance exposures for now. However, start building the shopping list, so you’re ready when the market bottom becomes clearer. Consider accumulating quality companies at pre-defined levels (6,300, then 6,000–6,100). At the moment, we don’t have the signs of a durable bottom. Oil needs to find a ceiling, and the VIX needs to reverse below 20.
For now, it remains defense over offense. Trade accordingly.

🔑 Key Catalysts Next Week
This is the most structurally loaded week of the quarter. The calendar stacks a Q1 close, a Q2 open, and a full employment gauntlet into five sessions, with markets still metabolizing whatever the Fed just delivered.
Tuesday is the pivot. Consumer Confidence is the marquee release, and it’s the first full-month reading that captures the Iran conflict, the tariff widening, and February’s payroll shock in a single survey. The prior print of 91.2 was already soft. The Expectations component, which the Conference Board flags as a recession signal below 80, is the number to watch. A sharp drop would validate the stagflation fears the Fed just tried to navigate around. Chicago PMI and Case-Shiller Home Prices round out the morning, and then Q1 closes at the bell. Expect elevated volume as pension funds and mutual funds finalize window dressing and mark final positions, totaling roughly $62 billion on the buy side.
Wednesday flips the calendar to Q2 and immediately delivers a triple shot: ADP private payrolls, ISM Manufacturing, and JOLTS. After February’s -92,000 NFP shock, the ADP print will either stabilize the labor narrative or accelerate the deterioration thesis. ISM Manufacturing is the tariff passthrough read, the Prices Paid subindex will tell us whether producers are eating costs or passing them through, while New Orders reveal whether demand is contracting under policy uncertainty. JOLTS completes the picture with the openings-to-unemployed ratio that the Fed uses to assess labor market slack.
Friday is the week’s anchor: March Nonfarm Payrolls. February was distorted by a Kaiser Permanente strike and severe weather, giving bulls a one-month excuse. If March payrolls bounce back above 100,000, the “transitory weakness” camp wins. If they print flat or negative again, the labor market deterioration becomes undeniable, and the pressure on the Fed to act, despite sticky inflation, becomes immense. ISM Services PMI that morning adds the services-sector inflation read alongside Wednesday’s manufacturing data.

Need Help With Your Investing Strategy?
Are you looking for comprehensive financial, insurance, and estate planning services? Need a risk-managed portfolio management strategy to grow and protect your savings? Whatever your needs are, we are here to help.

💰 Will Private Credit Trigger The Next Subprime Crisis?
We have recently tackled the rising stress in the Private Credit markets. Here are a few of our previous warnings:
- Fitzpatrick: Soros CEO & CIO Warns of a Reckoning
- Private Credit Stress: Will The Fed Backstop Exuberance Again? – RIA
- Is Private Equity A Wolf In Sheep’s Clothing?
After 30 years of watching credit cycles expand, distort, and collapse, I’ve learned one reliable rule:
“When enough people start drawing comparisons to 2008, it’s worth stopping to check whether the analogy holds up — or whether fear is doing the analytical work for them.”
Right now, judging by the amount of commentary on social media, the stress in the private credit market has everyone’s attention. Most of the commentary being generated makes the immediate jump from private credit firms “gating” exits to the onset of the next subprime crisis in the financial system. Those claims are certainly alarming and generate many clicks and views, but the question is whether those claims are based on facts rather than opinions.
Just recently, Goldman Sachs CEO David Solomon flagged the risk of private credit in his annual shareholder letter. Lloyd Blankfein, who piloted Goldman through the Global Financial Crisis, warned publicly that the financial system appears to be “inching toward another potential catastrophe.” Meanwhile, Goldman’s own research arm published a note concluding that private credit stress is “unlikely to generate large macroeconomic spillovers on its own.”
So which is it? A repeat of the subprime crisis of 2008, or a painful but contained credit cycle? The honest answer most likely sits somewhere in between, and understanding exactly where private credit differs from subprime tells you a great deal about how worried you should actually be.
Let’s revisit 2008.
What Made The Subprime Crisis So Catastrophic
It is hard to believe that we are rapidly approaching the 20-year anniversary of the “Great Financial Crisis” that nearly destroyed the financial system as we knew it. There are many investors and commentators in the markets today who only know about the event from reading history books. Having lived through it, it is a different reality.
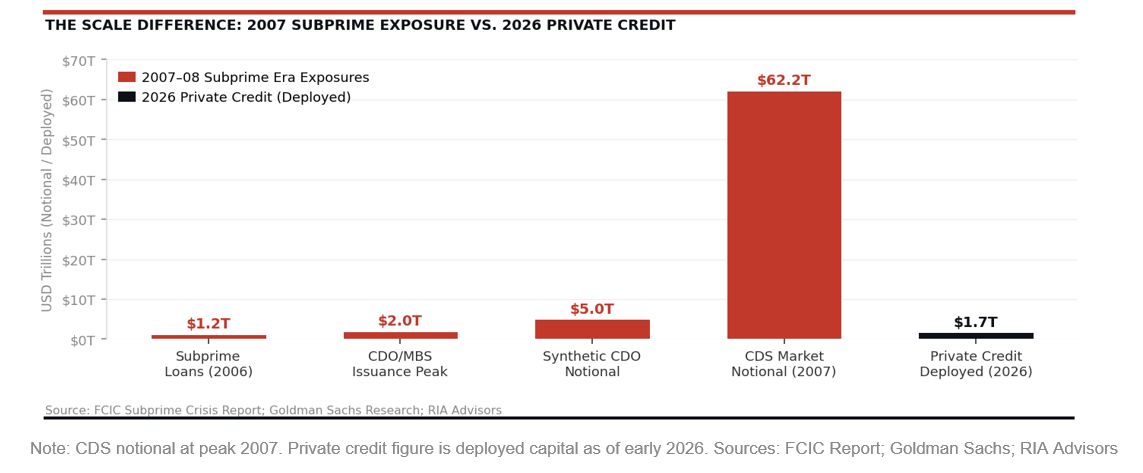
Crucially, the 2008 subprime crisis wasn’t simply a mortgage problem. It was a leverage-and-derivatives problem that started in mortgages. That distinction matters enormously when you’re sizing up today’s private credit stress.
At the heart of the crisis was a product called the collateralized debt obligation, or CDO. Banks packaged pools of subprime mortgages into tranches, which were rated by agencies using flawed models. Those CDOs were then re-sliced into “CDO squared” structures, layering additional complexity and opacity on top of already opaque assets. The real acceleration came when synthetic CDOs entered the picture. Unlike cash CDOs, which required actual mortgages, synthetic CDOs referenced mortgages through credit default swaps. Journalist Gregory Zuckerman found that while roughly $1.2 trillion in subprime loans existed in 2006, synthetic structures created more than $5 trillion in exposure referencing those same loans. The CDS market alone reached a peak notional value of $62.2 trillion by year-end 2007. That is not a typo.
But the derivatives machine required raw material to function, and Wall Street’s insatiable hunger for collateral triggered what historians of the crisis now call the “race to the bottom” in mortgage underwriting. To keep the CDO assembly line running, originators needed volume. That demand for volume led to a collapse in underwriting standards. By 2006, no-money-down mortgages were commonplace.
- NINJA loans, “No Income, No Job, No Assets,” were extended to borrowers who could not remotely service the debt once introductory teaser rates reset.
- Stated-income loans, in which borrowers self-reported earnings with no verification, became the industry norm rather than the exception.
- Adjustable-rate mortgages were sold to buyers who qualified only at the teaser rate and had no capacity to absorb resets of 3 to 4 percentage points two years later.
The Mortgage Bankers Association later estimated that subprime originations reached $600 billion in 2006 alone, up from roughly $160 billion in 2001. Most importantly, the loans were designed to be sold, not held. In other words, the originator of the loan bore no long-term risk and had every incentive to close as many transactions as possible, regardless of quality.
That single misalignment of incentives was the original sin of the entire subprime crisis.
What compounded the damage beyond even that was systematic, institutionalized fraud at the origination and securitization level. The Financial Crisis Inquiry Commission documented widespread “robo-signing,” where bank employees executed thousands of mortgage documents per day without reviewing them. They affixed signatures and notarizations to paperwork they had never read. Countrywide Financial, Washington Mutual, and others were found to have misrepresented loan quality in the representations and warranties they made to investors purchasing MBS tranches, fraudulently inflating the apparent collateral quality of the pools they sold.
Appraisers faced pressure, and in many cases direct financial incentive, to hit predetermined valuations that supported loan amounts the underlying properties could never justify. The FBI reported that mortgage fraud suspicious activity reports increased by more than 1,400% between 2000 and 2007. When losses eventually surfaced, investors discovered they had purchased securities backed not just by bad loans, but by fraudulently documented ones. That distinction made recovery values nearly impossible to model and turned settlement litigation into an industry unto itself for a decade afterward. JPMorgan alone paid $13 billion in 2013 to resolve government claims over mortgage securities, and that figure represented only a fraction of industry-wide settlements.
When housing prices began falling, that entire structure detonated in both directions simultaneously. Banks that held CDO tranches faced mark-to-market losses. Banks that sold CDS protection, AIG being the most famous, faced collateral calls they couldn’t meet. Here is the most crucial point. These instruments traded freely in liquid markets, so price discovery occurred in real time, compressing the panic into a matter of weeks. The interconnection was total. Twelve of the thirteen largest U.S. financial institutions were at risk of failure, according to then-Fed Chair Ben Bernanke.
That’s what systemic risk actually looks like.
Private Credit Stress Is A Different Animal
The private credit market now stands at roughly $1.7 to $2 trillion in deployed capital, a figure that has grown rapidly since banks retreated from middle-market lending after the Global Financial Crisis. That growth is precisely what generated the current stress. Redemption requests have surged across major platforms. Blackstone’s BCRED fund saw record redemptions of $3.8 billion in Q1 2026, exceeding its 5% quarterly buyback limit. Apollo, Blue Owl, and Morgan Stanley’s North Haven fund have all imposed withdrawal restrictions. That gating of withdrawals led to an obvious decline in inflows across retail private credit funds. Those inflows fell to roughly half their 2025 pace, according to Goldman Sachs estimates.
So far, the catalyst is concentrated in software companies, which represent an estimated 15% to 25% of many private credit portfolios. They are under pressure as AI disruption fears potentially erode their earnings power and their ability to service debt. The headline default rate sits around 2% as of 2025, but Goldman Sachs Asset Management’s own research acknowledges that figure understates the true level of stress. When you include liability management exercises and distressed exchanges, the real rate approaches 4% to 5%. That’s meaningful deterioration. It’s not catastrophic, but it’s real.

J.P. Morgan’s analysis showed that for senior direct lending to produce negative total returns, default rates would need to exceed 6% while recovery rates would collapse below 40% simultaneously. Those numbers have historically appeared only during COVID and the Global Financial Crisis itself. That’s a high bar — but it’s not an impossible one. However, that would require a deterioration in macroeconomic conditions, a continuation of the Iran conflict oil shocks, and a contraction of consumer spending, which could certainly amplify risks. As shown below, the current structural comparison between the subprime crisis and the private credit sector today is markedly different.

The Importance of the Gating System
The most structurally significant difference between 2008 and today is also the one that generates the most debate. Unlike the subprime crisis, private credit funds can gate their exits. When Blackstone caps BCRED redemptions at 5% per quarter, it’s not a failure of the fund; it’s the mechanism working as designed. In 2008, there was no such circuit breaker. MBS and CDOs traded continuously in secondary markets, meaning every forced seller found a bid at a lower price, triggering more mark-to-market losses, which in turn triggered more forced selling. The feedback loop was instantaneous and brutal.
Gating slows that process considerably. LPL Research noted that while gating makes for terrible headlines, it prevents the forced liquidation that accelerated subprime losses. Goldman Sachs estimates that retail private credit inflows will remain in net outflow throughout 2026 and likely into 2027, a slow bleed, not a cliff. That’s a very different contagion profile.
That said, gating is not a cure. It transfers the problem in time, not away from investors. Those sitting in redemption queues face a multi-year wait to exit positions that may continue to deteriorate. The opacity of private credit portfolios and manager-reported valuations means stress can accumulate invisibly until it can’t.
“The key risk in private credit is not what is visible, but what remains hidden.” – The Daily Economy
Goldman Sachs economist Manuel Abecasis concluded that, even in an adverse scenario, private credit stress would only drag on GDP by 0.2% to 0.5%. His reasoning is straightforward: the private credit sector holds about $1.7 trillion in levered loans, or roughly 4% of all credit to the private non-financial sector. That’s is not nothing, but it’s not the $62 trillion CDS market either. Goldman also notes that bank lending to businesses has actually accelerated recently, providing a partial offset if private credit tightens.

Blankfein’s view carries different weight precisely because he’s been through the real thing. He warned that private credit assets “can be hard to analyze, may feature hidden leverage, and can become tough to sell.” He’s right that opacity and illiquidity create conditions where problems compound before they surface. The question is whether those conditions, combined with a still-manageable scale, produce systemic contagion or simply painful losses for a subset of investors.
“Private credit stress is unlikely to generate large macroeconomic spillovers on its own.” — Goldman Sachs Economist Manuel Abecasis, March 2026
I’m inclined to side with Goldman’s macro conclusion. However, with a caveat that matters. The base case holds only so long as private credit problems don’t compound with a broader recession, a sustained oil shock from the Iran conflict, and a sharper-than-expected deterioration in software company cash flows. Any two of those three conditions occurring simultaneously change the calculus. Goldman’s own research acknowledges this. The bigger risk isn’t private credit alone. It’s private credit stress coinciding with the wider tightening of financial conditions.
What Investors Should Pay Attention To
The structural differences between today and the subprime crisis are real and important. There’s no synthetic subprime CDO chain multiplying private credit losses to a $5 trillion notional exposure. Most critically, the investor base is primarily institutional, not retail money market funds holding fraudulently rated paper. Fund-level leverage is modest, and the gating mechanism, whatever its imperfections, prevents the instantaneous price cascade that made the subprime crisis so destructive.
What this most closely resembles is a normal credit cycle playing out in an untested asset class. Not a systemic collapse, but not a benign correction either. Goldman Sachs Asset Management’s own European research found that “stress events are likely to remain elevated relative to the last decade,” concentrated in smaller companies and cyclical sectors. That pattern will probably hold in the U.S. as well.
Three things would change my view and warrant genuine alarm.
- First, if default rates push past 8% in tech-heavy private credit portfolios as AI disruption accelerates.
- Second, if bank credit facilities to private credit managers get pulled at scale, triggering forced asset sales.
- Third, retail penetration of private credit grows, as institutional investors sell, leaving less-sophisticated money to hold the bag.
None of those conditions is inevitable. All of them are possible.
The subprime crisis analogy fails on the specifics. But the lesson from the subprime crisis isn’t about CDOs. It’s about what happens when credit markets expand rapidly, underwriting discipline erodes under competitive pressure, and opacity masks deteriorating loan quality. On those broader conditions, the warning is more relevant than the Goldman bulls would like to admit.
That is why we continue to underweight risk for now until we have better clarity about the future.
🖊️ From Lance’s Desk
This week’s #MacroView blog digs into John Rubino’s recent thesis that fiat currencies have now entered into a ‘death spiral.”

Also Posted This Week:
- Will AI Trigger The Next Great Depression? – RIA – by Michael Lebowitz
- The 200-DMA Just Broke: What Every Investor Should Know – RIA – by Lance Roberts
📹 Watch & Listen
We discuss the attack on the 200-DMA and what traders should be looking for next.
Subscribe To Our YouTube Channel To Get Notified Of All Our Videos
📊 Market Statistics & Analysis
Weekly technical overview across key sectors, risk indicators, and market internals

💸 Market & Sector X-Ray: Market Cracks Support
Last week’s continued selling pressure pushed every market and sector, except for Energy, again, back into very oversold territory. As noted last week, the extreme bifurcation in Energy will reverse sharply when the conflict settles, allowing profits to be taken and holdings to be rebalanced accordingly. With every other sector extremely oversold, the logical setup now is for that rotation out of energy into other areas of the market to begin as soon as clarity on Iran emerges.

📐 Technical Composite: 23.98 – Market Very Oversold
The Iran conflict continues to weigh on risk appetite. Oil prices remain the key driver for the markets in the near term. As the market approaches oversold levels, the odds of a reflexive rally are increasing. We are currently at levels we haven’t seen since 2022.

🤑 Fear/Greed Index: 50.71 – Sentiment Reverses Sharply
This past week, sentiment continued to drop as expectations of global economic outperformance faded. The Iran conflict continues, and energy prices remain elevated, pushing investors to become increasingly cautious. While not at “fear levels” yet, the selloff has been rather sharp, so a reflexive rally is likely before a further decline.

🔁 Relative Sector Performance
The market continued to correct this past week, as we discussed over the last two weeks, which was possible. Technology and Communications are now the most oversold. As noted by the red circle, Energy is extremely overbought. Given the divergence between Energy and the rest of the market, profit-taking in Energy seems prudent, and nibbling at really oversold areas of the market may be opportunistic.

📊 Most Oversold Sector Holdings
As noted, the Technology sector is now the most oversold. MSFT, NVDA, AVGO, and MU have been hit the hardest as of late due to ongoing concerns about private credit and AI revenue growth. However, mostly the selloff has been a rapid need for liquidity as markets have declined. However, the deep oversold conditions are now presenting some compelling opportunities when the market bottoms.

📊 Sector Model & Risk Ranges
Both the Dollar and Energy remain well outside their respective risk ranges, suggesting that reversals are likely if there are any short-term resolutions in Iran. Outside of those two sectors, the massive deviations we saw in other sectors have all been reversed, which is why we repeatedly warned to take profits in those areas. The probability of a rather strong reflexive rally is building, particularly as we move into April.

Have a great week.
Lance Roberts, CIO, RIA Advisors

