
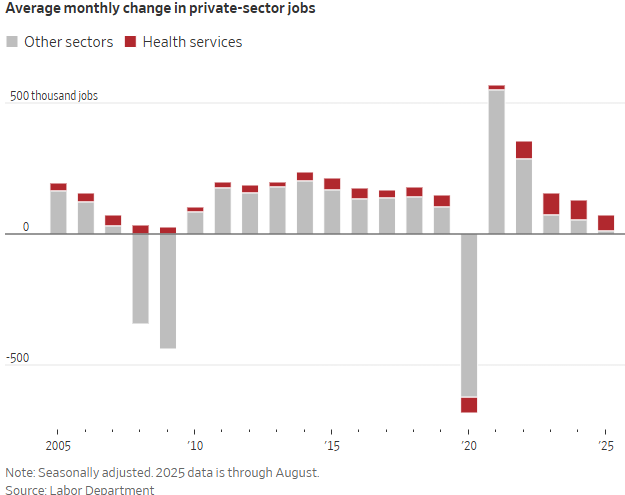
The August jobs report clarified what many investors already suspect: the U.S. labor market is stalling. Outside of healthcare and social assistance, private-sector job creation has nearly flatlined this year. So far in 2025, the economy has added an average of 74,000 private-sector jobs per month. Stripping out the ~64,000 monthly additions from healthcare jobs, the rest of the economy added just 9,400 jobs on average. In other words, without the healthcare jobs, payroll growth would be essentially zero. The chart from the Wall Street Journal below illustrates healthcare’s increasing proportion of total job growth since the COVID-19 pandemic.
Healthcare’s resilience isn’t new. Thanks to aging demographics and steady demand for essential services, it’s sporting a long trend of steady growth. Today, the sector employs 23.5 million Americans, about one in six private-sector workers. However, questions are growing about how much longer it can prop up the broader market. Upcoming cuts to Medicaid, which could total $911 billion over the next decade, threaten hospitals and nursing homes that rely heavily on government support. At the same time, labor shortages and immigration restrictions may strain the sector’s ability to keep expanding.
The good news is that healthcare jobs are unlikely to shrink outright. With an aging population and persistent demand for health services, growth should remain positive. However, job creation could deteriorate further if the sector slows while other industries remain weak. For markets, that raises the risk that softer employment data starts pressuring earnings estimates—and by extension, today’s lofty equity valuations.
What To Watch Today
Earnings

Economy
Market Trading Update
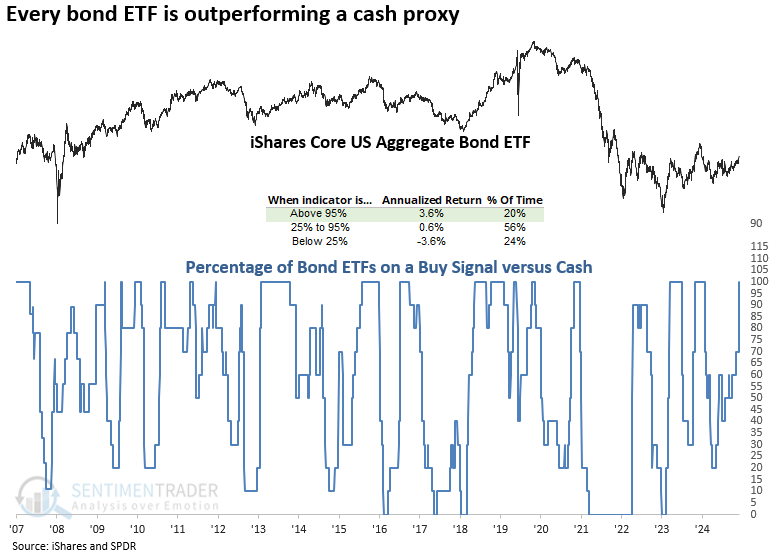
Yesterday, we discussed that the latest employment report shows that the weakness in the economic dynamics is starting to feed into bonds. Most importantly, today, we will see the annual revisions to the employment data, which could potentially paint a much weaker outlook. As Sentimentrader.com noted yesterday, bonds are now significantly outperforming cash, which could act as a vacuum as investors shift from money markets to longer-duration bonds to capture both appreciation and higher yield.
“The chart below shows that when all bond systems remained on a buy signal versus cash, the iShares Aggregate Bond ETF (AGG) delivered an annualized return of 3.6%, notably outperforming periods when fewer systems were aligned.”
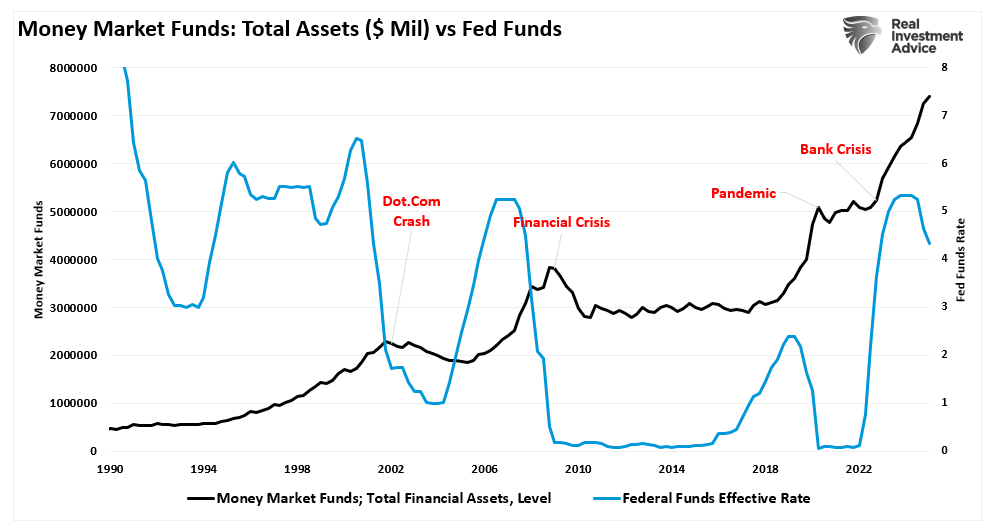
This makes sense, given that money market rates are tied to the Fed funds rate. When the Fed cuts rates, money market balances tend to decline and stabilize. While money market fund balances rise over the long term as corporations, institutions, and pensions hold cash for needs, some of that balance will switch from money markets to bonds for higher yields.
Furthermore, as the Fed cuts rates, longer-duration bond yields will fall, particularly as economic growth slows. However, one area to watch closely is high-yield (aka Junk bonds), which are susceptible to slowing economic growth. Regarding the stock market, it is worth paying attention to junk bonds as they are often an early warning indicator. As Sentimentrader.com noted:
“On Friday, the spread between 52-week highs and lows for high-yield bonds surged to its 4th-highest level on record. While employment trends remain a concern, junk bond traders show little sign of worry. Historically, the S&P 500 has never peaked when this spread was as elevated as it is now. Furthermore, the IBOX High-Yield Index closed at a record high to end the week.”
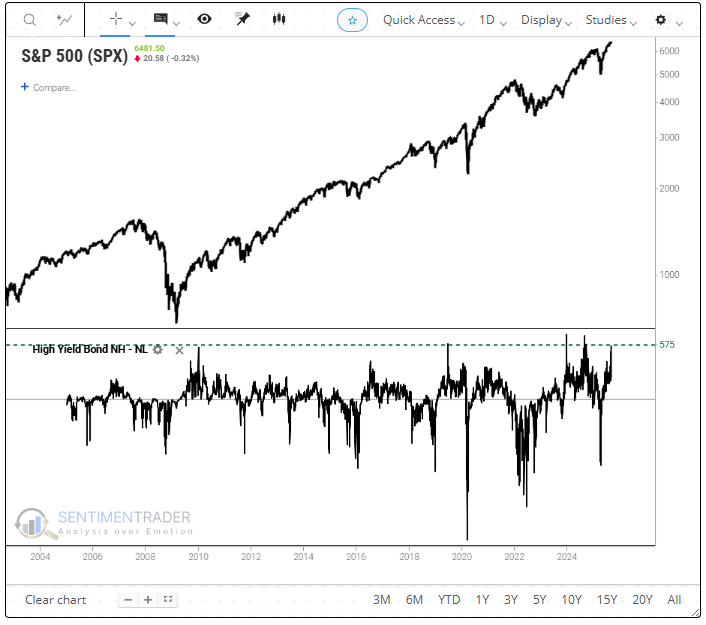
Junk bonds are a “risk-on” proxy, which shows that investors currently have little fear of a market correction. However, as noted, junk bonds are very susceptible to a weakening economic environment, and if default risks begin to rise, the risk to the market will increase.
The current bond backdrop is becoming more constructive, and the recent breakouts above long-term moving averages bode well for continued gains. However, with bonds overbought in the short-term, look for corrections to add holdings to portfolios.

Are Lumber Prices Warning of an Economic Slowdown?
Lumber prices have slumped to year-to-date lows, weighed down by an inventory glut built ahead of tariffs. As the WSJ noted, “Producers were so confident, they overlooked one glaring obvious hurdle while piling up lumber in the U.S.: demand or lack thereof.” With warehouses full and construction permits slipping to their lowest levels since 2020, lumber mills are now cutting back production.
The sharp decline in lumber prices raises concerns about a potential slowdown in housing-related activity and the broader economy when paired with August’s weak employment report. Historically, lumber has been a leading indicator for both, reflecting shifts in building demand and consumer sentiment.
Yet the signal isn’t conclusive. Often viewed as the more reliable economic barometer, copper prices remain in a longer-term uptrend. That divergence poses the key question: Are lumber prices flashing a broader economic slowdown? Or are they simply reflecting elevated mortgage rates and uncertainty around trade policy? With the Fed expected to cut rates later this month, a rebound in construction and lumber demand is possible. However, if lumber prices fail to recover given further rate cuts, it may suggest that deeper cyclical forces are at play.

Why Diversification Is Failing In The Age of Passive Investing
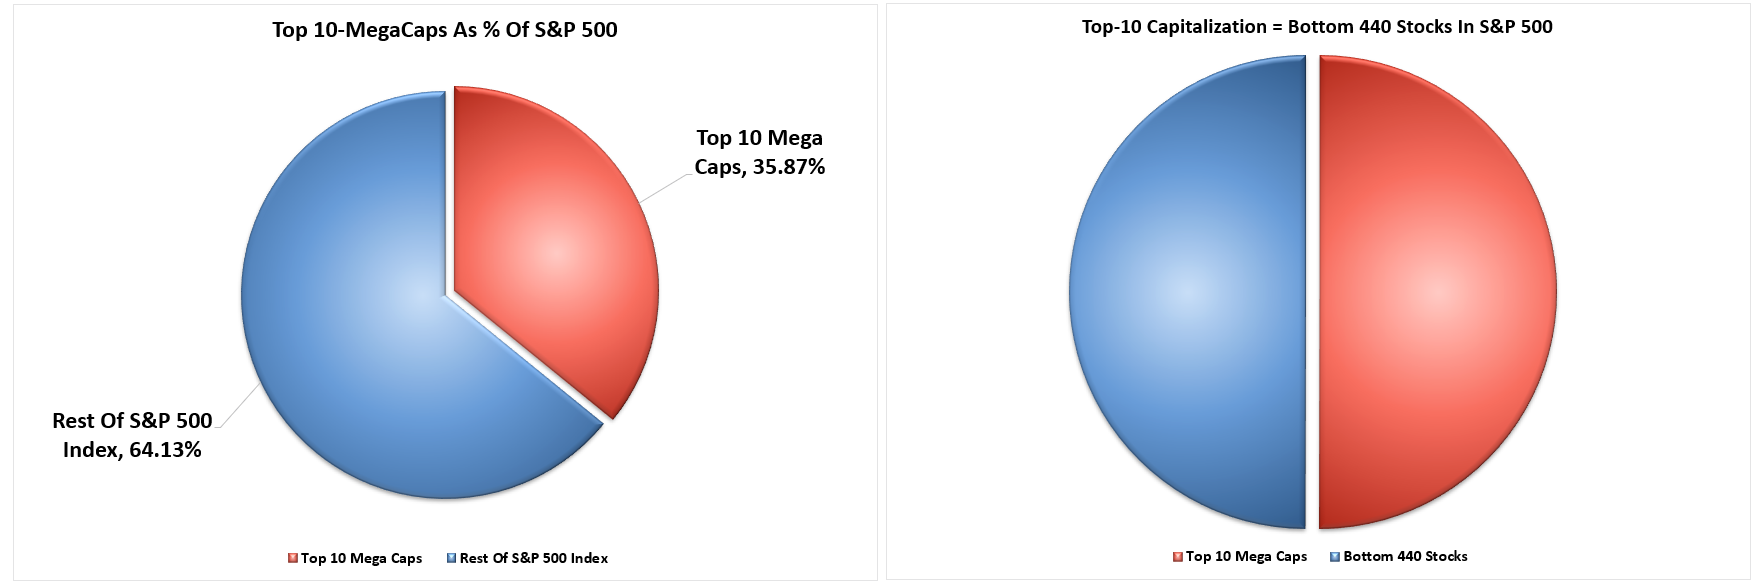
Passive investing has grown from a niche strategy into the dominant force in equity markets. Index funds and ETFs now account for over half of U.S. equity ownership. These vehicles allocate capital based on market capitalization, not valuation, fundamentals, or business quality. As more money flows into these funds, the largest companies receive the lion’s share of new capital. That’s created a powerful feedback loop, where price drives flows, and flows drive price.
This shift has radically changed the effectiveness of diversification. Investors who think they’re diversified across multiple ETFs often have overlapping exposure to the same few mega-cap names. For example, Apple, Microsoft, and Nvidia are top holdings in technology ETFs, dividend funds, and large-cap growth portfolios. In the U.S., there are roughly 4000 ETFs, and 771, approximately 20%, own Apple.
Tweet of the Day

“Want to achieve better long-term success in managing your portfolio? Here are our 15-trading rules for managing market risks.”
Please subscribe to the daily commentary to receive these updates every morning before the opening bell.
If you found this blog useful, please send it to someone else, share it on social media, or contact us to set up a meeting.

