
🔎 At a Glance
- Oil Volatility And The Market Impact
- Market Brief & Technical Review
- From Lance’s Desk: Fitzpatrick: Soros CEO & CIO Warns of a Reckoning
- Market stats, screens, and risk indicators
🏛️ Market Brief – Iran Conflict & Private Credit Rattles Markets
The S&P 500 extended its losing streak to three consecutive weeks, the first such run in roughly a year. The convergence of geopolitical shock, private credit stress, and deteriorating economic data gave investors little reason to buy the dip.
On Monday, the market stumbled as oil surged past $100 per barrel. That came after Israeli strikes on Iranian oil depots over the weekend were met with Tehran’s throttling of the Strait of Hormuz. WTI did pull back after President Trump signaled the conflict was nearing its end, triggering the S&P 500’s best single-session gain in a month. Markets, however, didn’t believe the all-clear. By Thursday, Iran’s newly appointed Supreme Leader, Mojtaba Khamenei, declared the Strait should remain closed as a “tool to pressure the enemy,” renewing the selloff.
However, as we will discuss today, the oil shock is only a catalyst for an ongoing economic slowdown. February payrolls showed the U.S. economy losing 92,000 jobs. That was well below estimates of a 55,000 gain. Then Q4 GDP came in at a paltry 0.7% annualized, far below expectations. This coming week, the Federal Reserve will make its next move, likely a “no move” on rates and a “wait and see” approach. The markets will likely not like either outcome.
Less visible to retail investors, but potentially more systemic, was the widening crack in private credit. Morgan Stanley and Cliffwater imposed caps on withdrawals from their multi-billion-dollar private credit funds. BlackRock’s $26 billion HPS Corporate Lending Fund faced redemption requests totaling 9.3% of assets but honored only 5%, effectively locking up the remainder. JP Morgan announced it would restrict lending to private credit providers after marking down the value of several loans, a signal that stress is migrating from the shadow banking system into traditional balance sheets. Blue Owl, Blackstone, and Apollo each shed 2–3% on the week as the sector repriced broadly. (Read More)
What does it all mean? The market is simultaneously repricing geopolitical, inflationary, credit, and growth risk. That is not a recipe for a quick V-shaped recovery. Consumer sentiment fell to 55.5 in March, according to the University of Michigan, with the survey director noting that early-month optimism was “completely erased” once the Iran conflict escalated. The burden of proof is now on the bulls. Until the Strait of Hormuz reopens, private credit stabilizes, and economic data stops deteriorating, assume the path of least resistance remains lower.
Which brings us to the market.
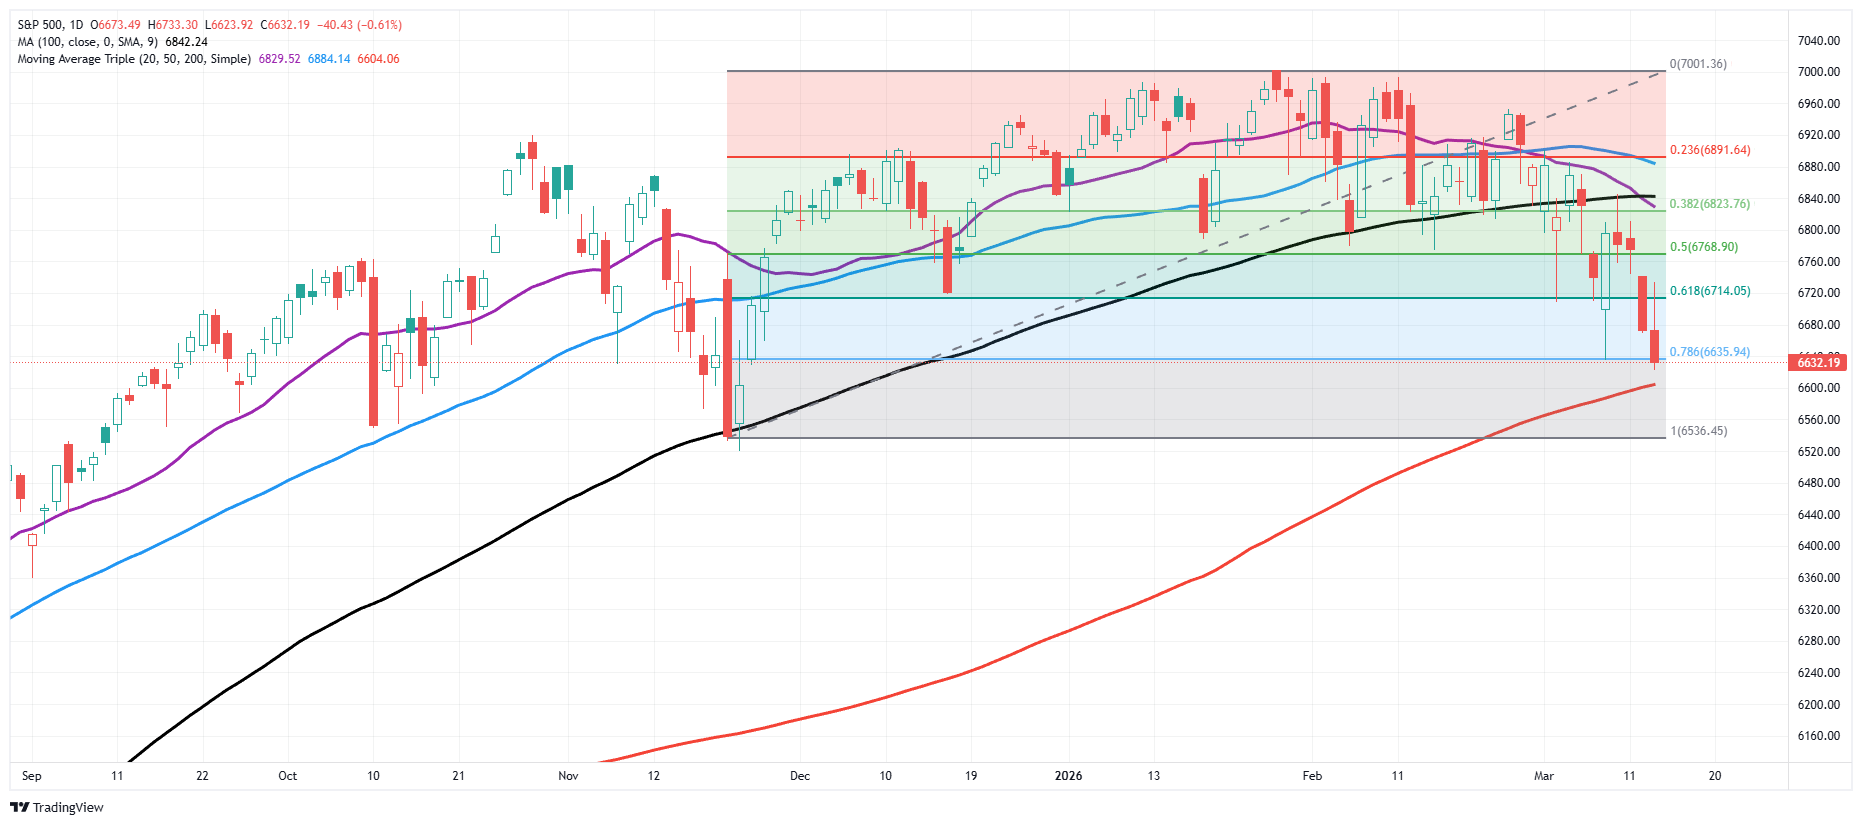
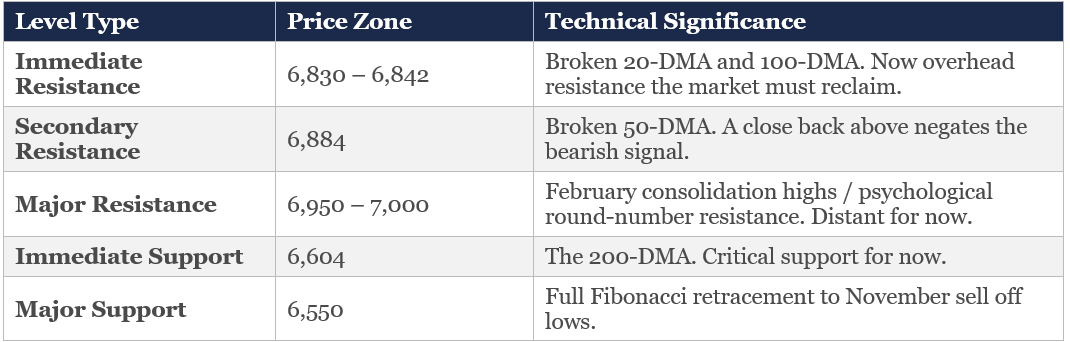
📈Technical Backdrop – Market Breaks Support
The S&P 500 closed Friday at 6,632, capping a brutal three-week losing streak—the first in roughly a year. From the late-January high of 7,002, the index is now down 5.3% and has broken every major moving average below. The March 9th selloff, triggered by Operation Epic Fury and the Iran escalation, wiped nearly $900 billion from equities in a single session. On Thursday, Iran’s new Supreme Leader declared the Strait of Hormuz must remain closed, sending Brent temporarily above $100 per barrel for the first time since August 2022.
The technical damage is significant. The index decisively is pushing toward support at the 200-DMA (~6,604) on Friday, after a reflexive bounce off the previous intraday low failed at the 50-DMA. The 50-DMA (~6,884) and 100-DMA (~6,842) are now overhead resistance.
As we noted in Thursday’s Daily Market Commentary,
“The volume profile clearly tells the story. The Point of Control for the past 90 days sits in the 6,860–6,900 range on the S&P 500, meaning that’s where the heaviest concentration of transactions occurred during the recent consolidation phase. With the index now trading well below that zone, the majority of those positions are underwater. That matters enormously for what happens next — because it fundamentally changes the behavioral calculus of a large swath of market participants.
Here’s the mechanics: when investors are trapped in losing positions, they don’t behave like buyers, but sellers-in-waiting. This is what we term “trapped longs,” as every relief rally, every bounce on a ceasefire rumor, a dovish Fed comment, or a better-than-expected data print, becomes an exit opportunity rather than a signal to add exposure. “

The MACD sits at −28.92, firmly in sell territory and oversold. The 14-day RSI has plunged to 33, and is approaching oversold but not yet at the extreme washout levels that mark durable bottoms. In other words, next week could see some selling pressure down to the 200-DMA, but look for buyers to step in with markets more oversold.
Bottom line: We have shifted from a “buy the dip” market to a “sell the rip” environment. If the market breaks the 200-DMA, that will be technically significant. Historically, when the index violates that level on high volume, it takes months to establish a durable floor. That said, RSI is nearing oversold, breadth deterioration remains selective (concentrated in mega-cap tech), and the war premium in oil may dissipate if geopolitical conditions stabilize. The 6,600 level is the immediate test; failure there opens 6,300–6,400 and a full 10% correction. A close above the 100-DMA (~6,850) would be the first sign that the worst has passed. Until then, reduce exposure into strength, raise cash, define risk levels, and avoid catching falling knives.
Trade accordingly.
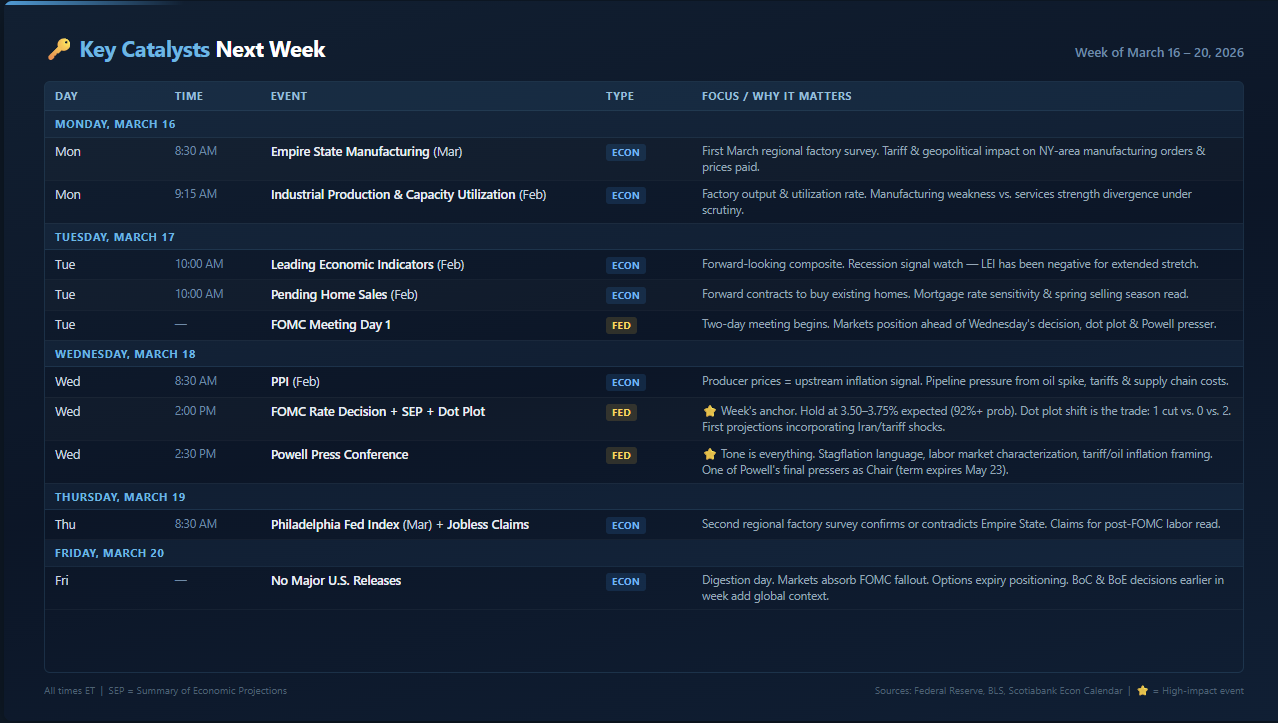
🔑 Key Catalysts Next Week
The Fed takes center stage. The March 17–18 FOMC meeting is the most consequential policy event since the rate-cutting cycle ended, and it arrives at the worst possible moment for a central bank navigating stagflation risk. February payrolls shed 92,000 jobs, the third negative print in five months, while wages accelerated to 3.8% annually. Oil is pushing $100 on the Iran conflict. Core PCE is running at 3.0%. The labor market is weakening, and inflation is reaccelerating. That’s the textbook definition of a policy trap.
The rate decision itself is a foregone conclusion. The CME FedWatch shows 92%+ probability of a hold at 3.50–3.75%. The real trade is the dot plot and the Summary of Economic Projections. The current median dot shows one 25-basis-point cut for 2026. If the dots shift to zero cuts, rate expectations reprice violently, and risk assets sell off. If they shift to two, acknowledging labor deterioration, bonds rally and equities catch a bid. Two dissenters in January (Waller and Miran) already preferred a cut, suggesting internal pressure is building. Powell’s press conference carries added weight as one of his final appearances before his term expires May 23, with hawkish-leaning Kevin Warsh the expected successor.
Wednesday morning’s PPI lands just hours before the FOMC decision, creating a rare same-day inflation-plus-policy collision. Producer prices will tell us whether the upstream pipeline, oil, tariffs, and supply chain costs are building pressure that hasn’t yet reached consumers. A hot PPI followed by a hawkish dot plot would be the worst-case scenario for bulls.
Monday’s Empire State Manufacturing and Thursday’s Philly Fed bracket the meeting with regional factory reads that will capture the first hard data on tariff and geopolitical disruption in the manufacturing sector. Both surveys’ price-paid components matter as much as the headline.
Bottom line: This week is about one question: can the Fed credibly signal it will cut rates into a weakening economy when inflation is moving in the wrong direction? The dot plot answers that. Everything else is noise.
Need Help With Your Investing Strategy?
Are you looking for comprehensive financial, insurance, and estate planning services? Need a risk-managed portfolio management strategy to grow and protect your savings? Whatever your needs are, we are here to help.

💰 Oil Volatility Shock
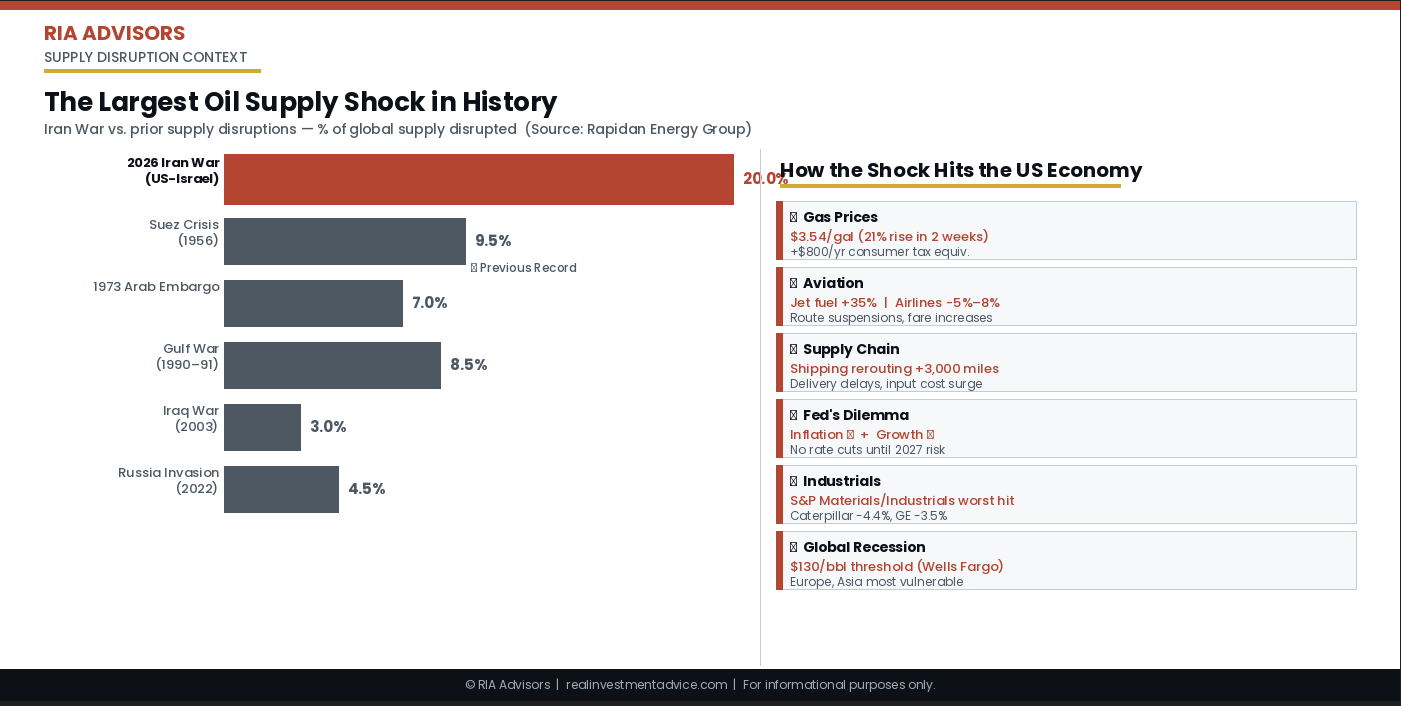
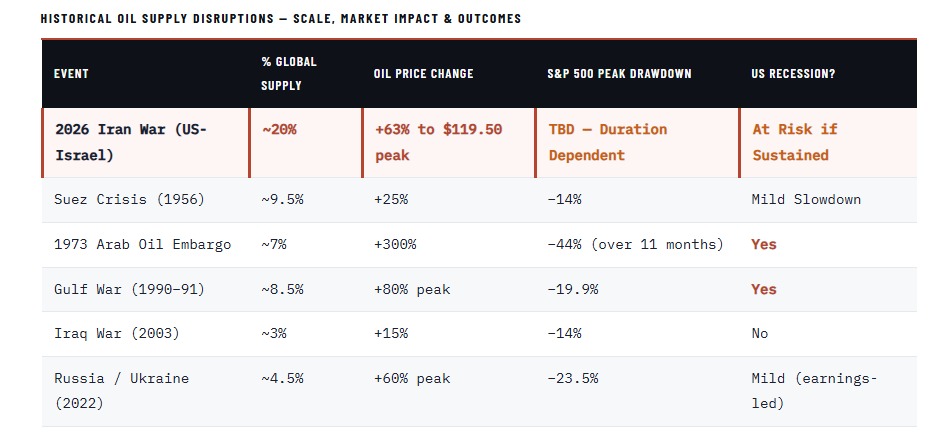
This past week, a spike in oil volatility and prices shocked investors. Oil volatility and price shocks don’t announce themselves; they arrive via a news wire. A military strike, a shipping embargo, a chokepoint closure, all within hours, the calculus for every portfolio manager, central banker, and consumer in the world changes. That is exactly what happened on February 28, 2026, when US and Israeli forces launched coordinated strikes on Iran’s military and energy infrastructure. What followed was the most violent repricing in oil markets since Russia invaded Ukraine, and by all measures, the supply disruption as a share of global consumption is the single largest shock in the history of the modern oil era.
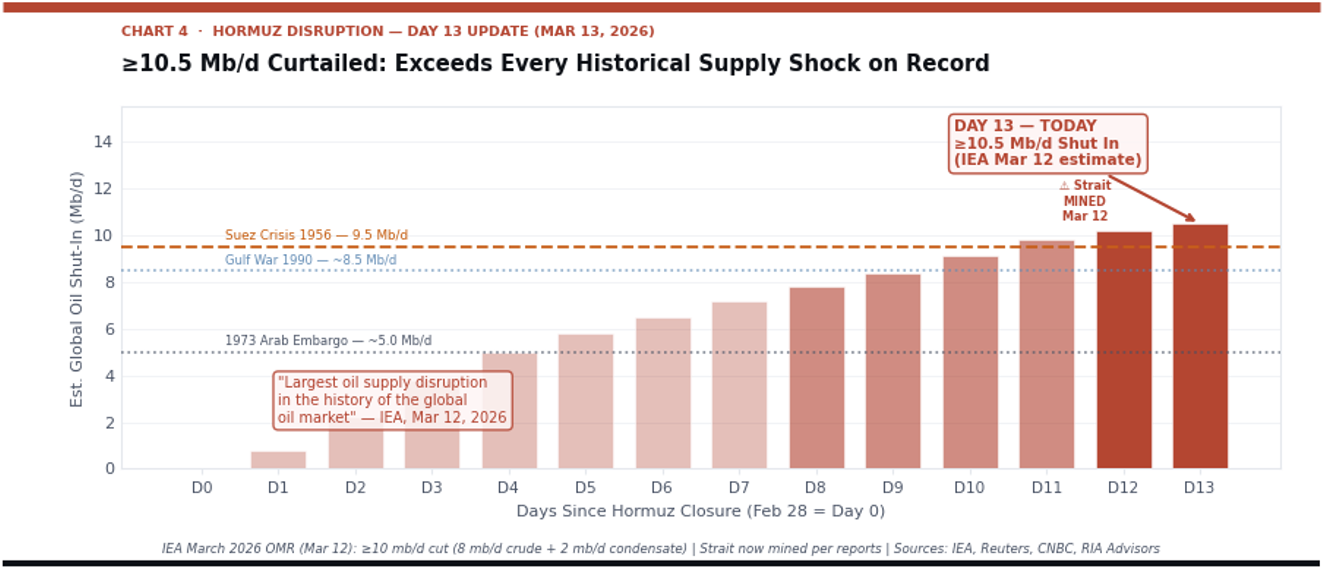
According to Rapidan Energy Group, the Iran War has disrupted approximately 20% of global oil supplies transiting the Strait of Hormuz, more than double the previous record set during the Suez Crisis of 1956, which disrupted just under 10%. To put that in context: the 1973 Arab oil embargo, which triggered one of the worst recessions of the 20th century, cut global supply by roughly 7%. The current disruption is nearly three times that magnitude, concentrated in one of the world’s most irreplaceable shipping chokepoints.
“The Strait of Hormuz remains the single most consequential energy chokepoint on earth. What we’re witnessing is not just a price spike — it’s a structural test of the global energy architecture.”— Energy Analyst, Rapidan Energy Group
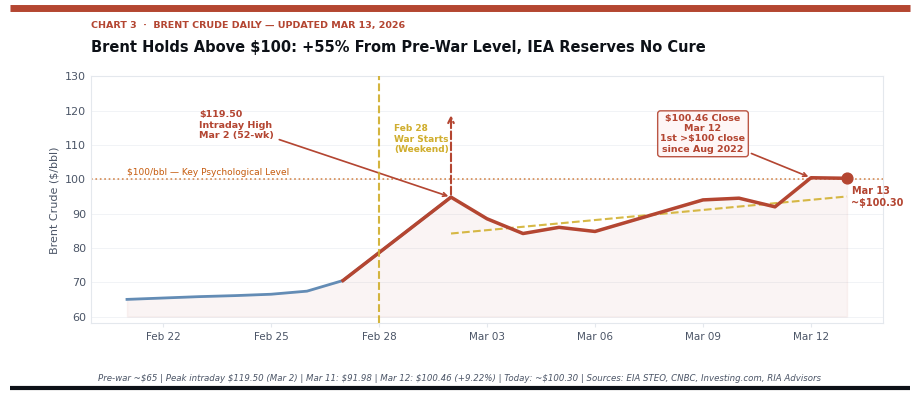
Due to that disruption, crude oil prices and oil volatility spiked from roughly $73 per barrel before the strikes to an intraday peak of $119.50 on March 9, a move of more than 63% in ten days. The price has since pulled back sharply, following President Trump’s comments to CBS News that the war was “pretty much very complete” and the International Energy Agency’s announcement of a historic 400 million barrel reserve release.
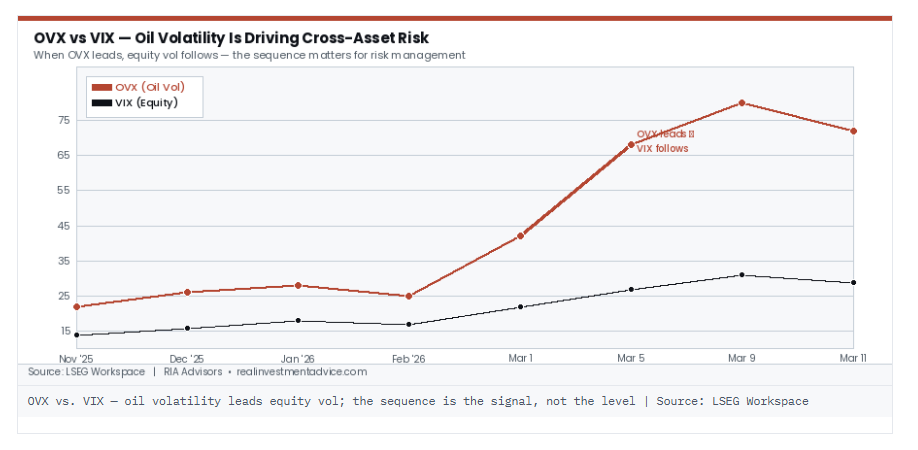
The CBOE Crude Oil Volatility Index remains elevated even as spot prices have retraced from their panic highs. That divergence is the most important thing in markets right now. When the volatility index for a commodity remains elevated, it indicates the market has not resolved its uncertainty; it has merely paused.

If oil volatility still isn’t one of the indicators you track daily, it should be. The index has become a key short-term driver across multiple asset classes, not just energy. When oil volatility spikes, it is transmitted to credit spreads, equity volatility, and currency markets within days. The sequence runs:
Oil Volatility leads → Equity Volatility follows → Credit Spreads widen → Risk Assets reprice.
Understanding where you are in that chain is more useful than watching crude futures tick for tick.
It all Depends on Hormuz
While oil volatility has exploded higher, the underlying commodity is still holding the short-term trend line that has been in place since the strikes began on February 28. The retrace from $119.50 to the high-$80s/low-$90s range is not a resolution; it is likely a near-term consolidation unless a quick resolution to the Iran conflict unfolds. As long as Brent holds above the trend established at the moment of the initial shock, the balance of risk remains to the upside. However, a breakdown through that trend would be the first genuine technical signal that the premium is being unwound.
JPMorgan’s Natasha Kaneva has outlined her latest framework on oil, and it is worth reading in full:
“Policy measures may have limited impact on oil prices unless safe passage through the Strait of Hormuz is secured. Escorting every tanker would require many warships and close allied coordination, but the US Navy has limited vessels available due to ongoing operations. For now, the broader US strategy appears focused on degrading Iran’s asymmetric capabilities threatening shipping — coastal anti-ship missiles, naval mines, drones, and IRGC speedboat swarm attacks — as well as destroying the factories producing these systems. Once these threats are sufficiently reduced, naval escorts and government-backed insurance could restore confidence for tankers to transit the Strait.”— Natasha Kaneva, Head of Global Commodities Strategy, J.P. Morgan
The key takeaway from Kaneva is that policy tools alone won’t stabilize oil prices unless and until Hormuz shipping is physically secured. Verbal intervention from Washington can move the price 10–15% in an afternoon, as we saw last Tuesday when Energy Secretary Wright’s now-deleted post caused a flash crash in crude. But verbal intervention does not move tankers. Until the asymmetric threat from Iran’s naval capabilities is degraded to the point where insurers will cover passage, the supply shock remains structural, not sentiment-driven.
The chart below shows JPMorgan’s estimated supply shut-ins by day of the Hormuz disruption. As of Wednesday, when I began writing this article, we were at Day 13. The cumulative math is staggering: over 10 million barrels per day of supply are effectively stranded, more than the previous record set during the 1956 Suez Crisis. While the IEA’s historic 400 million barrel release will buy the markets a few days, it is not a long-term solution. At the current rate of shut-in, the global buffer is being consumed faster than any coordinated reserve release can replace it.
Of course, this brings us to the most important question.
Oil Volatility, Price Shocks, and Recessions
Why does any of this matter beyond energy markets? Because oil price shocks matter most when inflation is already a live political issue. And right now, inflation is the dominant political concern for American voters.
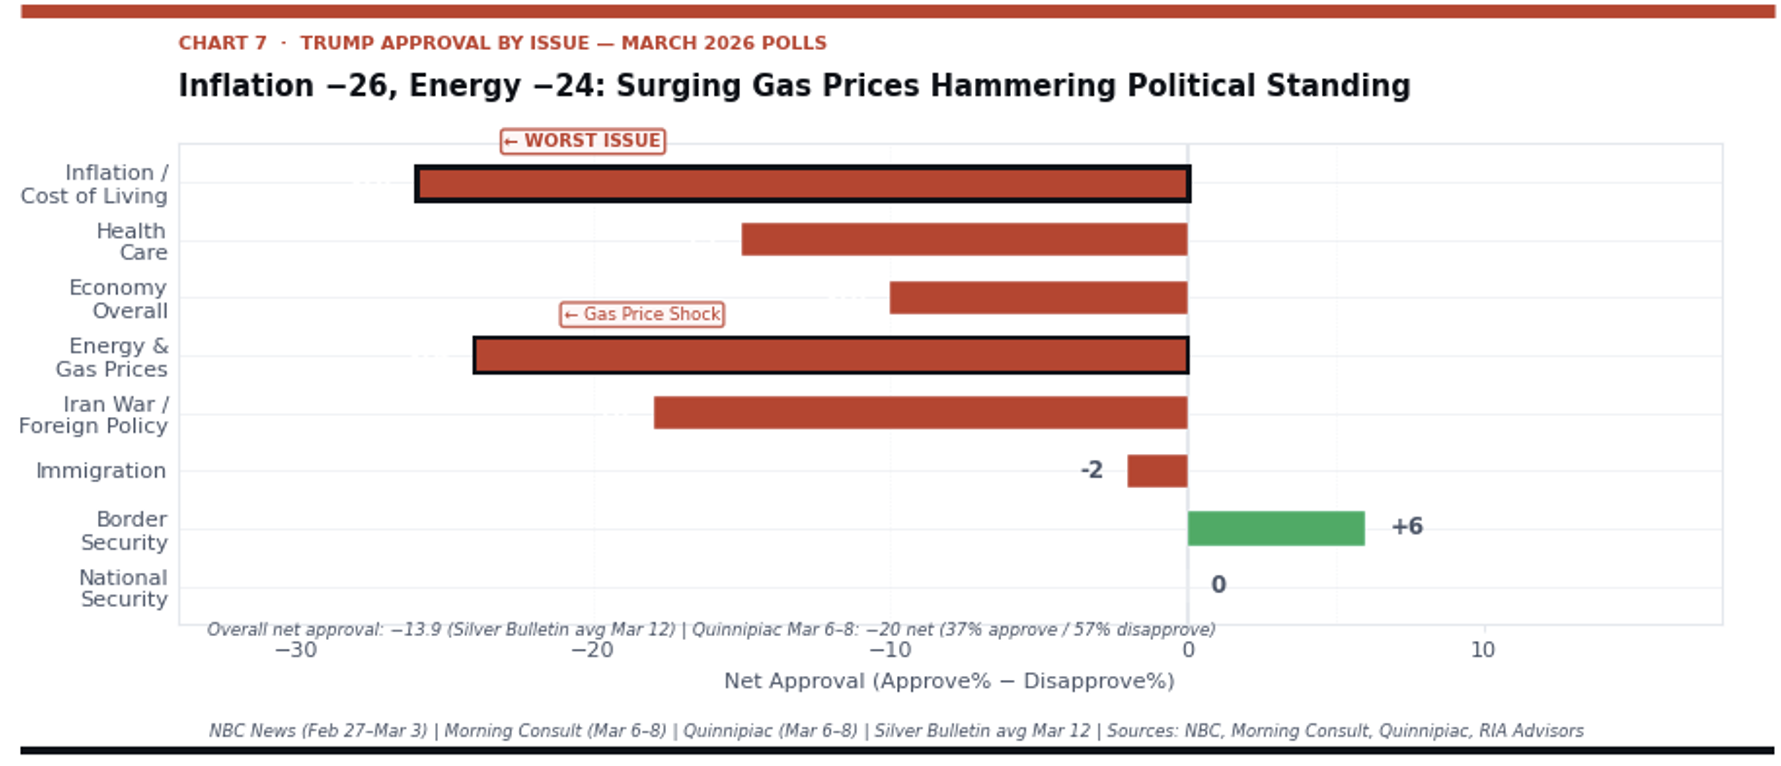
The chart below, from TS Lombard, shows Trump’s net approval rating broken down by policy issue. The inflation reading is the most negative of any category tracked, with a net approval of -26. Every dollar that gasoline prices rise is a direct tax on the working-class voter base that delivered the 2024 election. The political pressure to bring oil prices down is not just economic. Oil prices are existential for the administration’s legislative agenda and its 2026 midterm positioning. Higher oil equals higher inflation risk. That makes this oil volatility shock politically problematic, particularly if it slows the economy toward a recession.
Historically, oil price shocks from geopolitical events are typically transitory, and markets bounce back. Carson Group’s Ryan Detrick notes that the S&P 500 was higher 65% of the time one year after major geopolitical events since World War II. Fidelity points to the Russia-Ukraine war as a case study, as well. Despite the conflict disrupting major energy and commodity markets, the S&P 500 has risen more than 60% since it began.
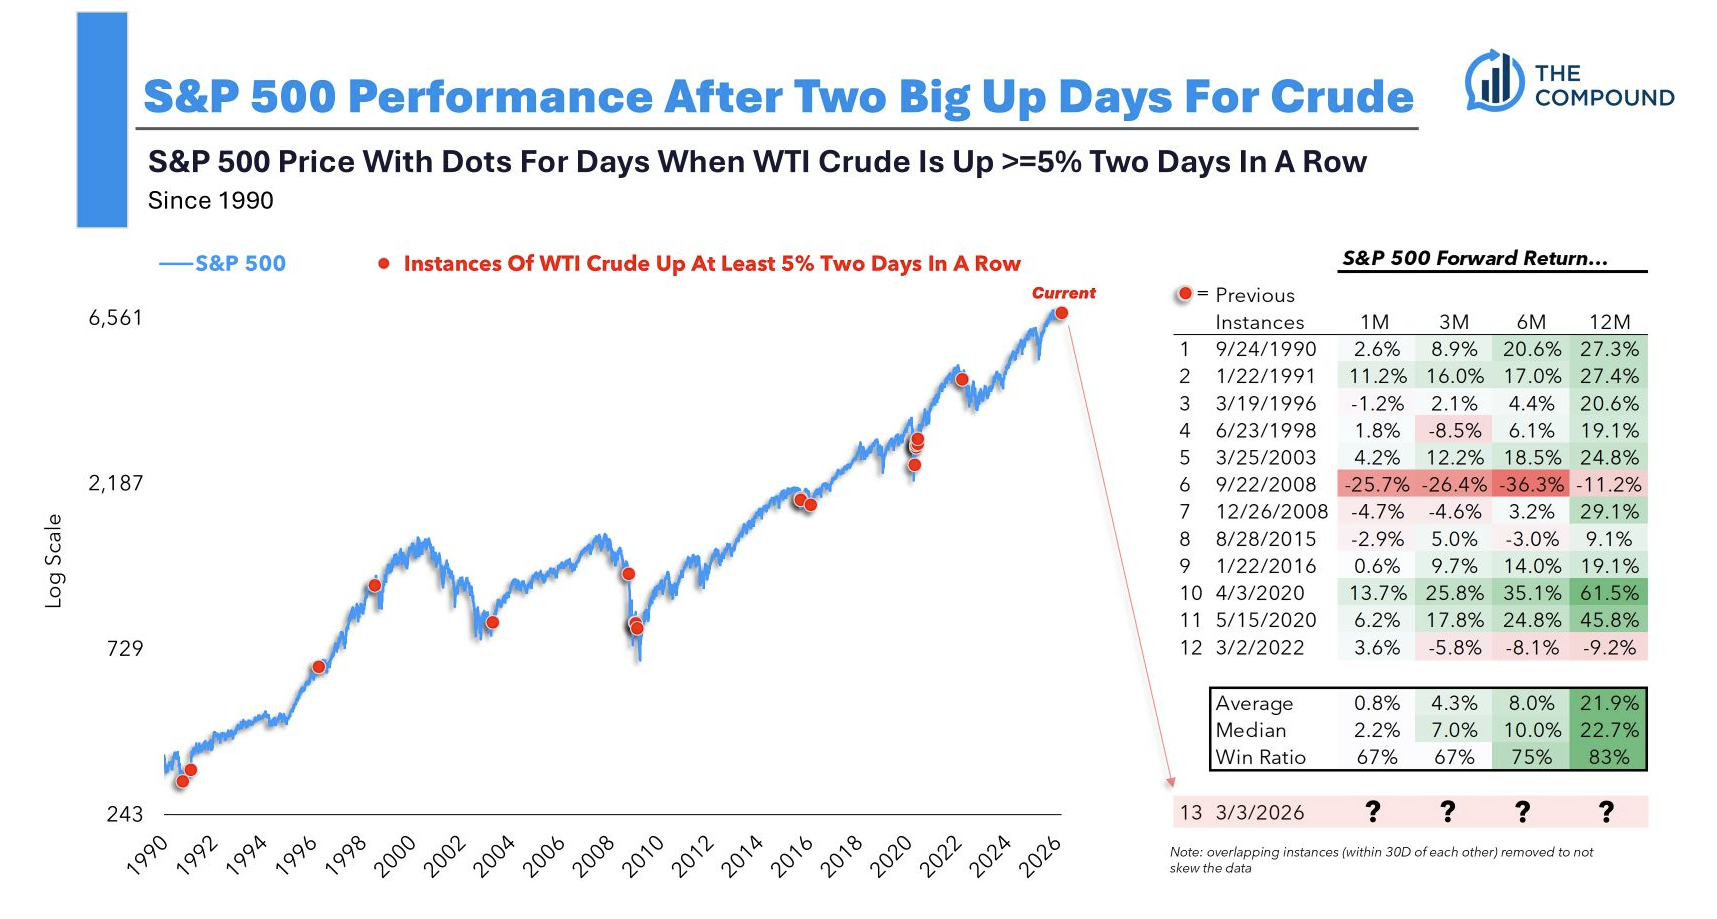
These data points are true but context-dependent. The variable that matters is the one that distinguishes manageable geopolitical shocks from recession catalysts. Whether the event disrupts oil supply at a scale that transmits to the real economy is the question. According to the data, the S&P 500 shed 13% in the three weeks following Iraq’s invasion of Kuwait in 1990. In October 1973, when Arab OPEC members banned oil exports to the US, the S&P lost 17% over the next two months. It then plummeted 44% over the following 11.5 months as the “Nifty Fifty” bubble imploded. The correlation is not war — it is oil.
The current disruption is categorically larger than any prior shock, according to the supply disruption measure. The critical question, and the only one every investor needs to answer, is whether the shock is short-lived enough to be absorbed, or whether duration converts this into a full macro transmission event. There are four points to consider in the coming days and weeks.
- The Consumer Tax – Every $10 increase in sustained oil prices functions as roughly a $100–150 billion annual consumer tax on the US economy. With gas prices rising from $3.00 per gallon before the strikes to $3.54 as of March 10, a 21% increase in two weeks, the consumer is already absorbing the first transmission wave. Walmart’s soft 2026 guidance, issued before the war, is now looking prescient. If prices remain at $100-plus, the gas tax equivalent would approach $600–800 per household annually. Against a backdrop of already-elevated credit card delinquencies and a personal savings rate under pressure, the consumer’s margin for error is thin.
- The Fed’s Impossible Position – The combination of a weak economy and high inflation is a worst-case scenario for the Federal Reserve. February’s payrolls report showed employers cut more jobs than they created. The Fed has also been on a measured easing path, with markets pricing rate cuts in Q2. Those expectations have now been pushed to late 2026 at the earliest. The low-growth-plus-inflation playbook from 2022 is back, with two important wrinkles: the labor market was already showing cracks before the shock, and the Fed has less room to react.
- Aviation and Supply Chain Contagion – Jet fuel prices are rising even faster than crude, compounding pressure on an industry where fuel already accounts for up to a quarter of operating costs. United Airlines and Delta Air Lines fell more than 5% each on March 5 alone, while the XOP Oil and Gas ETF rose 30% year-to-date to multi-year highs, the clearest illustration of the zero-sum nature of an oil shock. Deutsche Bank warned that without near-term relief, financially weaker carriers face operational halts. Meanwhile, rerouting tanker traffic to avoid the Strait of Hormuz adds roughly 3,000 miles and weeks to the transit time for Asia-bound cargo, creating cascading supply chain delays that will take months to unwind even after the Strait reopens.
- The Equity Market Earnings Transmission – The S&P 500’s Energy sector currently represents just ~3% of the index by market cap, meaning the direct earnings benefit of higher oil prices is trivial relative to the aggregate earnings drag on every other sector. Materials and Industrials are the most direct casualties and should be reduced. The broader issue is that a sustained oil price shock is a negative earnings revision event for approximately 85% of S&P 500 constituents, while being a positive revision for roughly 5%. The math is not favorable for index-level multiples, which we have been concerned about since the beginning of the year.
So, what should you be doing this week?
What This Means for Your Portfolio
The data above tells a coherent story, and it has direct implications for how investors should be positioned right now. With oil volatility elevated, it is not a signal to relax. It is a signal that the market is repricing risk in real time and has not reached a conclusion. Here is how we are thinking about the key positioning questions.
- Do not mistake a retreat for a resolution. The Strait of Hormuz remains a problem, with tankers still anchored. Until that fact changes, any rally in equities off oil-shock lows should be treated as a relief event to reduce exposure into, not a buying signal.
- Energy is the only sector with an unambiguously positive earnings revision story. The market is starting to price in the impact on the domestic US producers, who are the direct beneficiaries of every dollar of sustained oil price increase. But size your positioning appropriately: if the shock resolves quickly, the premium unwinds fast.
- The Fed is not your friend in this environment. The low growth/inflation setup, weakening labor data, and oil-driven inflation are scenarios in which the Federal Reserve has no clear policy response. Rate cuts could be inflationary, and rate hikes could compound the growth slowdown. The result is paralysis. Long-duration fixed income is at risk in this environment, so shortening bond duration until the event passes seems prudent.
The duration of the conflict, specifically when the Strait of Hormuz returns to normal shipping traffic, is the single most important variable for every downstream economic and market forecast. Here is how we frame the three scenarios:

The bottom line is simple: oil volatility is the market’s honest assessment of unresolved risk. Position accordingly. Reduce duration in equities and fixed income. Consider inflation protection, and keep dry powder available for the resolution trade when the Strait eventually reopens. Crucially, watch credit spreads to confirm whether macro transmission is accelerating or stabilizing.
The next two weeks will determine whether this is a sharp shock with a clean resolution or the beginning of a longer repricing cycle. The charts above tell you where to look for the answer.
🖊️ From Lance’s Desk
This week’s #MacroView blog digs into cracks in private credit markets and their implications for markets.

Also Posted This Week:
- True Value: Looking Through The Value Rotation Illusion – RIA – by Michael Lebowitz
- Technical Deterioration: Risk Management Is Key – RIA – by Lance Roberts
📹 Watch & Listen
Jon Penn, CFP, and Michael Lebowitz, CFA, dig into value rotation and what is likely to happen next.
Subscribe To Our YouTube Channel To Get Notified Of All Our Videos
📊 Market Statistics & Analysis
Weekly technical overview across key sectors, risk indicators, and market internals

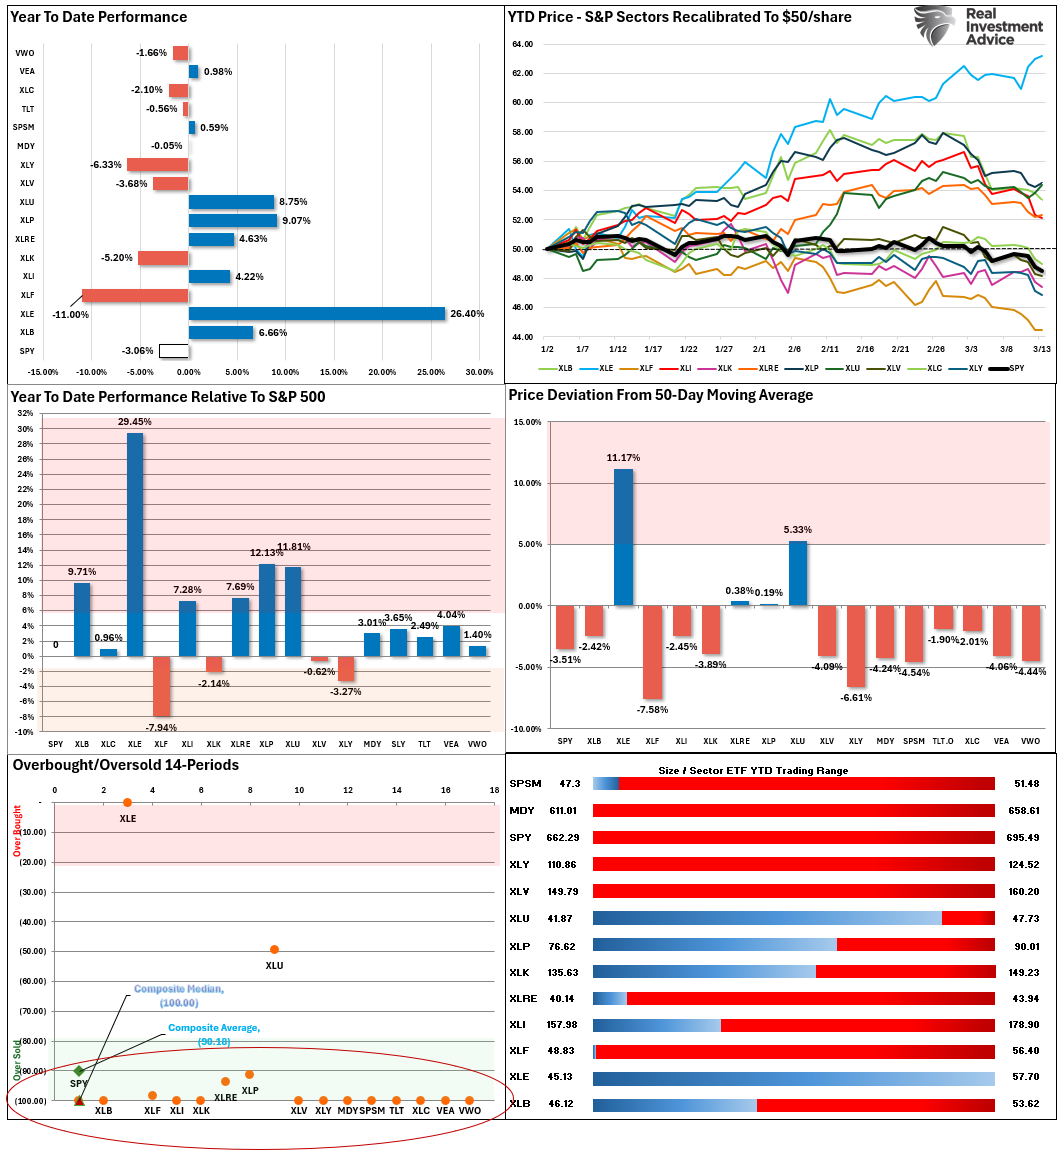
💸 Market & Sector X-Ray: Market Cracks Support
Last week’s selling pressure pushed every market and sector, except for Energy and Utilities, back into very oversold territory. Look for a bounce next week to reduce risk and rebalance portfolios. Any good news on the Iran front will provide a fairly strong counter-trend bounce.
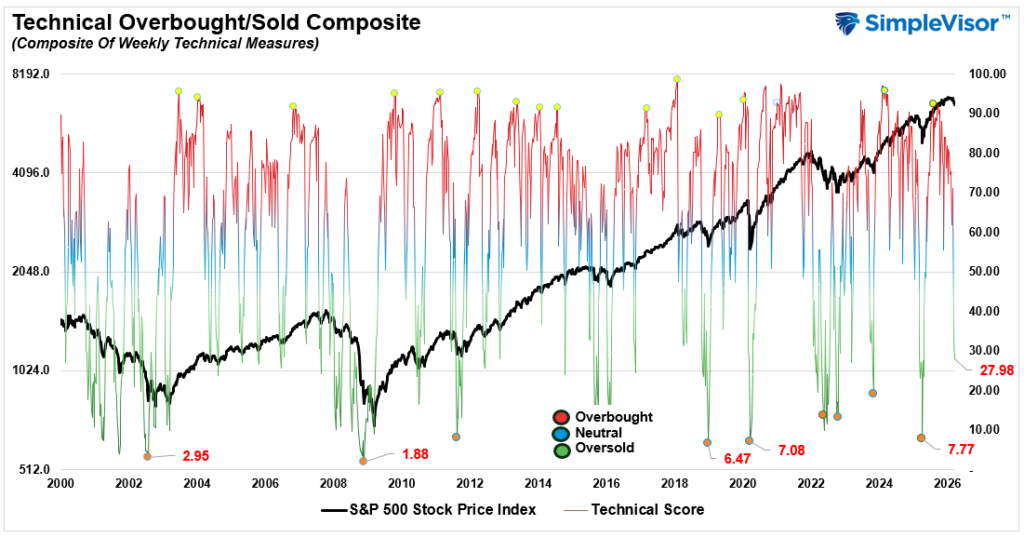
📐 Technical Composite: 27.98 – Market Oversold
The Iran conflict continues to weigh on risk appetite. Oil prices remain the key driver for the markets in the near term. As the market approaches oversold levels, the odds of a reflexive rally are increasing.
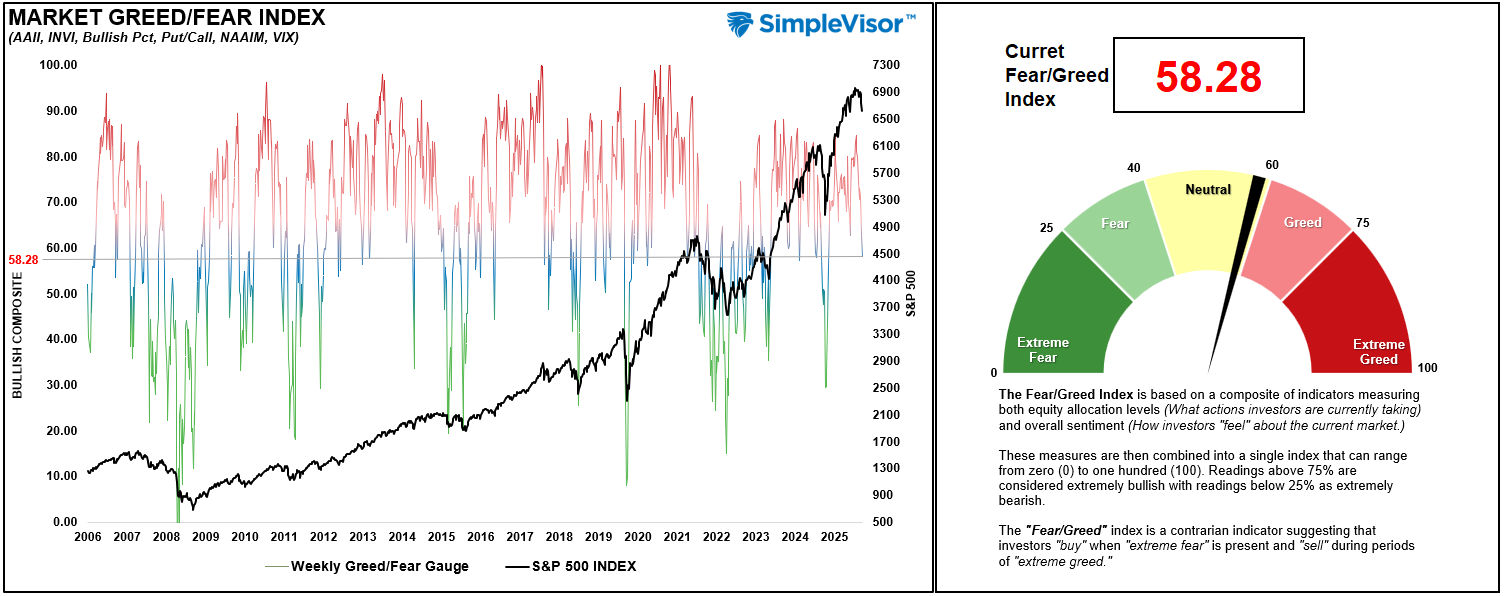
🤑 Fear/Greed Index: 58.28 – Sentiment Reverses Sharply
This past week, sentiment dropped sharply as expectations of global economic outperformance faded. The Iran conflict intensified, and energy prices remained elevated, pushing investors to become increasingly cautious last week.
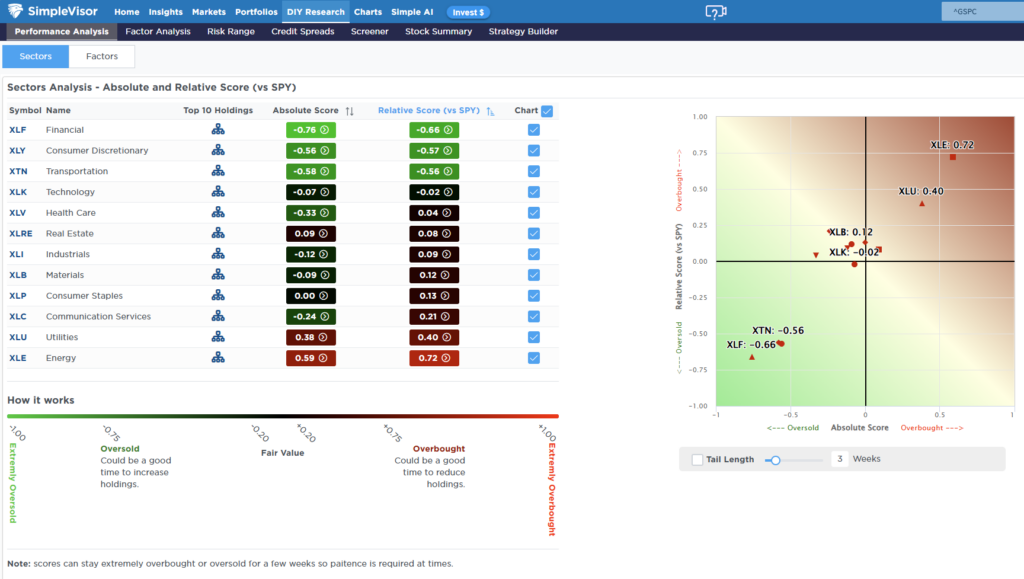
🔁 Relative Sector Performance
Financials, Discretionary, Transportation, and Technology are the most oversold. Communication Services, Energy, and Utilities are the most overbought. A rotation trade seems increasingly possible.
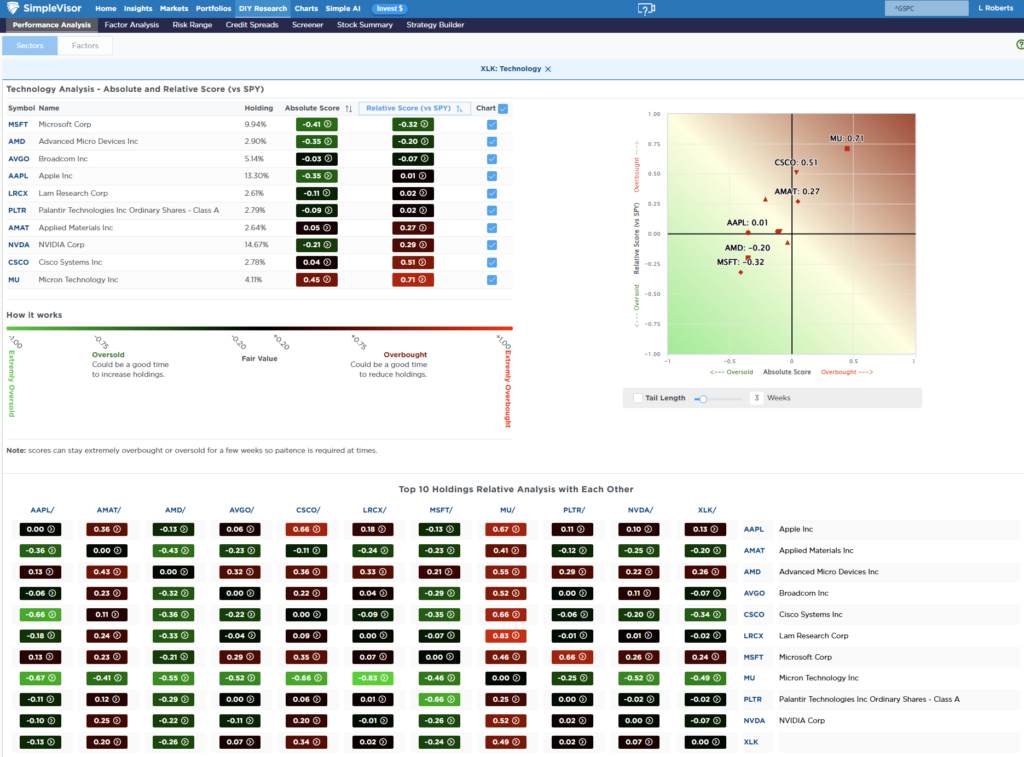
📊 Most Oversold Sector Holdings
While Financials remain the most oversold, I wanted to look at Technology this week. Performance has improved as of late. MSFT, AMD, AVGO, and APPL are the most oversold on a relative basis. PLTR, NVDA and MU have been performing much better. If we see a continued rotation from value to growth due to oil volatility, we could see further improvement in the sector.
📊 Sector Model & Risk Ranges
Two weeks ago, we noted that many sectors were all at extreme deviations from their longer-term means. “These more extreme deviations will eventually correct themselves, so continue to manage risk accordingly.” Over the past 10 trading days, with the exception of Energy, reversals have been sharp, and many markets and sectors are now oversold enough for a reflexive rally. Use that rally to rebalance and reduce risk until we have some clarity on the Iran conflict.

Have a great week.
Lance Roberts, CIO, RIA Advisors

