
🔎 At a Glance
- Consecutive Weekly Declines & Fading Rallies For Now
- Market Brief & Technical Review
- From Lance’s Desk: Oil Shocks & Recessionary Outcomes – RIA
- Market stats, screens, and risk indicators
🏛️ Market Brief – Market Rebounds On Resolution Hopes
March closed as the worst quarter for the S&P 500 since 2022, with the index down roughly 7% on the quarter and every member of the Magnificent Seven finishing in the red. This past holiday-shortened trading week saw a sharp reflexive relief rally from the oversold conditions we discussed last week.
Monday opened with oil above $100 a barrel and sentiment fragile following the prior week’s correction-level losses. Markets churned with no conviction. Then, on Tuesday, reports surfaced that Iranian President Pezeshkian was open to ending the war, and markets exploded. The S&P surged 2.91%, the Dow added 1,125 points, and the Nasdaq rocketed 3.83%, its best single session since May. However, as we have noted previously, the “best trading days” tend to occur in the midst of the worst of times. Nonetheless, it was a legitimate relief rally, and for a day, it felt like the fog was lifting.
However, optimism was tempered on Wednesday, with the ADP employment topping expectations at 62,000 and retail sales surging by 0.6%. That news started the day out strong, but stronger data was overshadowed by inflationary pressures. President Trump’s prime-time address further reset the tone as he confirmed ceasefire talks were underway but said U.S. forces would “hit Iran hard” and send them “to the stone age” before withdrawing in two to three weeks. That wasn’t what markets were hoping for, and oil reversed from sub-$100 levels back toward $106 in overnight trading. With that, the markets opened lower on Thursday morning, wiping out the lion’s share of Wednesday’s gains, before rebounding to near breakeven on reports of Iran-Oman coordination to reopen the Hormuz Strait.
With the market closed for Good Friday, traders were left to stew over the weekend with the conflict still unresolved and a critical deadline looming. Nonetheless, as we will discuss below, the reflexive rally this week was not unexpected after 5-consecutive weeks of decline. With the markets decently oversold and clamoring for any piece of positive news to trade higher, the rally was not unexpected. However, we continue to suggest that investors remain cautious until the market rises above the 200-day moving average.
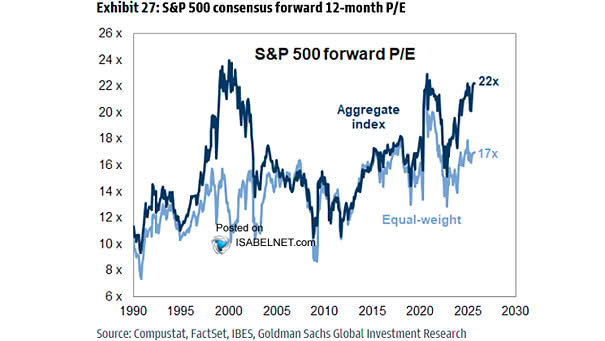
The one silver lining is valuation. As Morgan Stanley noted this past week, the S&P now trades roughly 17% cheaper than pre-war levels on forward earnings. That is approaching ranges historically associated with correction endings, provided the economy avoids recession, and the Fed doesn’t hike. There is no guarantee of either, so caution remains a “trading position.”
Which brings us to the market.
📈Technical Backdrop – Market Breaks The 200-DMA
The S&P 500 closed Thursday at 6,566 ahead of the Good Friday holiday, snapping a brutal five-week losing streak with a gain of roughly 3% on the week. Tuesday’s +2.9% surge—the best session since May—was ignited by reports that Iran’s President is open to ending the war, combined with Trump’s announcement of “productive talks.” March still ended down over 5%, but the bounce off 6,300 produced a 4.2% rally from trough to Thursday’s close. The question heading into Q2 is whether this bounce has legs or is simply another dead-cat rally in a larger corrective phase.
As shown, the current rally is pushing into resistance at the 20-day moving average, which has crossed below the 200-day moving average. Notably, momentum has triggered a short-term buy signal, and relative strength is improving from very oversold levels. However, the big question is whether investors can retake the current resistance levels and push markets higher into next week, but the data suggests caution.
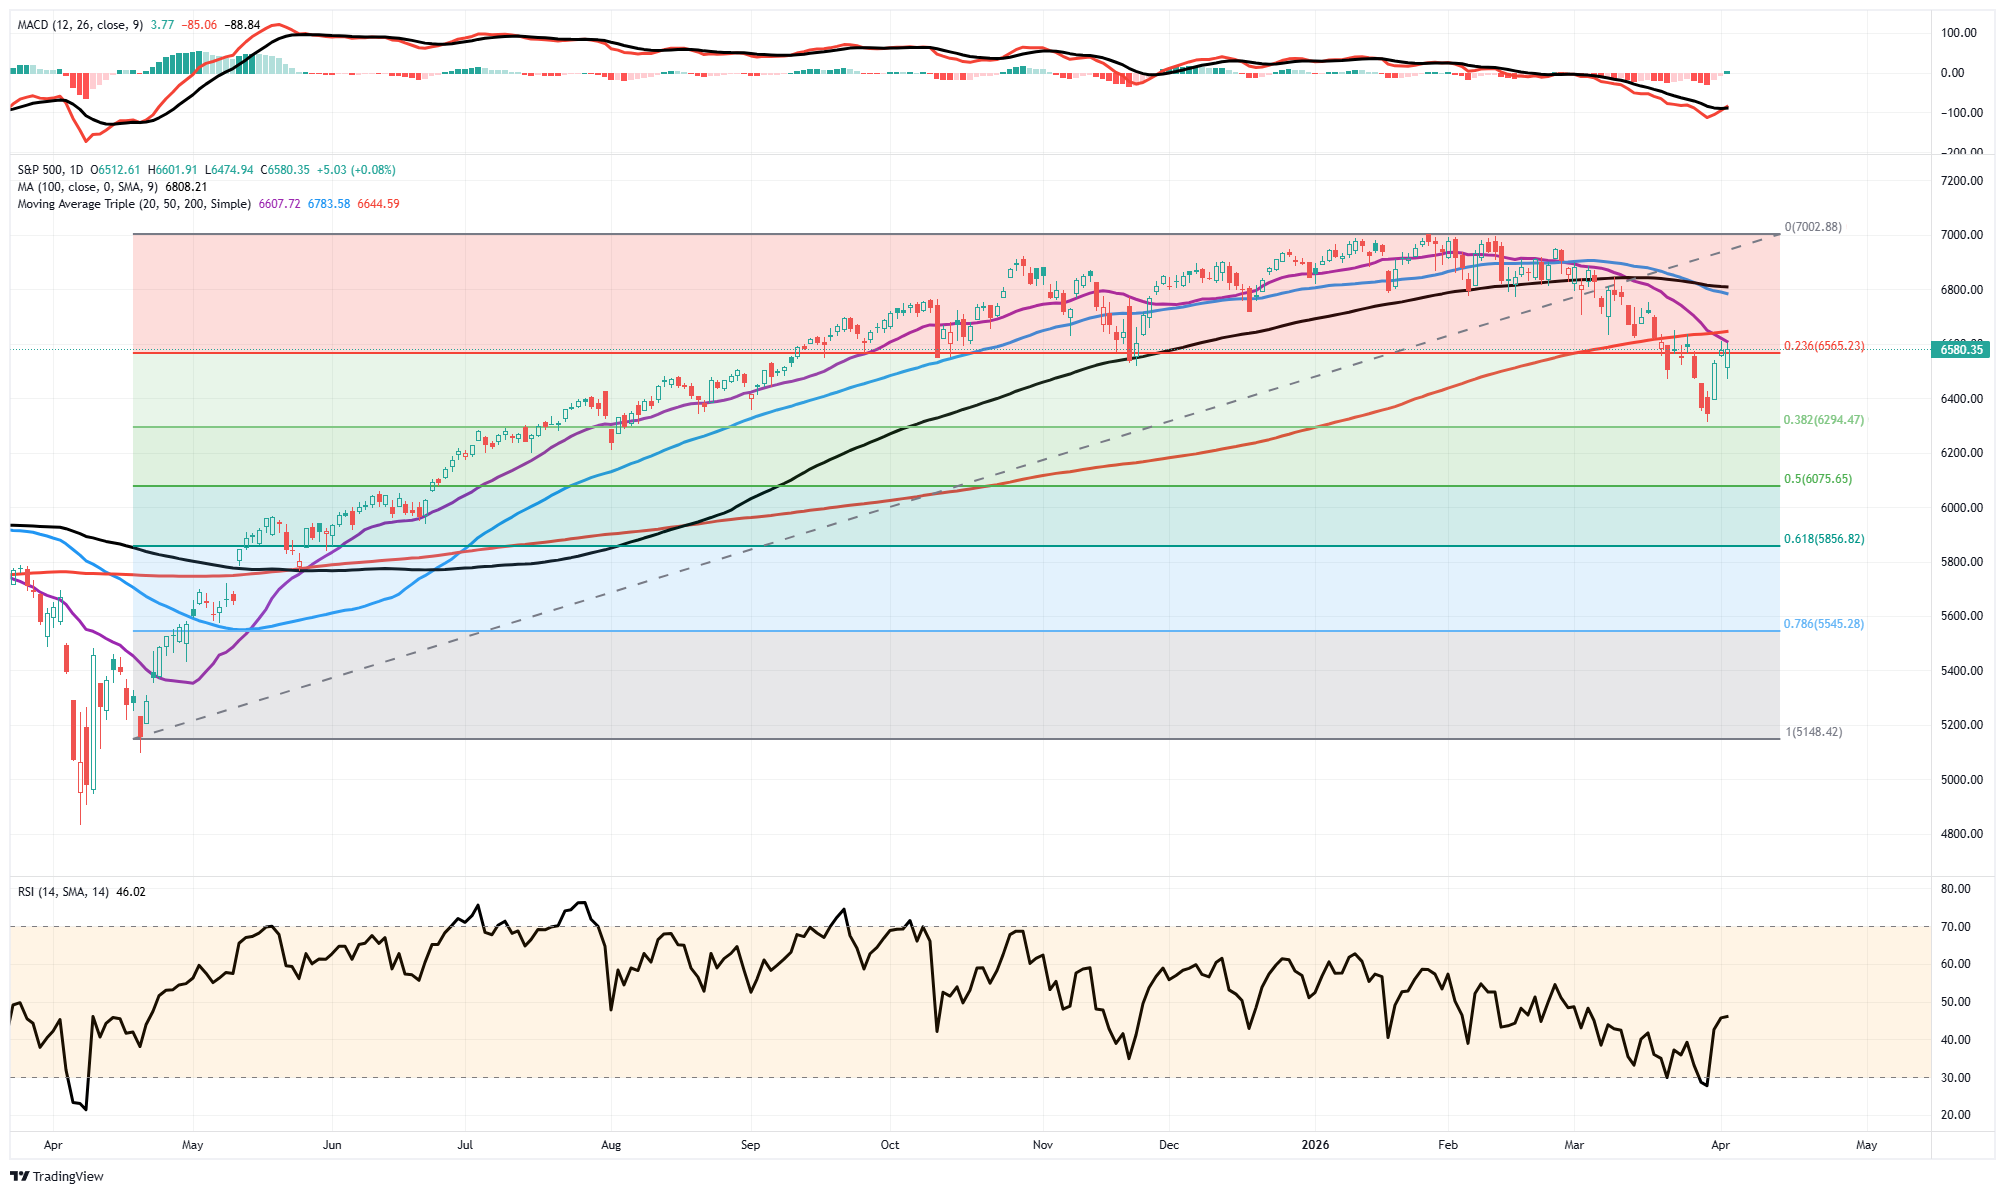
The internals tell us this bounce is real but fragile. As of Wednesday’s close, only 27.6% of S&P 500 constituents traded above their 50-day moving average, a percentile reading of just 12, meaning breadth has been this weak only 12% of the time. That is an extraordinarily narrow rally. Meanwhile, 49.2% remain above their 200-DMA (25th percentile), below average but notably above the sub-30% washout levels of the 2022 bear market. The RSI has recovered to 45.7 from the oversold low-30s in late March, and the McClellan Oscillator has turned positive after deeply negative readings. Both are constructive, but the percentage of stocks above the 50-DMA needs to expand well above 50% before we can call this anything more than a “reflexive bounce within a downtrend.“
So, is the market oversold enough for a sustained move higher? The short answer: the conditions are present for a tradeable rally, not a durable bottom. Seasonality helps as April is historically the second-best month for the S&P 500 (+1.4% avg per the Stock Trader’s Almanac), and earnings season kicks off with FactSet consensus at 13% YoY EPS growth. However, the macro overlay remains hostile: Brent near $117, the Fed has priced out cuts entirely (Macquarie expects a hike in 1H27, and the 10-year yield sits near 4.45%. The index closed Thursday still 1.2% below its 200-DMA (~6,642), and until price reclaims that level, the primary trend remains down. Investors who missed the bounce should not chase here.
Bottom line: If you are fully invested, this bounce is an opportunity to add hedges, not remove them. Consider put spreads on SPY or collar strategies on concentrated positions. If you’ve been building the shopping list we recommended, this isn’t the entry; that was the 6,300 level two weeks ago. The next entry comes on either a successful retest of March lows or a decisive close above the 200-DMA with breadth confirmation (50-DMA participation above 50%). Warren Buffett said it best Tuesday: he’d buy more Apple, “but not in this market.”
We agree. Defense over offense. Trade accordingly.

🔑 Key Catalysts Next Week
The first full week of Q2 is bookended by two events that will define the rate narrative for the next two months: the FOMC Minutes on Wednesday and March CPI on Friday. Everything else is secondary, other than what oil prices are doing.
The March 17–18 FOMC Minutes are the week’s first inflection point, but we already know the outcome. The Fed held rates steady at 3.50–3.75%, with only Miran dissenting in favor of a cut. However, the minutes will reveal how close the internal debate actually was. Given that the March meeting was the first to formally incorporate the Iran oil shock, the 15% global tariff regime, and the February payroll collapse into the Summary of Economic Projections, the minutes will be important to consider. In those projections, core inflation forecasts were revised higher to 2.7% for 2026, while GDP was upgraded to 2.4%. That combination, hotter inflation with resilient growth, justified the hold. But the question the markets need answered now is whether the spike in oil prices, which will eventually weigh on economic growth, changes that math.
Speaking of oil prices, Friday’s March CPI is the week’s anchor and arguably the most consequential inflation print of the year so far. February came in at +0.3% MoM headline and +2.4% YoY, with core at +0.3% / 2.8%. But March is the first month that fully captures the oil price surge toward $100 following the U.S.-Israel strikes on Iran. Energy-specific CPI rose 0.6% in February before the worst of the oil spike, which March will make materially worse. Food prices were already accelerating at +0.4% MoM. The core goods basket is where tariff passthrough resided, and RBC’s analysis flagged that declines in used-car prices had been masking the pressure in prior months. A hot March CPI could push rate cuts into December at the earliest, or off the table entirely. Any print above 0.4% MoM headline or 0.3% core will confirm those expectations.
Bottom line: The FOMC Minutes tell us what the Fed was thinking. The March CPI tells us whether they were right to hold. If inflation is accelerating while the labor market weakens, the policy trap is confirmed, and the market will have to price accordingly.

Need Help With Your Investing Strategy?
Are you looking for comprehensive financial, insurance, and estate planning services? Need a risk-managed portfolio management strategy to grow and protect your savings? Whatever your needs are, we are here to help.

💰 5-Consecutive Weekly Declines
In Tuesday’s Daily Market Commentary, we noted that the market had just experienced five consecutive weekly declines. That’s a lot, and as shown, it does happen, but not that often.
“The correction that we have seen so far has been quite normal, despite the more ‘doom and gloom’ narratives being expoused on the interwebs. Nonetheless, the recent 5-week streak of consecutive weekly declines is certainly worrisome. However, it isn’t unprecedented.”

As noted above, we did get a reflexive rally this past week, ending that streak of consecutive weekly declines. However, that latest spike in volatility left my inbox with questions piling up fast.
- Is this the beginning of something worse?
- Should you be selling? Buying? Standing still?
Let me give you the honest historical answer. I don’t know for certain, and historical data only gets you halfway to a useful decision.
Since 1965, the S&P 500 has recorded 26 separate instances of five or more consecutive weekly declines. That’s roughly once every 2.3 years, and these streaks feel catastrophic in real time. This is when investors make the most mistakes over time. The emotional stress of the decline, combined with “doomsayers,” drives investors to sell at the bottom. It is important to understand that, while these streaks feel alarming in real time, historical evidence suggests they function more as contrarian buy signals than as warnings of further collapse.
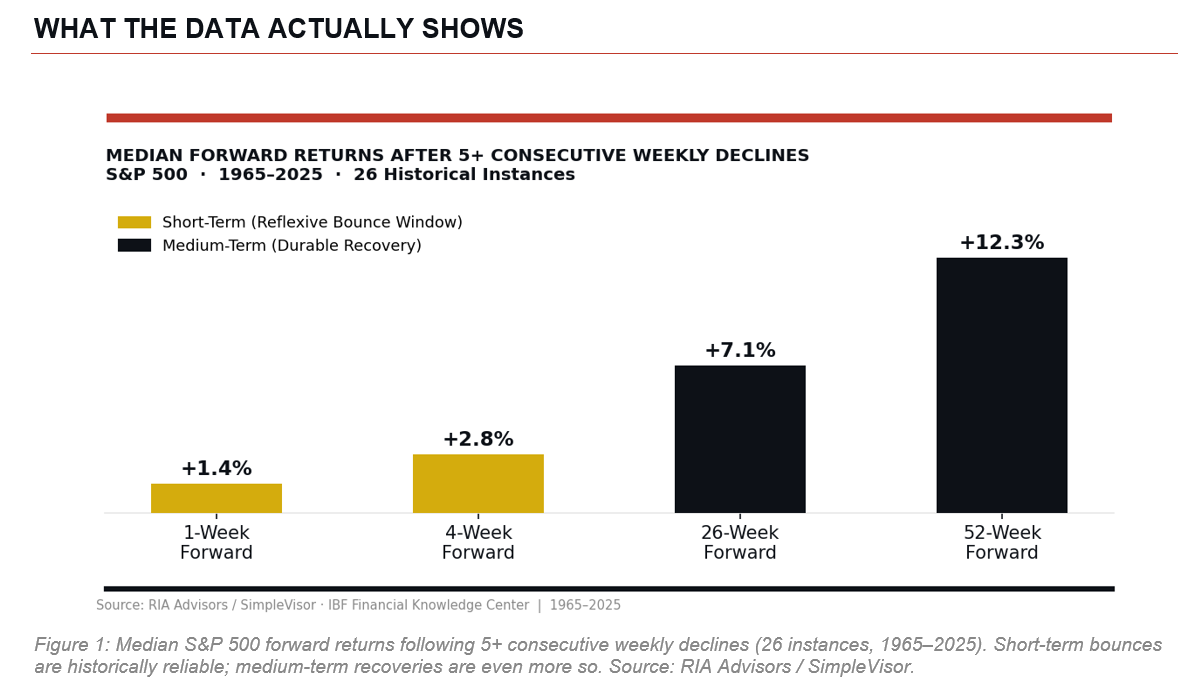
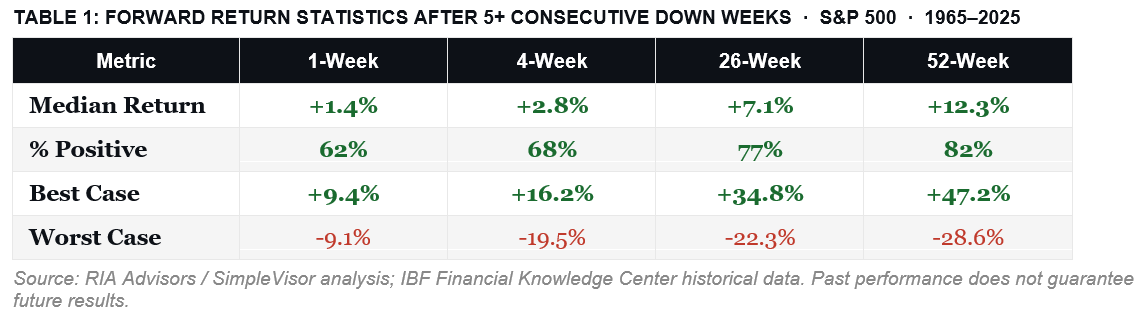
On average, the 4-week forward return following a fifth consecutive down week has been modestly positive, and the 12-month forward return has been meaningfully so. The data consistently shows that by the time the financial press is writing its most alarming prose, the market has already priced in a substantial portion of the bad news. That’s the mechanical reality of markets: they discount the future, often imperfectly and almost always uncomfortably early.
That pattern holds in both directions. The moments that feel like everything is in free-fall, as noted, those have historically functioned more like contrarian buy signals than warnings of collapse. In March 2020, a five-week wipeout of roughly 34% was fully recovered by August, and the index was 16% above its pre-COVID peak by year-end. After the October 1987 crash, 12-month forward returns were emphatically positive, despite the four-week forward return looking like a catastrophe.

The Reflexive Rally Was Not Surprising
The market rallied on Tuesday and Wednesday, with Tuesday’s rally one of the best trading days since 2022. However, that should also be unsurprising, since the best trading days tend to cluster with the worst market periods. As we noted in Stock Market Breadth on Monday:
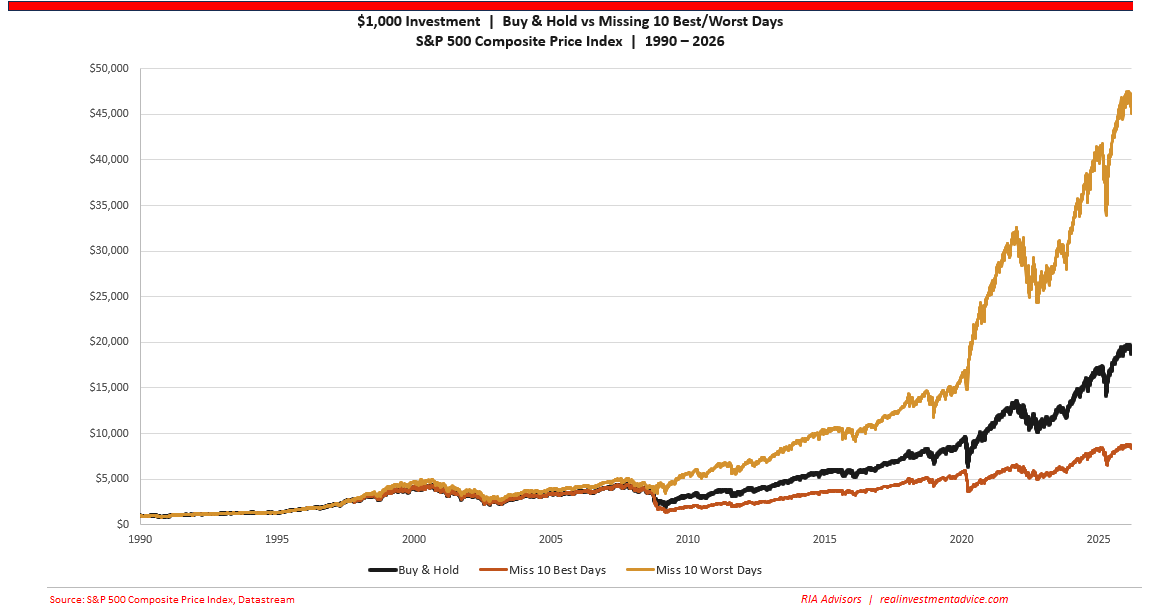
“The single most damaging decision most investors make during periods of falling stock market breadth is selling. The data on this is unambiguous. Seven of the market’s 10 best days in any given 20-year period occur within two weeks of the 10 worst days, according to JPMorgan Asset Management research. The best days follow the worst days because fear-driven selling creates dislocations that are rapidly corrected. You can see this in the chart below, that the best and worst days are clustered together.”
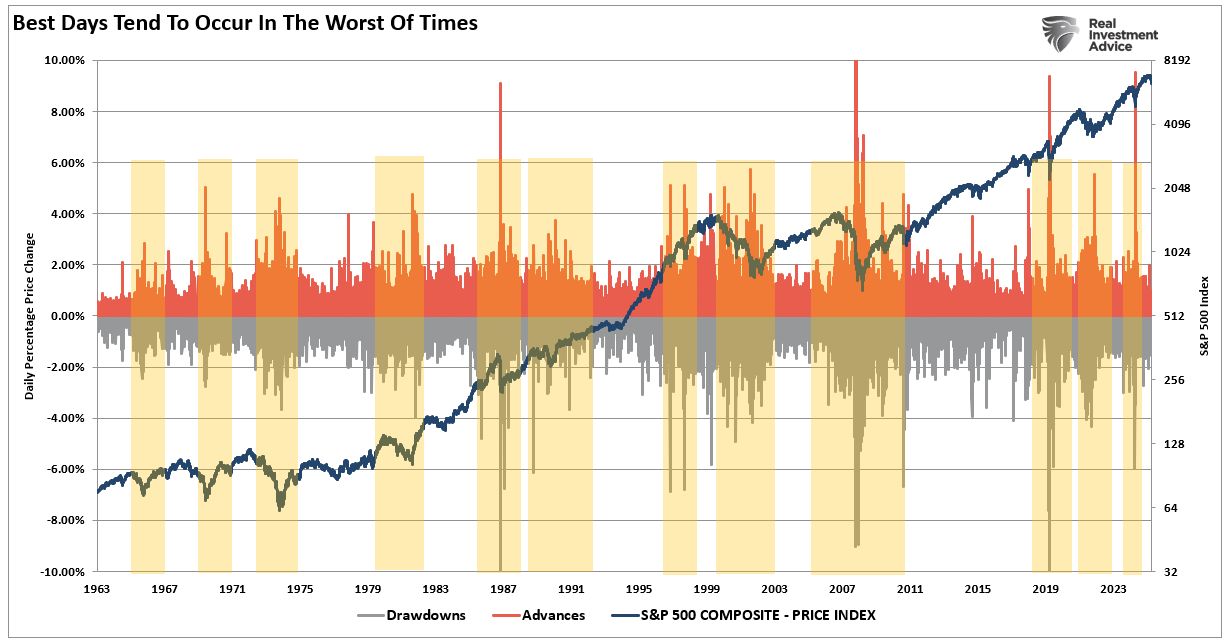
In other words, while investors are always told to just “buy and hold” because they will miss the 10-BEST days if they don’t, investors should focus on mitigating the risk of significant capital losses during those periods.
This doesn’t mean you can effectively miss all the bad days; however, given that higher-volatility periods tend to cluster, understanding when to reduce exposure can significantly improve outcomes over time. Even if you miss the 10-best days along the way. That math applies with particular force in setups like the current one. Since 1974, according to data compiled by Clear Perspective Advisors, the S&P 500 has returned more than 24% on average following a market correction. Only 25% of the 48 corrections since World War II have progressed into full bear markets. In other words, there is a 75% chance this correction will not turn into a bear market. However, dismissing that 25% entirely is just as foolish for future outcomes.
This is why the rally this past week was not unexpected. Oversold conditions, exhausted sellers, aggressive short positioning, and algorithmic covering all tend to converge after sustained selling pressure. Goldman’s trading desk noted this week that the capitulation checklist is nearly complete, with the S&P now below all key moving averages and below critical CTA selling thresholds. When those conditions are clear, the snap-back can be sharp. But it’s a trap.
Why do I say that? Because that is what I have learned repeatedly over 35 years of managing money. The rallies that come off oversold extremes are seductive precisely because they feel like confirmation that the worst is over. They’re fast, they’re loud, and they draw in sidelined capital chasing performance. Sentiment indicators flip from extreme fear to cautious optimism in a matter of days.
Bottom line: If the bull case for this rally is ‘stocks were down a lot, and people were scared,’ that’s not a fundamental argument. It’s a positioning argument. It expires quickly.
And in the current environment, the macro headwinds haven’t gone anywhere. Even if the Iranian conflict is resolved on Monday, private credit stress remains, the impact of higher oil and gasoline prices is working its way through the economy, and questions remain about artificial intelligence.
But there is another reason to fade this rally.
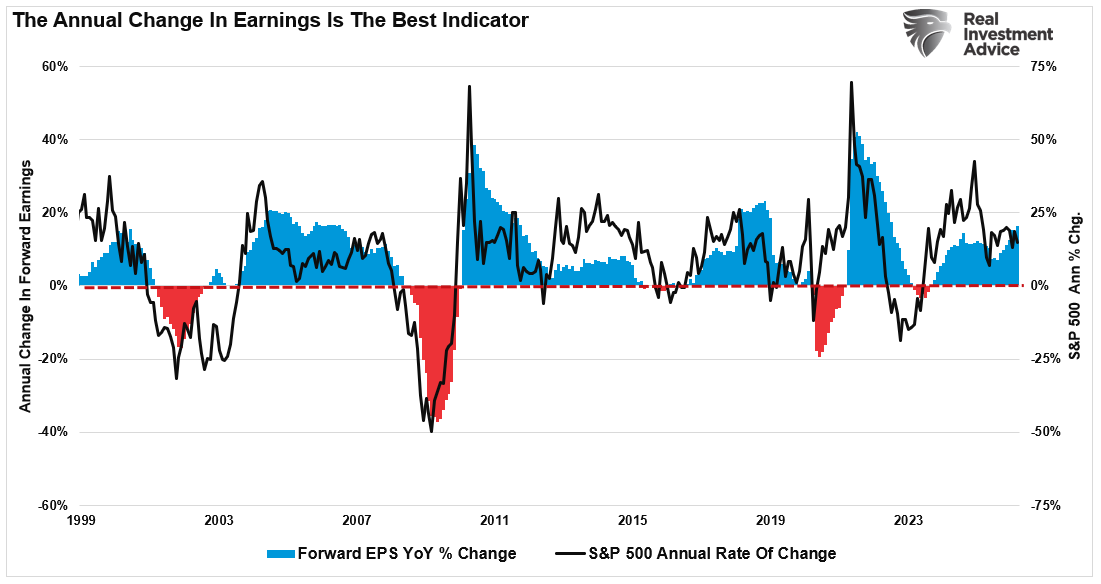
Earnings Hit Still Coming
The difference between a durable recovery and a dead-cat bounce is almost always visible in the underlying fundamentals, not the price action alone. Right now, the fundamentals argue for caution.
Goldman’s own scenario analysis puts a moderate slowdown path at 6,300 on the S&P 500 and a severe oil-shock path as low as 5,400. Neither of those scenarios is priced into current earnings estimates. S&P 500 companies are still being modeled at roughly $309 per share in earnings for 2026, figures built on assumptions about GDP growth and energy costs that the past eight weeks have materially challenged. When earnings revisions begin in earnest, they tend to hit in waves. We’re likely in the early innings of that process, and it will impact forward returns. The reason is that the market trades off forward earnings expectations; if those expectations fall, the market reprices for lower earnings growth.
Add to that the technical damage. Breaking below the 200-day moving average is not a minor event. Historically, a clean break below that level without a swift recapture has resolved to the downside more often than not. The index now sits below all key moving averages, and the burden of proof has shifted. Bulls need to prove the trend has reversed. Sellers don’t need to prove anything.
“As shown in the comparative table below, understanding the difference between a sustained break of the 200-dma and one that wasn’t was critical to future returns.” – Break Of The 200-DMA
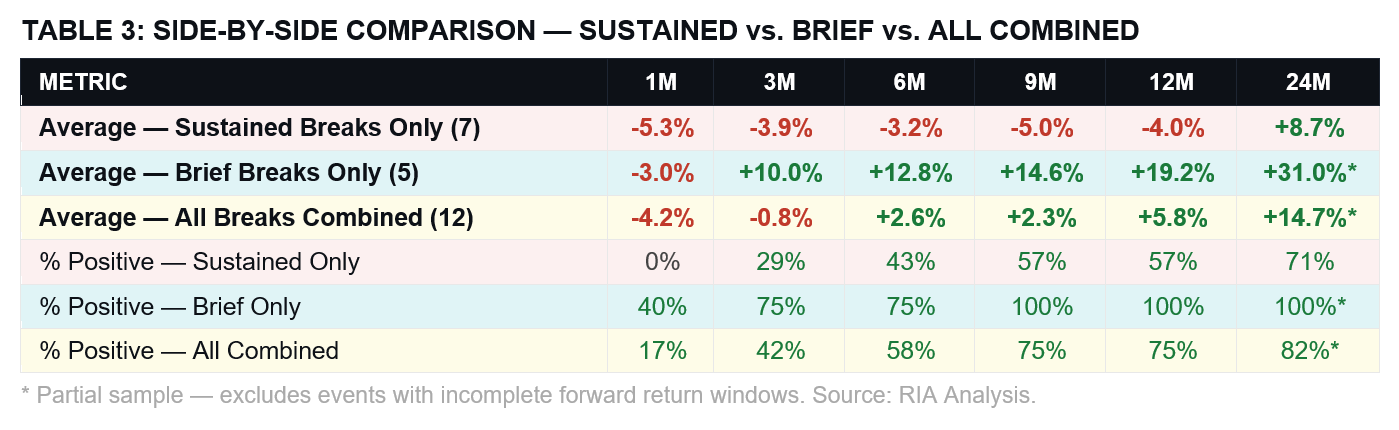
We are still within the first 4-weeks of the break of the 200-day moving average. The market rally this past week, following those five consecutive weekly declines, doesn’t mean the downside risk is over. If the market fails to climb above that now-critical resistance level, the potential for a retest of recent lows increases.
However, this doesn’t mean you get out of the markets entirely.
So, When Should You Start Accumulating
The one thing that bothers me most about the “Perpetual Purveyors of Doom” is that they repeatedly tell you for years that the market is going to crash. Eventually, they will be correct. However, what they don’t tell you is when to start buying the cataclysm. The voices are currently louder than ever.
However, the current market backdrop is nothing like the catastrophic events of the past, such as the financial crisis or the Dot-com crash. This is a well-needed correction after the massive post-“Liberation Day” rally last summer. Nonetheless, the damage done during declines is always troublesome, but it needs to be kept in perspective.
Yes, we certainly suggest using this rally to cash in and reduce risk. After consecutive weekly declines, a rally was inevitable. However, I am also not saying “sell everything” or “stay in cash indefinitely.” The market will eventually bottom and recover. The reason is that the market will eventually “price in” the risk and begin to look forward. The economy will adapt and begin to grow. As such, the question isn’t whether to own equities, it’s just a question of when and at what price.
There are four specific conditions I want to see before moving from a defensive to a constructive stance. None of them requires perfect clarity. All of them require meaningful evidence.
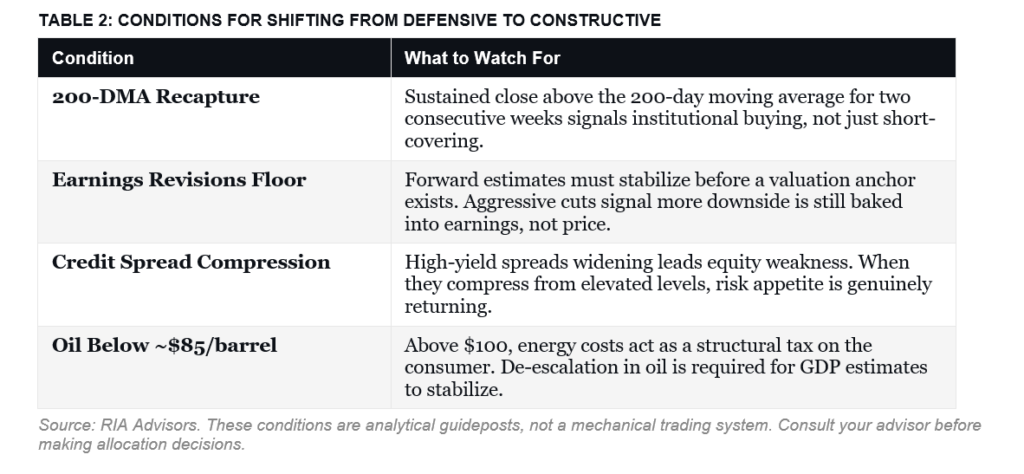
None of these conditions exists today. They may develop over the coming weeks or months. When they do, I’ll tell you. However, here is how to position for what is likely coming next.
Investor Tactics For What Comes Next
Following five consecutive weekly declines, the market’s bounce this week could continue for a bit longer. This isn’t rocket science, and is something we repeat often. It is just a process to manage near-term risk.
- Treat any near-term rally as an opportunity to rebalance, not to add exposure. Use strength to trim positions outside your target allocation and to reduce concentration in sectors most exposed to energy-cost pressure — consumer discretionary, industrials, and highly leveraged names.
- Raise cash to a level that lets you sleep at night and act when opportunities arrive. That number is different for every investor, but the point is intentional: cash is a position, not a failure of nerve. Having it means you can be opportunistic when others are forced to sell.
- Hedge risk that you want to keep. If you hold long-term positions, consider hedging them to reduce portfolio volatility.
- Watch the 200-DMA retake attempt closely. A failed retake — where the market rallies back toward that level and then rolls over — is one of the clearest signals that the intermediate-term trend remains down. A successful retake on expanding volume materially changes the picture.
- Stress-test your portfolio for oil above $100 through year-end. Goldman’s bear case is 5,400 on the S&P. That’s a decline from current levels that would test the tolerance of most retail investors. Know your number before the market finds it for you.
- Don’t abandon fixed income. Duration has been painful, but investment-grade credit and short-term Treasuries are doing exactly what they should: providing ballast. A barbell approach — short-duration credit on one side, selectively opportunistic equity exposure on the other — remains the structure most likely to survive what comes next.
Again, this is nothing new, and we can sum it all up in just five words:
Defense over offense. Trade accordingly.
🖊️ From Lance’s Desk
This week’s #MacroView blog is part one of a two-part series on oil shocks, the economic impacts, and the Federal Reserve’s response problem.

Also Posted This Week:
- Beta: A Powerful But Faulty Tool For Managing Risk – RIA – by Michael Lebowitz
- Stock Market Breadth: Warning Or Opportunity? – RIA – by Lance Roberts
📹 Watch & Listen
We discuss the market’s failure to break above the 200-day moving average and the two paths investors should watch in the weeks ahead.
Subscribe To Our YouTube Channel To Get Notified Of All Our Videos
📊 Market Statistics & Analysis
Weekly technical overview across key sectors, risk indicators, and market internals

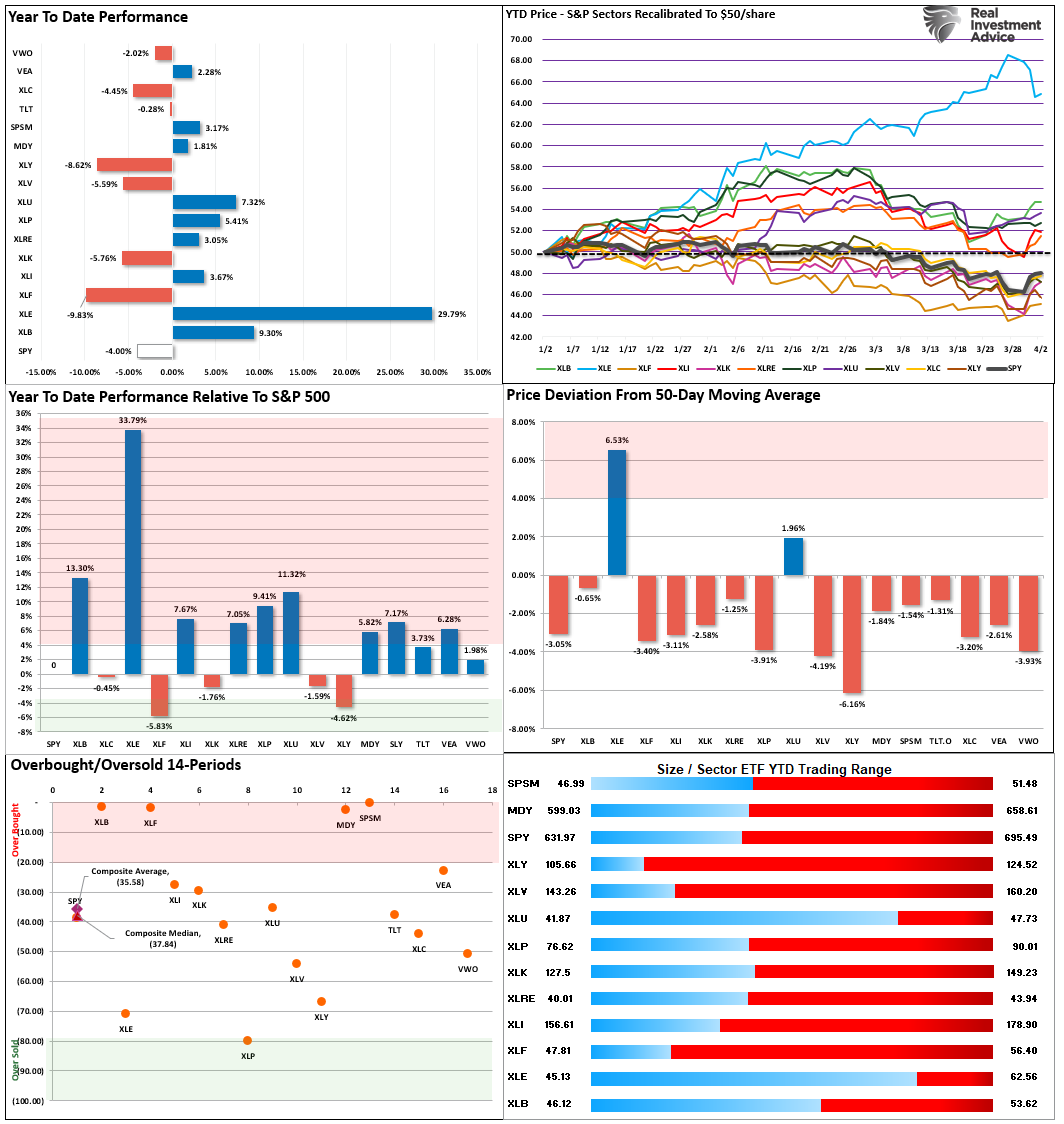
💸 Market & Sector X-Ray: Market Cracks Support
As noted last week: “With every other sector extremely oversold, the logical setup now is for that rotation out of energy into other areas of the market to begin as soon as clarity on Iran emerges.” As shown in the upper right box, that is what happened this past week. However, with no real clarity on a resolution for Iran, the current rotation will likely be short-lived. The relief rally this past week is an opportunity to reduce risk and rebalance portfolios for now.
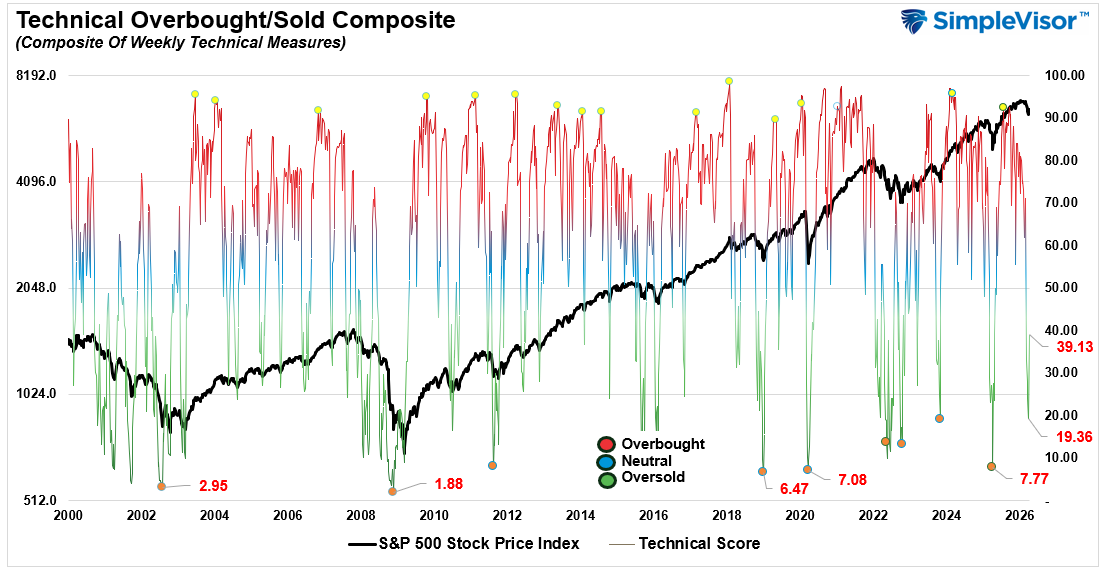
📐 Technical Composite: 39.13 – Relief Rally From Deep Oversold
As stated last week, “The odds of a reflexive rally are increasing. We are currently at levels we haven’t seen since 2022.” That reflexive rally came last week, and improved technical conditions. However, if this is a bounce within a corrective cycle, it probably won’t last long.
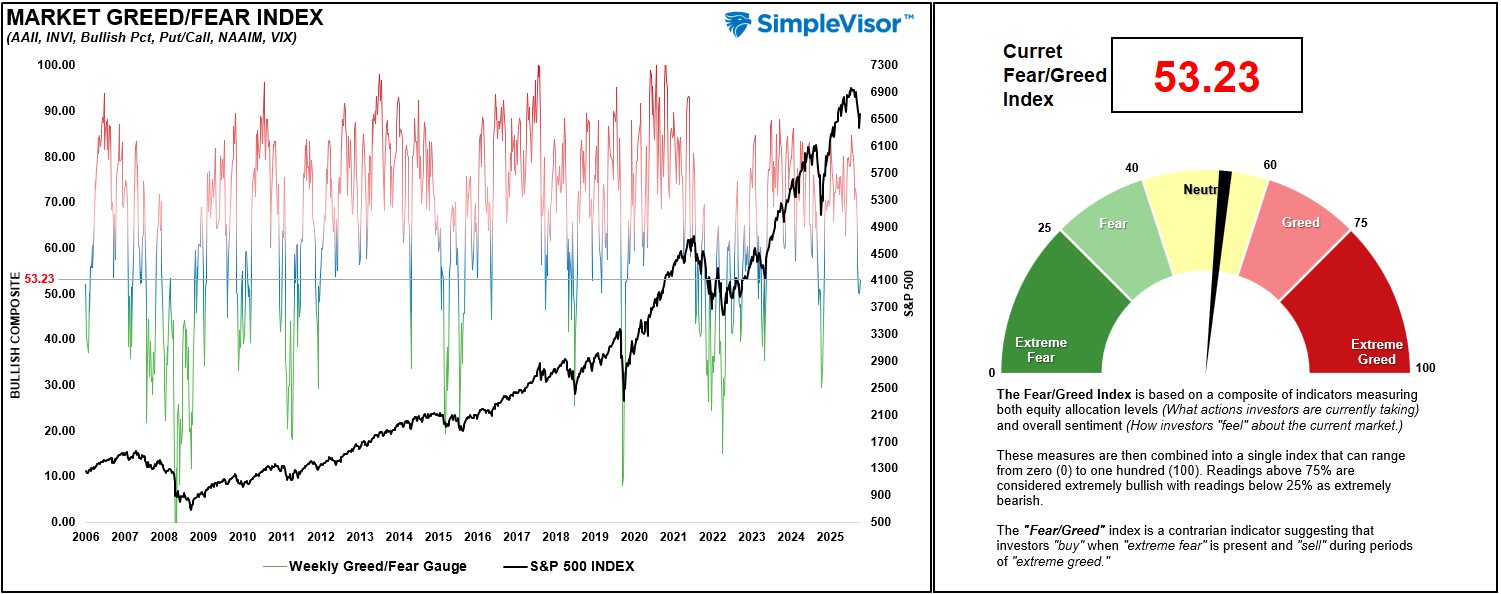
🤑 Fear/Greed Index: 53.23 – Investors Remain Cautious
This past week, sentiment stabilized as the market bounced from deeply oversold levels. As we noted last week, “The Iran conflict continues, and energy prices remain elevated, pushing investors to become increasingly cautious. While not at ‘fear levels’ yet, the selloff has been rather sharp, so a reflexive rally is likely before a further decline.“ The reflexive rally is your opportunity to rebalance risk.
🔁 Relative Sector Performance
As noted last week, “Given the divergence between Energy and the rest of the market, profit-taking in Energy seems prudent.” This past week, energy sold off while the rest of the market rallied. Energy remains overbought, although in a better position, and Discretionary, Financials, and Healthcare are the most oversold.

📊 MFBR Index (Money Flow/Breadth Ratio Indicator): 35% = Risk Off
NEW! MFBR Index: The Money Flow Breadth Ratio (MFBR) model is a rules-based equity allocation framework that uses weekly S&P 500 money flow data to generate buy, sell, and neutral signals. It is designed to systematically adjust portfolio equity exposure in response to the direction and persistence of institutional capital flows, aiming to reduce drawdowns while capturing the majority of market upside.
As of the most recent weekly reading, the MFBR stands at 35% and falling, placing it in the 35–40% zone — the single worst sub-range within SELL territory. A 25-year backtest covering 1,351 weekly observations from January 2000 through March 2025 reveals just how unfavorable this zone has been historically. Across all 110 weeks where the MFBR registered below 40%, the average forward return was +0.3% at one month, -0.1% at three months, and +1.8% at six months — well below the all-period baseline of +0.6%, +1.8%, and +3.7% over those same horizons. Win rates tell an even starker story: only 53.2% of SELL periods saw positive returns at one month and just 46.8% at six months, compared to the baseline win rate of 69.5% at six months.

📊 Sector Model & Risk Ranges
Both the Dollar and Energy remain well outside their respective risk ranges, suggesting that reversals are likely if there are any short-term resolutions in Iran. Outside of those two sectors, the massive deviations we saw in other sectors have all been reversed, which is why we repeatedly warned to take profits in those areas. The probability of a rather strong reflexive rally is building, particularly as we move into April.

Have a great week.
Lance Roberts, CIO, RIA Advisors

