Going forward, we added commentary and graphs on major market indexes and bonds to our weekly analysis.
The Relative Value Report provides guidance on which sectors, indexes, and bond classes are likely to outperform or underperform the S&P 500 or appropriate benchmark.
Click on the Users Guide for details on the model’s relative value calculations as well as guidance on how to read the model’s graphs.
This report is just one of many tools that we use to assess our holdings and decide on potential trades. Just because this report may send a strong buy or sell signal, we may not take any action if it is not affirmed in the other research and models we use.
Commentary
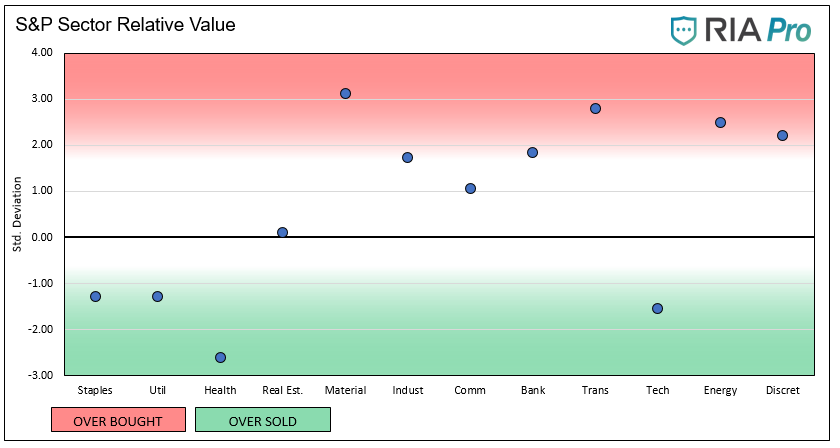
- As we suspected, Thursday’s sharp decline pushed most sectors towards fair value. Oversold sectors like Staples, Utilities, and Technology outperformed, while the recent overbought sectors, Materials, Transports, and Energy are now not as nearly overbought.
- Healthcare remains the only oversold sector, while Discretionary is the only deeply overbought sector. Amazon is the sole reason Discretionary did not retreat as much as the other sectors.
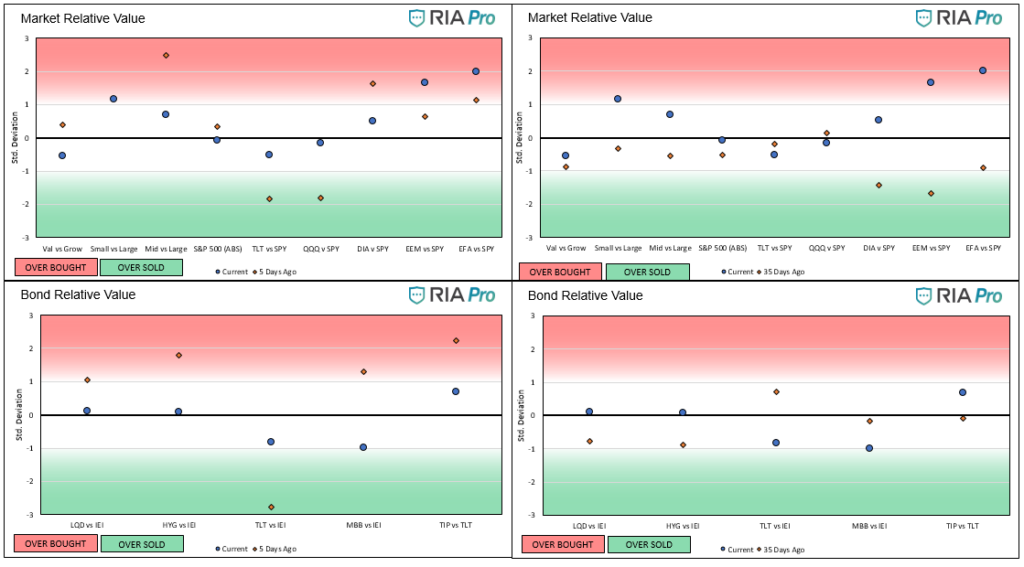
- Similar story on the Index front. Those markets that underperformed over the last few weeks outperformed. For instance, QQQ moved from deeply oversold to fair value versus the S&P. The most overbought indexes, small and mid-cap, reversed sharply from deeply overbought. They remain overbought but not as extreme.
- Long Treasury bonds (TLT) moved much closer to fair value versus the S&P as well as to shorter-term Treasury bonds (IEI).
- Mortgage bonds (MBB) are starting to look like an attractive rotation in the fixed income arena.
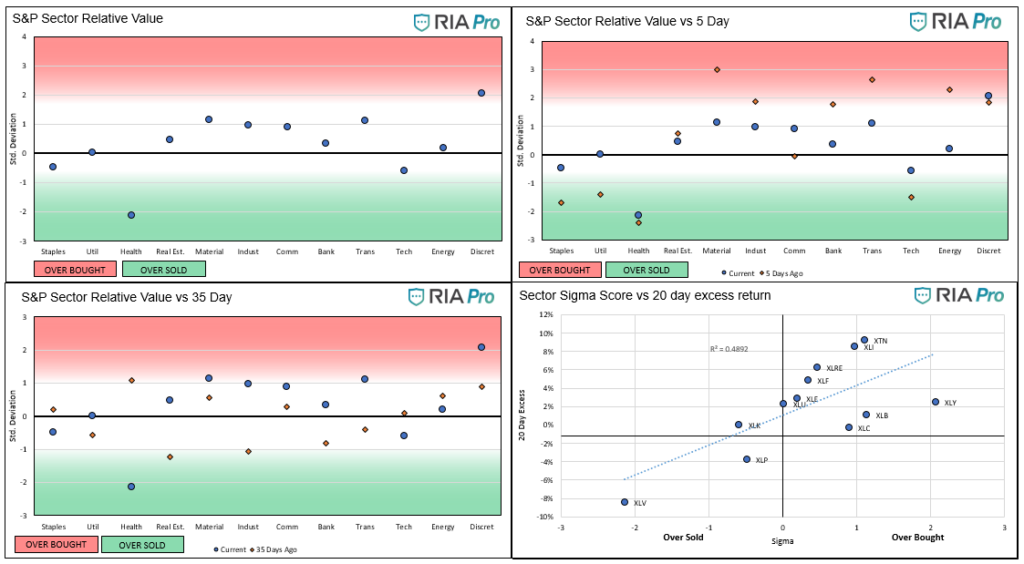
- The R-squared on the sigma/20 day excess return (Sectors) scatter plot is .4892. The weaker correlation versus prior weeks is not surprising given the extreme moves on Thursday.
Graphs (Click on the graphs to expand)
The ETFs used in the model are as follows:
- Staples XLP
- Utilities XLU
- Health Care XLV
- Real Estate XLRE
- Materials XLB
- Industrials XLI
- Communications XLC
- Banking XLF
- Transportation XTN
- Energy XLE
- Discretionary XLY
- S&P 500 SPY
- Value IVE
- Growth IVW
- Small Cap SLY
- Mid Cap MDY
- NASDAQ QQQ
- Dow Jones DIA
- Emerg. Markets EEM
- Foreign Markets EFA
- IG Corp Bonds LQD
- High Yield Bonds HYG
- Long Tsy Bonds TLT
- Med Term Tsy IEI
- Mortgages MBB
- Inflation TIP

