Inside This Week’s Bull Bear Report
- Consumer Data Suggests Economy Is Weakening
- How We Are Trading It
- Research Report –The Risk Of Recession Isn’t Zero
- Youtube – Before The Bell
- Market Statistics
- Stock Screens
- Portfolio Trades This Week
Nvidia Wins The Day
Last week, we discussed that the markets surged to all-time highs as a plethora of disappointing economic data and a weaker-than-expected inflation print lifted hopes of Fed rate cuts in the coming months. Over the last few trading days, the markets had to focus on the minutes from the previous FOMC meeting and earnings from Nvidia.
The FOMC minutes revealed little new information. Inflation remains stickier than expected, keeping the Fed on pause from cutting rates. However, recent speeches by Fed members did not indicate any real consideration of hiking rates. The market was calm following that release as all eyes focused on Nvidia earnings.
As has been the case over the last few quarters, Nvidia failed to disappoint. It announced earnings and revenue that beat expectations and a 10-1 stock split.
“Nvidia reported revenue for the first quarter ended April 28, 2024, of $26.0 billion, up 18% from the previous quarter and up 262% from a year ago. For the quarter, GAAP earnings per diluted share was $5.98, up 21% from the previous quarter and up 629% from a year ago. Non-GAAP earnings per diluted share was $6.12, up 19% from the previous quarter and up 461% from a year ago.”
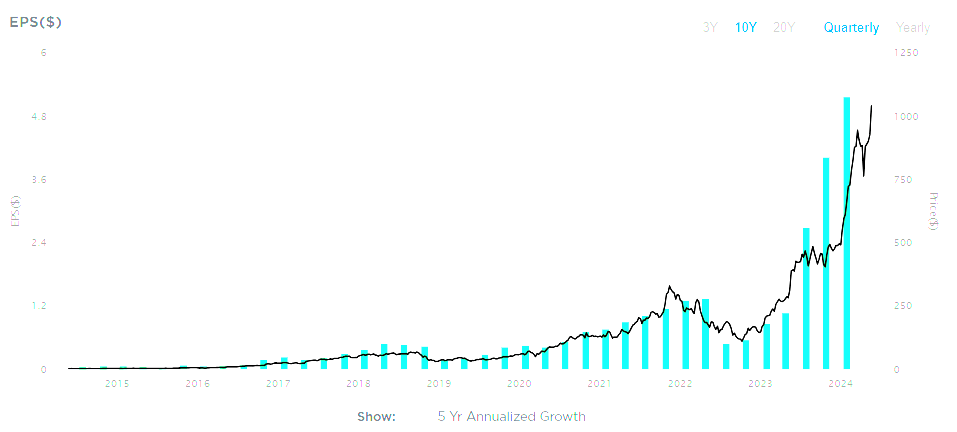
Such lifted the stock by 10% on Thursday, but the rest of the market sold off as traders took profits from the FOMC announcement.
From a technical perspective, the markets remain on a current MACD “buy signal” and have cleared all previous resistance levels. Furthermore, the 20-DMA crossed above the 50-DMA, providing additional support to any short-term market correction. The 20-DMA will now become running support for the market. While investors should expect corrections, the 20-DMA should contain any decline, providing an entry point to add exposure as needed.
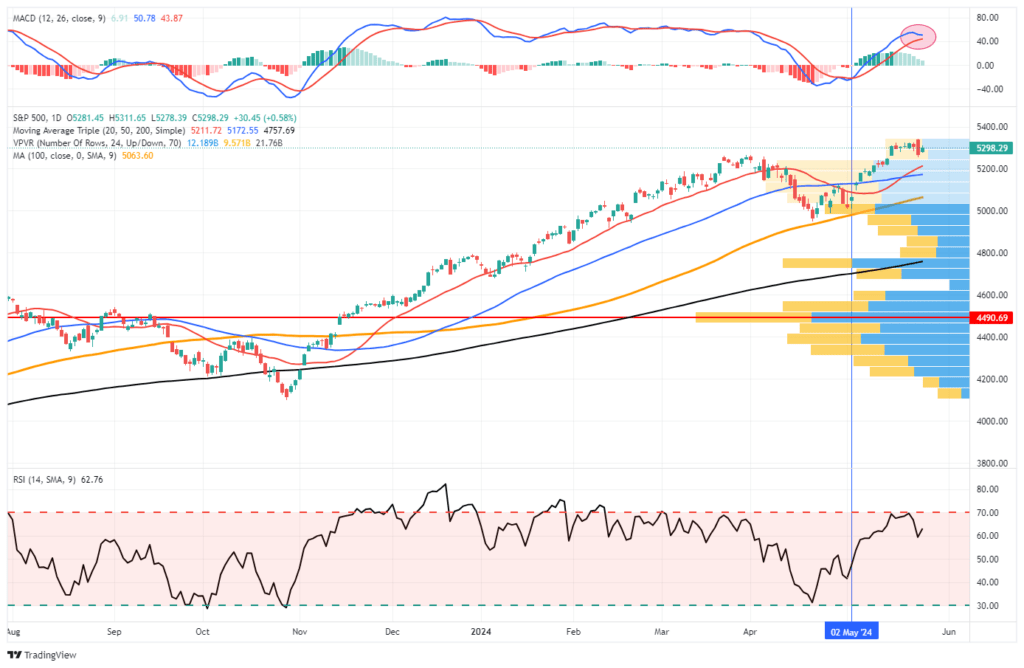
When the MACD signal crosses, it will provide a signal to reduce risk and rebalance exposure as needed. For now, the bulls maintain control of the market narrative. Trade accordingly.
Need Help With Your Investing Strategy?
Are you looking for complete financial, insurance, and estate planning? Need a risk-managed portfolio management strategy to grow and protect your savings? Whatever your needs are, we are here to help.

Consumer Data Suggests Economy Is Weakening
Last week, we discussed that “bad news is good news” for the market as it supports the hope of a more aggressive easing of monetary policy from the Fed. To wit:
“It’s ironic that market participants hope for a recession, as the subsequent infusion of monetary accommodation should push stock prices ‘to the moon.’ Of course, the real-world devastation caused to middle and lower-class American families, as they lose their jobs, benefits, and housing, is anything but beneficial.
Nonetheless. last week’s economic reports have been bad enough to send markets surging to all-time highs. Starting with retail sales for April, which came in unchanged despite rising gasoline prices, suggests that the consumer continues to weaken.”
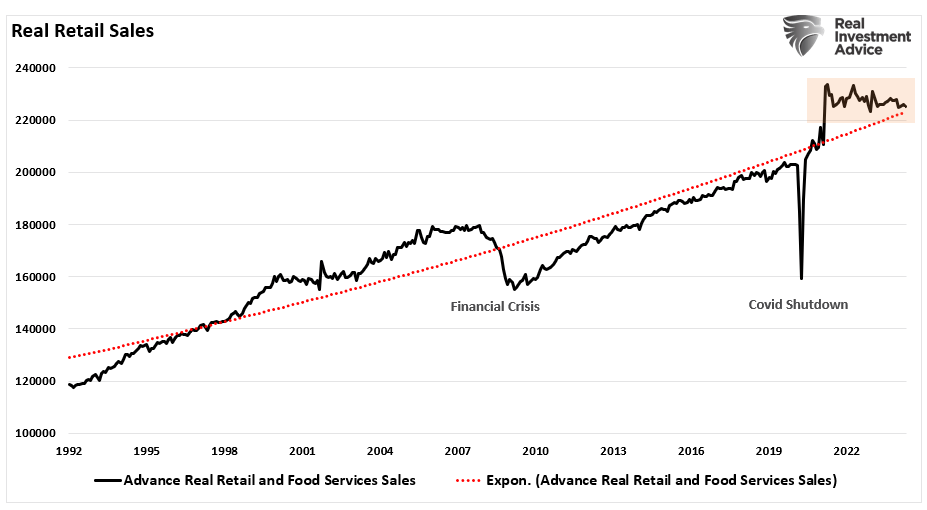
Since retail sales comprise roughly 40% of Personal Consumption Expenditures (PCE), which is nearly 70% of the GDP calculation, the data trend is critical to assessing economic health. On an inflation-adjusted basis, consumer data like real retail sales suggests the consumer continues to weaken. While spending more to buy the same goods or services may look good on paper, the average household has less money to spend elsewhere.
When retail sales declined, as in 2008 and 2020, the economy was in a recession. While there are many headline stories about the strength of the consumer, retail sales have not grown since 2020. While retail sales have not fallen below the long-term growth trend yet, the current trajectory of retail sales shows that such will likely occur later this year.
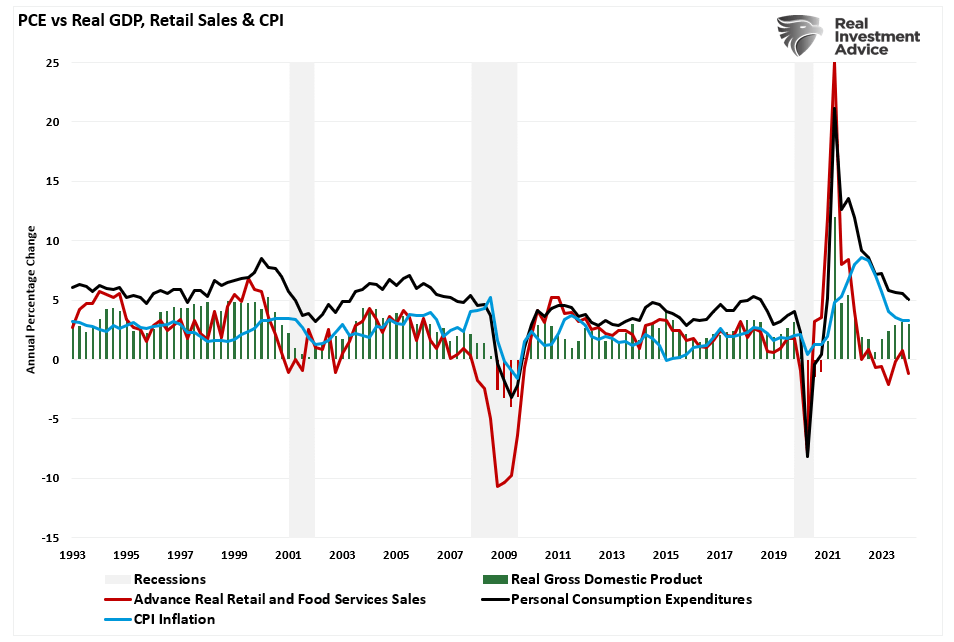
The strength of the consumer is all-important to economic growth. As shown, retail sales tend to lead PCE. The recent uptick in economic growth during the last two quarters of 2023 coincided with an uptick in retail sales activity. However, that has since reversed, suggesting we will likely see slowing economic growth and lower inflation readings by the end of this year.
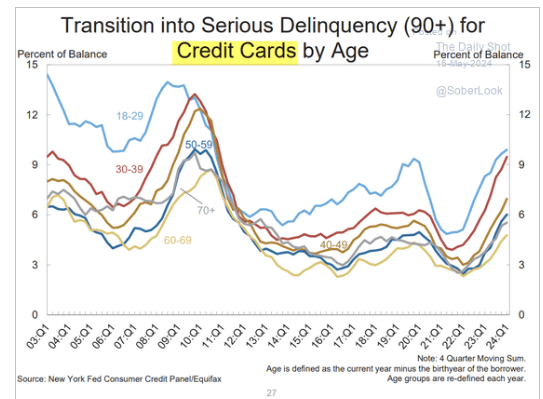
As we noted last week, consumers appear to have reached the limit of taking on additional debt to fund their living standards.
“The more troubling trend reveals itself when we dig in further: the level of borrowers now in “Serious (90+ days)” delinquency on both credit cards and auto loans has risen sharply.”
That reduction in spending power is visible in corporate earnings reports directly related to the consumer.
Warning Messages Rising
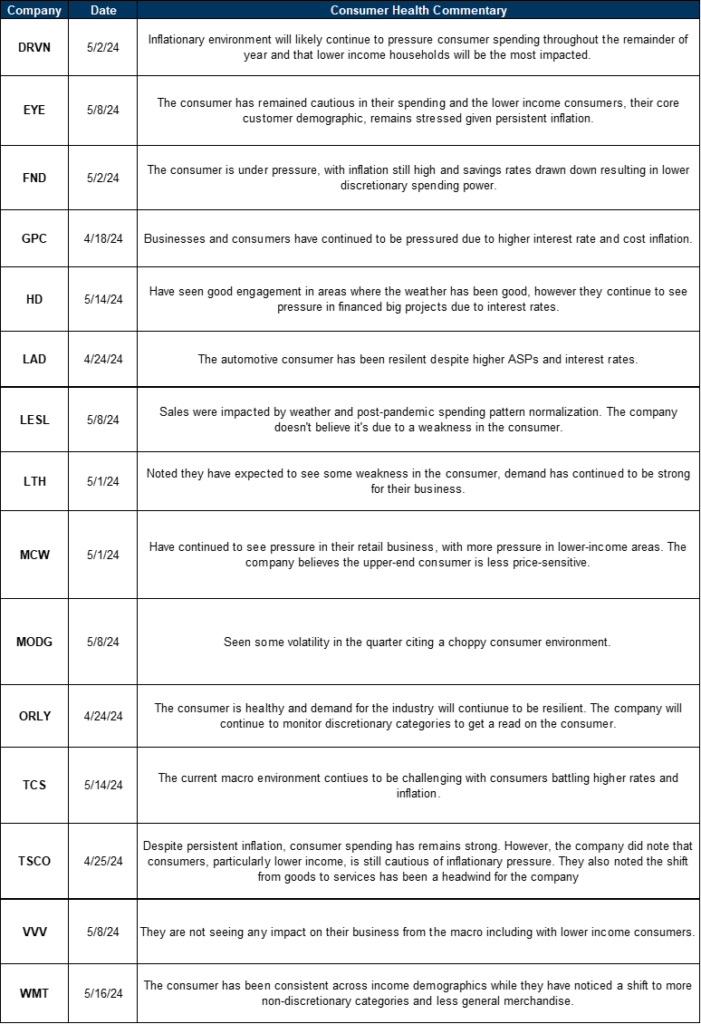
With the Q1 earnings season behind us, a central theme emerges from corporate America – the consumer is in trouble.
“With >75% of the US consumer universe having reported Q1 results, we see indications that the US consumer is proving more stretched than previously anticipated as inflation combined with a bit of softening in the macro (lower payrolls & an uptick in unemployment in April), elevated gas prices & high interest rates continue to eat into spending power & consumer confidence.” – Bonnie Herzog, Goldman Sachs
Numerous company reports in the retail space relayed that message during their respective conference calls.
Those words of caution are visible in other consumer data like the confidence composite index. That index bottomed in October 2022 and improved with the subsequent stock market rally. Such was unsurprising as rising asset prices boost the wealth effect. However, that is a temporary benefit, as when savings are exhausted, rising asset prices no longer matter. That increase in consumer confidence appears to have run its course, and given the historical correlation, we may see further weakness in consumer data in the months ahead.
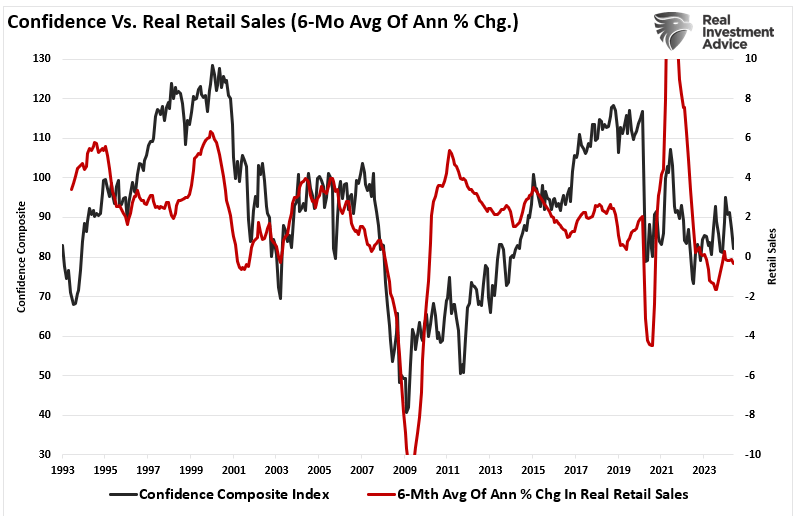
As noted, given the importance of retail sales to economic growth, economic growth will likely follow suit if consumer confidence weakens further.
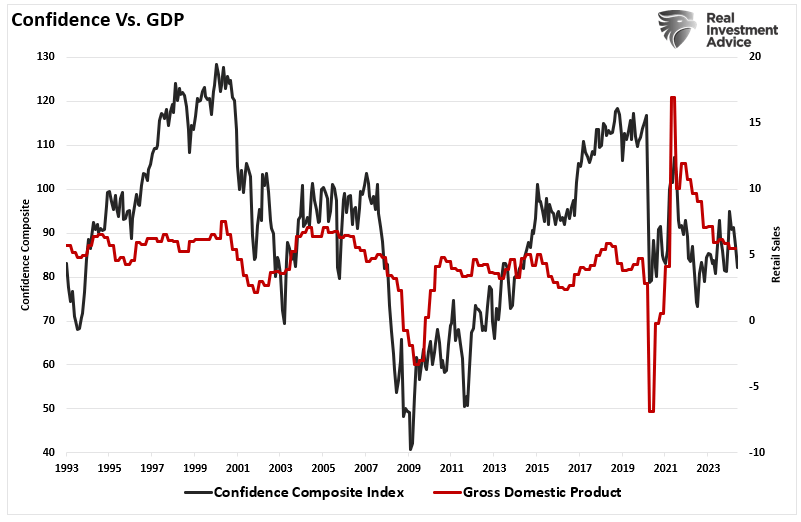
Investors should not readily dismiss consumer data’s warnings. Given that consumption comprises nearly 70% of economic growth, this seriously affects corporate earnings and profits in the quarters ahead.
An Inflation Myth
Consumer data is essential to the markets because economic activity is where corporate revenue, profits, and earnings come from. However, before we get there, we must clear up a prevailing myth circulating social media that comes directly from the Biden Administration.
“If you take a look at what people have, they have the money to spend. It angers them and angers me that you have to spend more. It’s like 20% less for the same price. That’s corporate greed. That’s corporate greed. And we have got to deal with it. And that’s what I’m working on.” – CNN
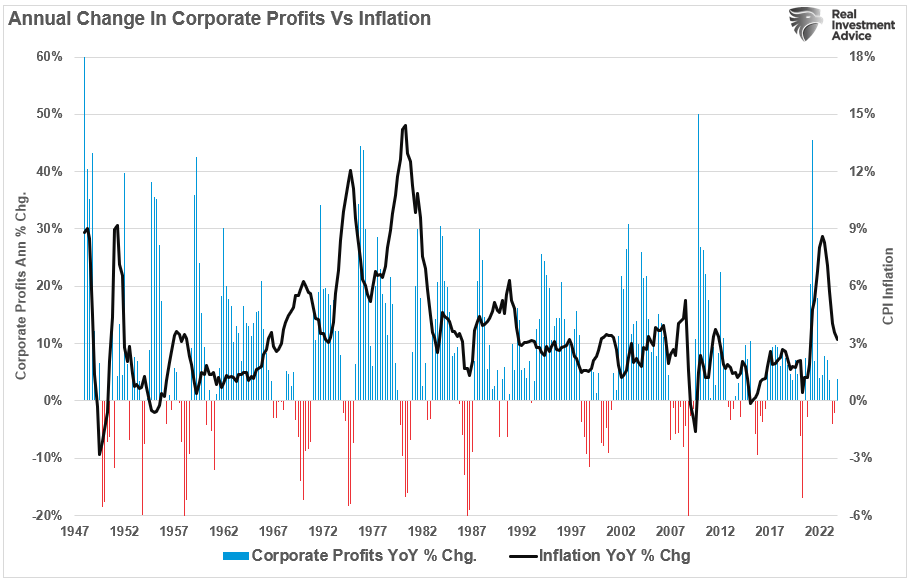
Yes, prices have certainly gone up due to inflation. However, that wasn’t the fault of corporations. The surge in inflation directly resulted from the supply-to-demand imbalance caused by shutting down the economy (supply) and increasing household purchasing power by sending them checks (demand).
Since corporations’ responsibility to shareholders is to remain in business, they must pass on as much of the inflation as possible to consumers. In 2020 and 2021, corporations could pass on most of the inflationary increase to consumers as they were willing to spend the government’s money. As inflation declines because consumers decrease spending, corporate profit growth also weakens.
If you use a two-year average of corporate profits minus inflation, we see the same. Again, when inflation surged in 2020, corporations could pass on the bulk of the cost increases to consumers. Today, as inflation slows due to declining demand, corporations must absorb the inflation to sell products or services.
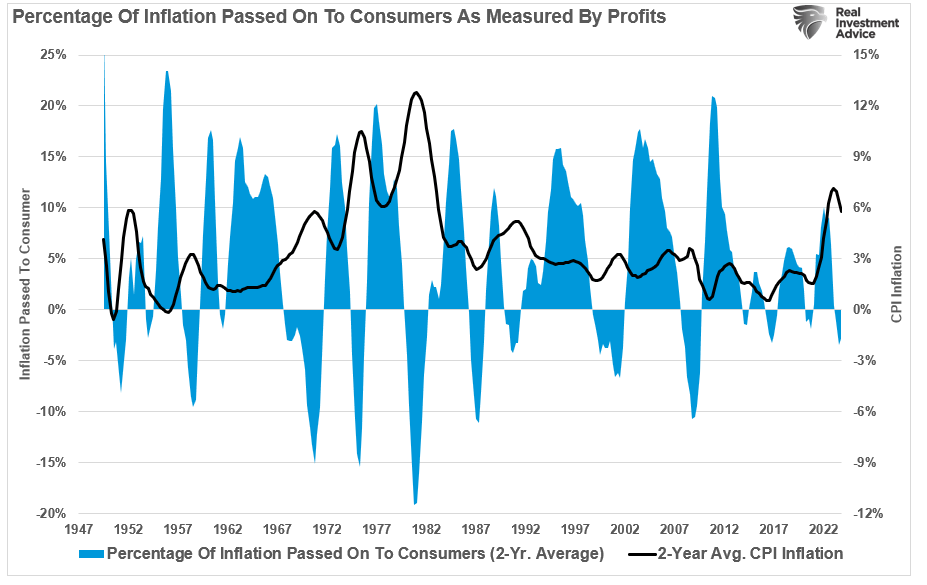
It is essential to understand that corporations are NOT driving inflation; the consumer is. Corporations merely react to demand and adjust pricing and supply to maintain profitability. When the consumer slows down, corporations cut prices to reduce supply. Such was evident in the latest price cuts from Walmart and Target.
“Target will lower everyday regular prices on approximately 5,000 frequently shopped items across its assortment. The retailer has just reduced prices on about 1,500 items, with thousands more price cuts planned to take effect over the course of the summer.
John Furner, Walmart US’ chief executive, said stores have already issued 7,000 rollbacks. This move is intended to boost food sales in the second half of the year and prevent low-income consumers from trading down to Dollar Generals.
These cuts will undoubtedly impact earnings later in the year.
Earnings And Profits At Risk
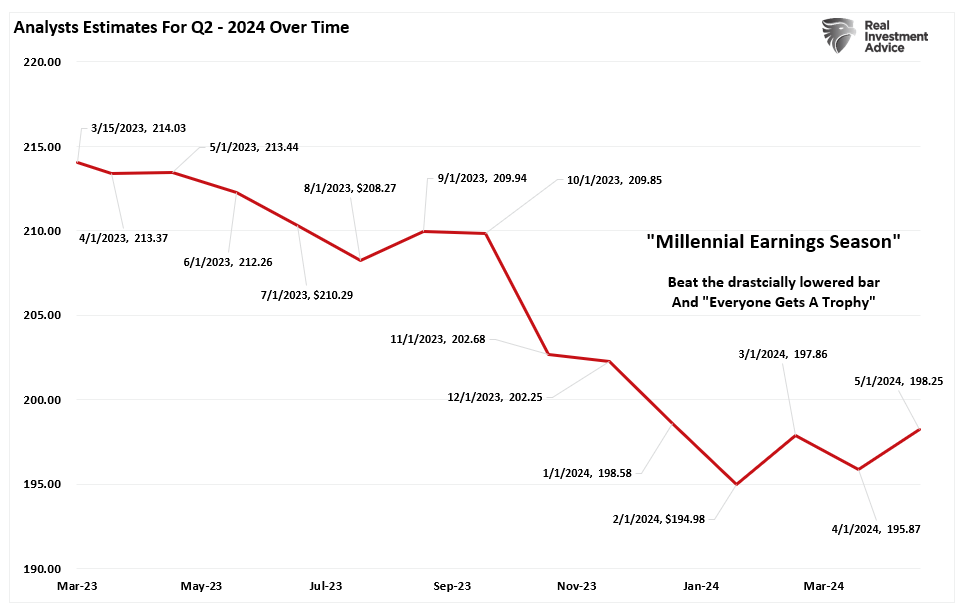
As we enter the Q2 earnings season, we have seen analysts get slightly more optimistic over the last few months as Q1 earnings beat previously lowered expectations. However, the estimates for Q2 are dramatically lower than they were 12 months ago, even though the market is considerably higher in price.
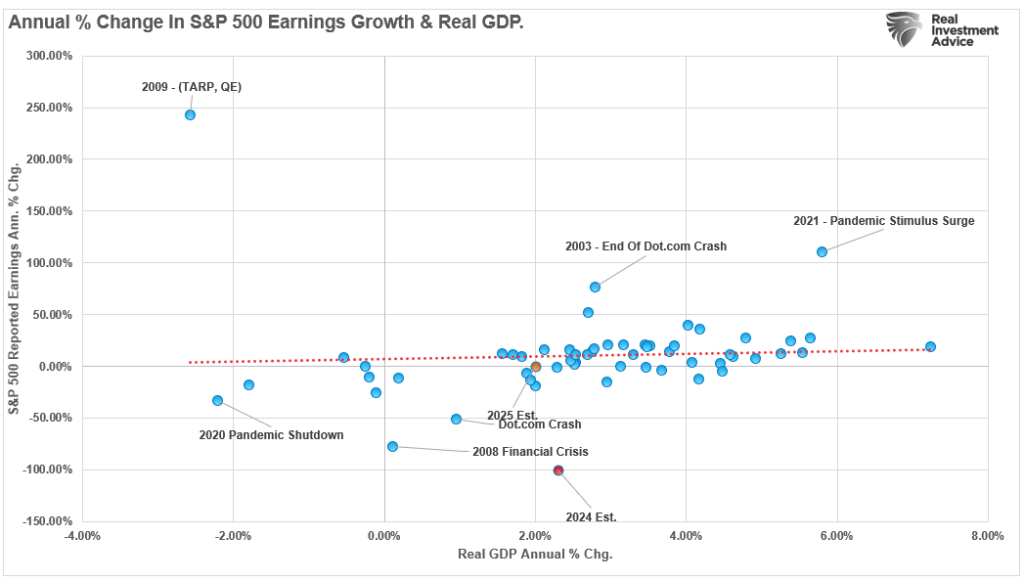
The risk to investors is ultimately the disappointment from a market priced for perfection. By the end of 2025, Wall Street analysts expect earnings to grow to roughly $250/share. That expectation puts the deviation of earnings from the long-term growth trend on par with the post-pandemic boom peak and the Real Estate/Credit Bubble in 2007.
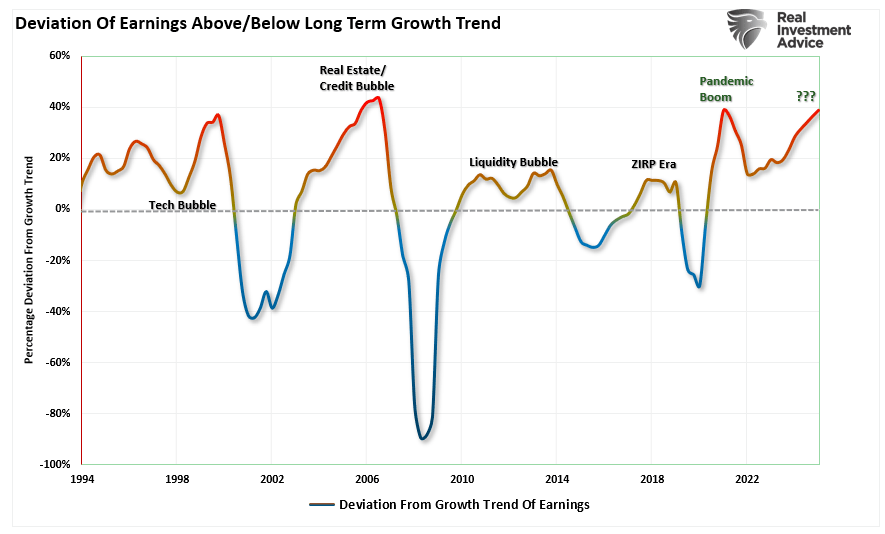
Given the current state of consumer data and the potential for slower economic growth in the months ahead, current Wall Street expectations seem overly optimistic. Furthermore, given the correlation between earnings and economic growth, a more cautious outlook would seem in order.
As we noted last week:
“For investors, the most significant risk to portfolios is not inflation but most likely disinflation as the economy, and ultimately earnings, come under pressure in the months ahead. Such is crucial given that expectations for earnings growth in the overall index remain elevated, but that growth depends on just 7 stocks. In fact, since the beginning of this bull market cycle in Q4 of 2022, there has been ZERO earnings growth in the bottom 493 stocks of the S&P 500.”

It is certainly possible that just seven stocks can keep the markets going. However, it seems logical that a slowdown of economic activity could undermine even those mighty “earnings juggernauts” in the quarters ahead.
We must pay close attention to consumer data. It will likely provide the warnings necessary to reduce equity risk in portfolios.
How We Are Trading It
As noted last week, we maintain our bias towards equity risk, with the markets hitting all-time highs. One important note is that all-time highs tend to beget further highs as momentum and rising optimism fuel asset prices.
However, with markets overbought, look for short-term corrections and consolidations to add equity exposure as needed. Indeed, many risks lie ahead, and we watch the consumer very closely. As we noted last week, we are reducing consumer discretionary stocks specifically for this reason. The consumer drives the economy and, ultimately, earnings. As shown in this week’s commentary, consumer weakness seems to be growing. As noted in Thursday’s Daily Market Commentary:
“One repeated theme in the current earnings round is that personal consumption is slowing down. Last month, McDonald’s, Starbucks, and many other retail-oriented stocks fell on weak sales. This week, we are reminded again of poor sales from Target, Lowes, and Macy’s. All three reported a decline in sales compared to last year. Target’s sales beat estimates slightly, while its earnings per share fell short. While that may not seem too bad, expectations for Target’s sales were already extremely meager. Higher interest rates, economic uncertainty, high credit card balances, and other factors have [consumers] concerned, and consumer confidence took a meaningful dip in April.”
We have rebalanced our portfolios and are well-positioned for the current market environment. However, we will continue managing exposure and risk as needed.
(You can track those portfolios in real time by subscribing to the newly redesigned SimpleVisor platform.)
Have a great week.
Research Report

Subscribe To “Before The Bell” For Daily Trading Updates
We have set up a separate channel JUST for our short daily market updates. Please subscribe to THIS CHANNEL to receive daily notifications before the market opens.
Click Here And Then Click The SUBSCRIBE Button
Subscribe To Our YouTube Channel To Get Notified Of All Our Videos
Bull Bear Report Market Statistics & Screens

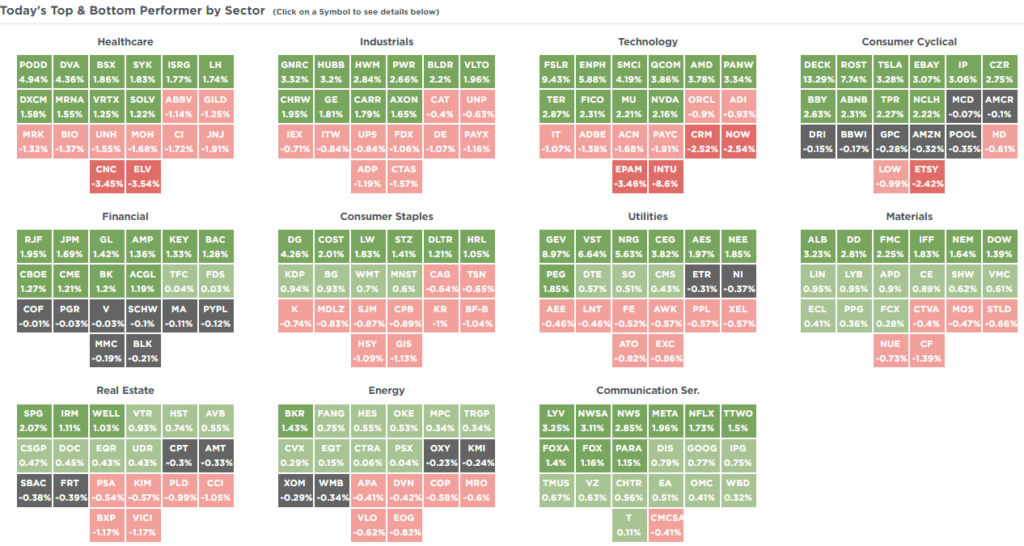
SimpleVisor Top & Bottom Performers By Sector
S&P 500 Weekly Tear Sheet
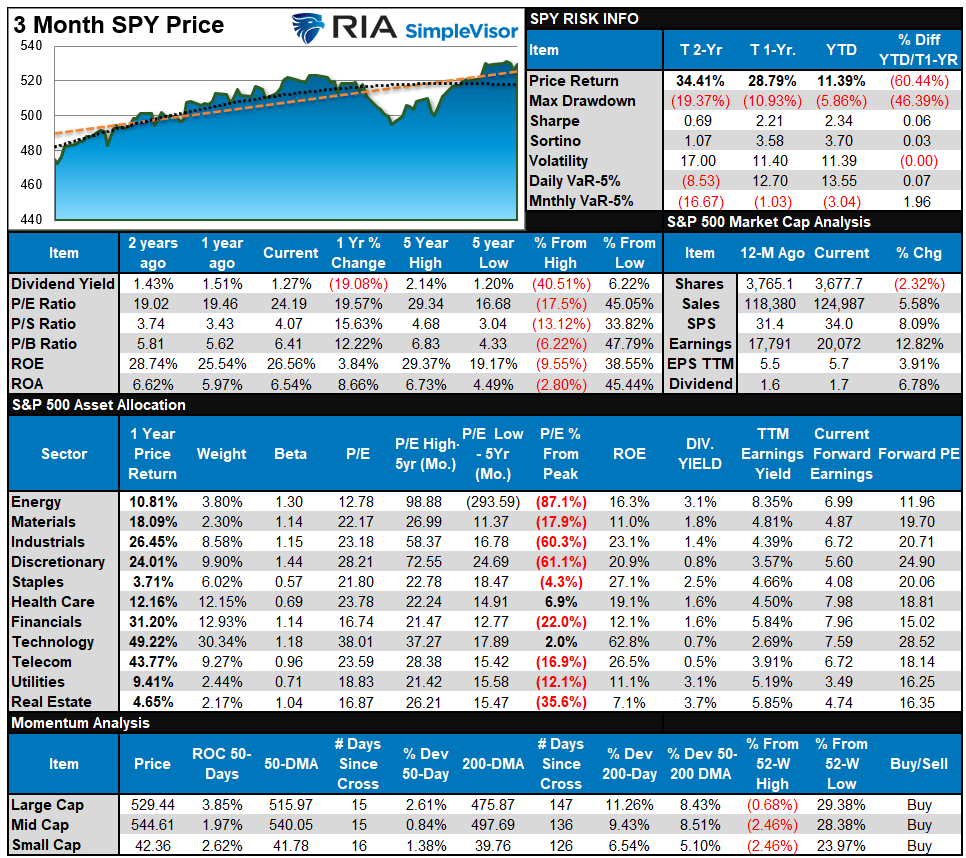
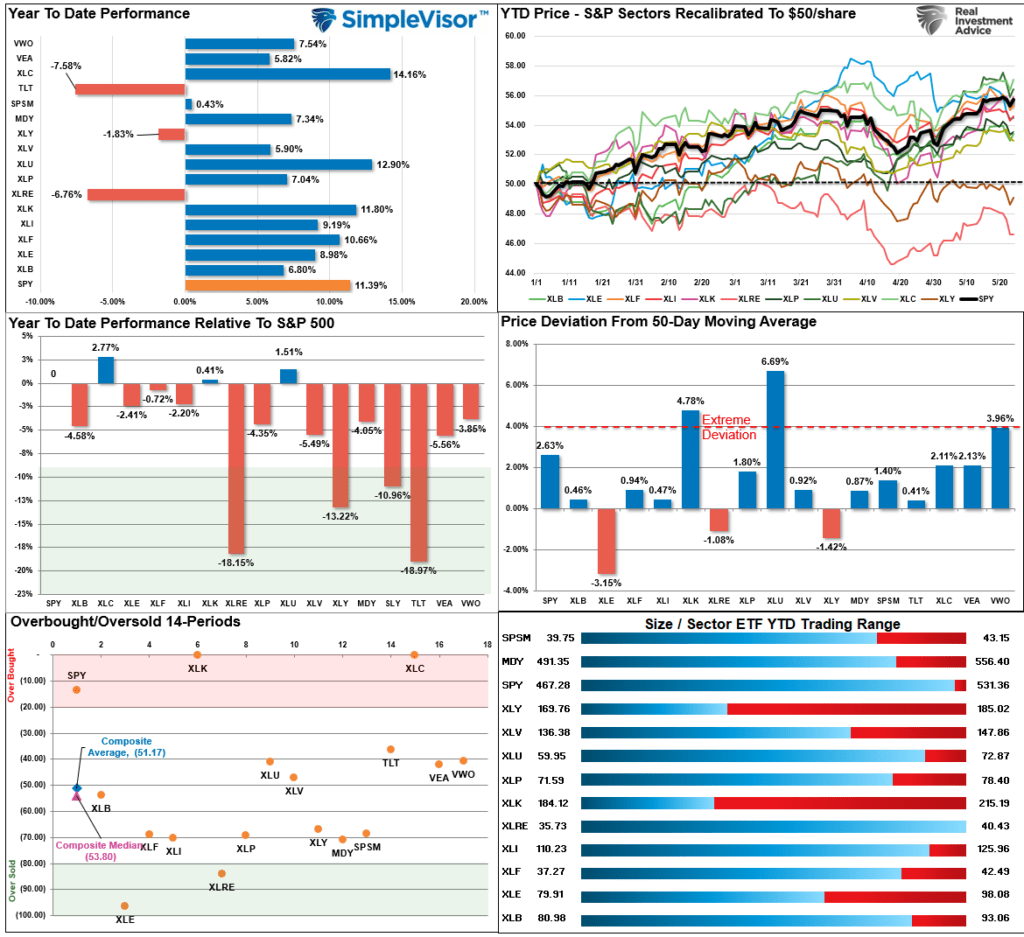
Relative Performance Analysis
Last week, we noted that with most sectors and markets short-term overbought, we could see some selling pressure next week as traders profit from the recent rally. That occurred this past week and reduced the more extreme short-term overbought conditions. With that process not yet complete, the market could remain somewhat range-bound next week as that process continues. The bullish trends remain intact, and portfolios should remain near target equity weightings.
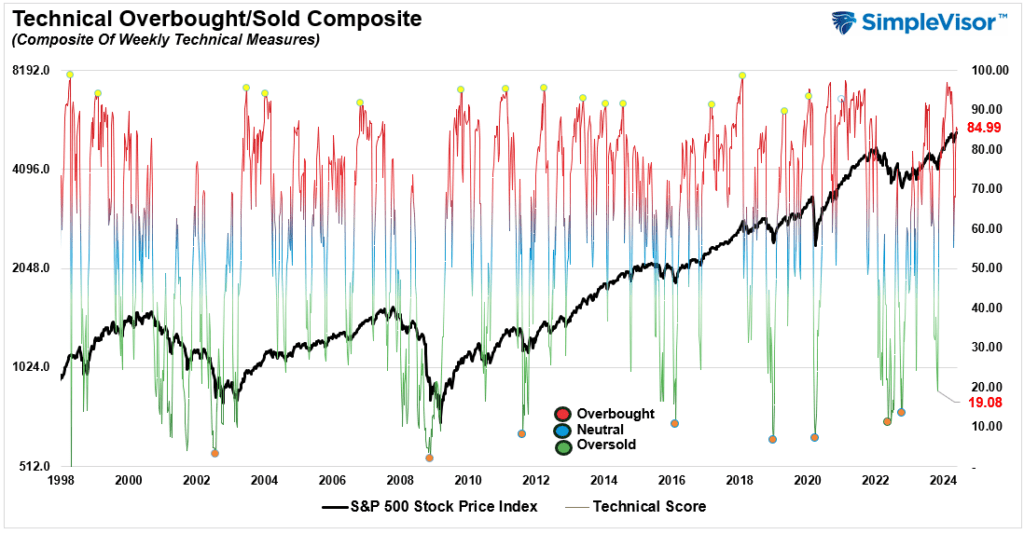
Technical Composite
The technical overbought/sold gauge comprises several price indicators (R.S.I., Williams %R, etc.), measured using “weekly” closing price data. Readings above “80” are considered overbought, and below “20” are oversold. The market peaks when those readings are 80 or above, suggesting prudent profit-taking and risk management. The best buying opportunities exist when those readings are 20 or below.
The current reading is 84.99 out of a possible 100.
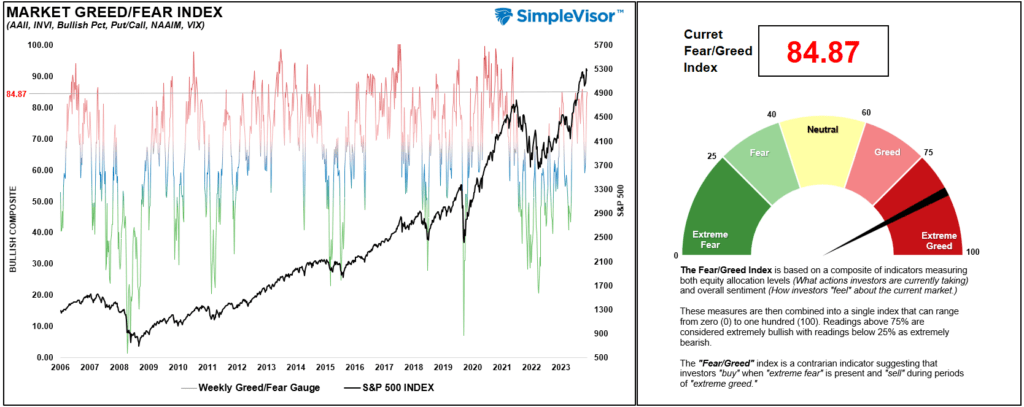
Portfolio Positioning “Fear / Greed” Gauge
The “Fear/Greed” gauge is how individual and professional investors are “positioning” themselves in the market based on their equity exposure. From a contrarian position, the higher the allocation to equities, the more likely the market is closer to a correction than not. The gauge uses weekly closing data.
NOTE: The Fear/Greed Index measures risk from 0 to 100. It is a rarity that it reaches levels above 90. The current reading is 84.87 out of a possible 100.
Relative Sector Analysis
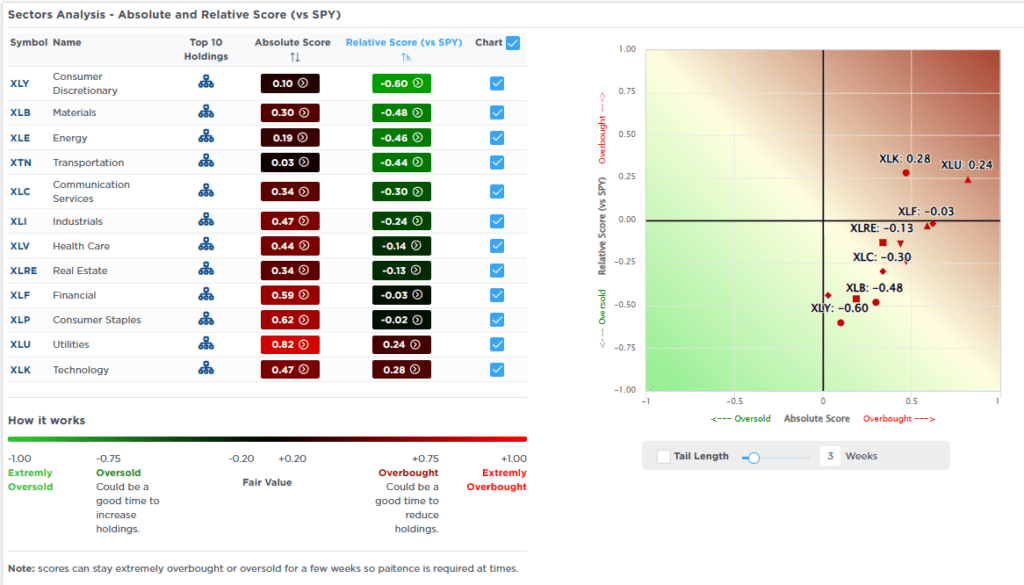
Most Oversold Sector Analysis
Sector Model Analysis & Risk Ranges
How To Read This Table
- The table compares the relative performance of each sector and market to the S&P 500 index.
- “MA XVER” (Moving Average Crossover) is determined by the short-term weekly moving average crossing positively or negatively with the long-term weekly moving average.
- The risk range is a function of the month-end closing price and the “beta” of the sector or market. (Ranges reset on the 1st of each month)
- The table shows the price deviation above and below the weekly moving averages.
As noted last week:
“It is important to note that Gold and Gold Miners are extremely deviated from long-term means, which will lead to a deep reversal at some point. Double-digit deviations in other markets and sectors also suggest more extreme overbought conditions. Given that deviations from means will precede a reversion, investors should engage in regular profit-taking and rebalancing as needed to control risk.”
This past week, the sharp reversal in gold and gold miners reduced some of that more extreme deviation. Notably, both sectors triggered short-term sell signals, suggesting a further correction is possible. As we head into the end of the month, the more extreme overbought readings in many markets and sectors will likely cap any rally attempt into the month’s end.

Weekly SimpleVisor Stock Screens
We provide three stock screens each week from SimpleVisor.
This week, we are searching for the Top 20:
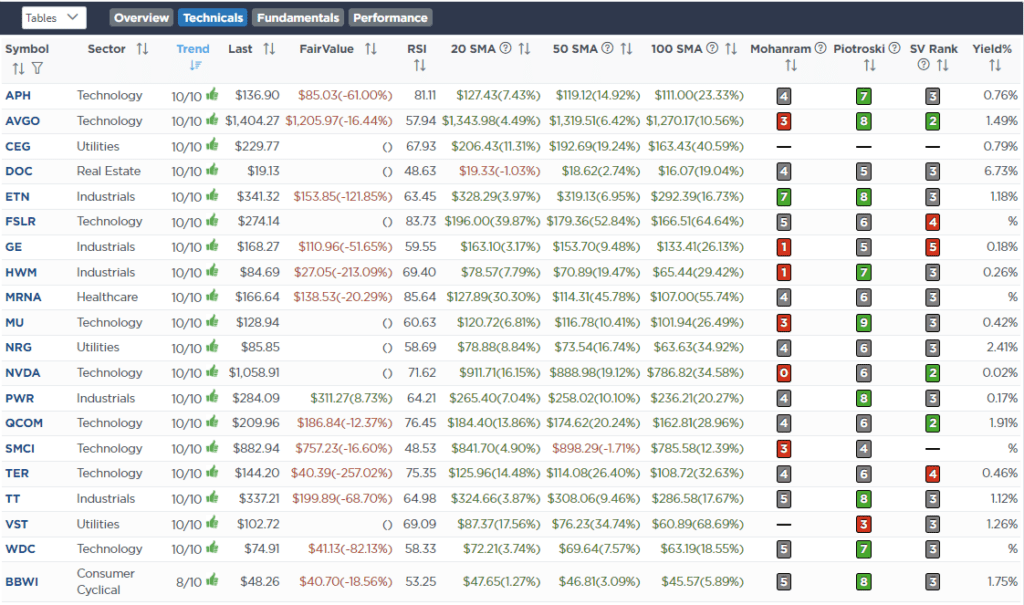
- Relative Strength Stocks
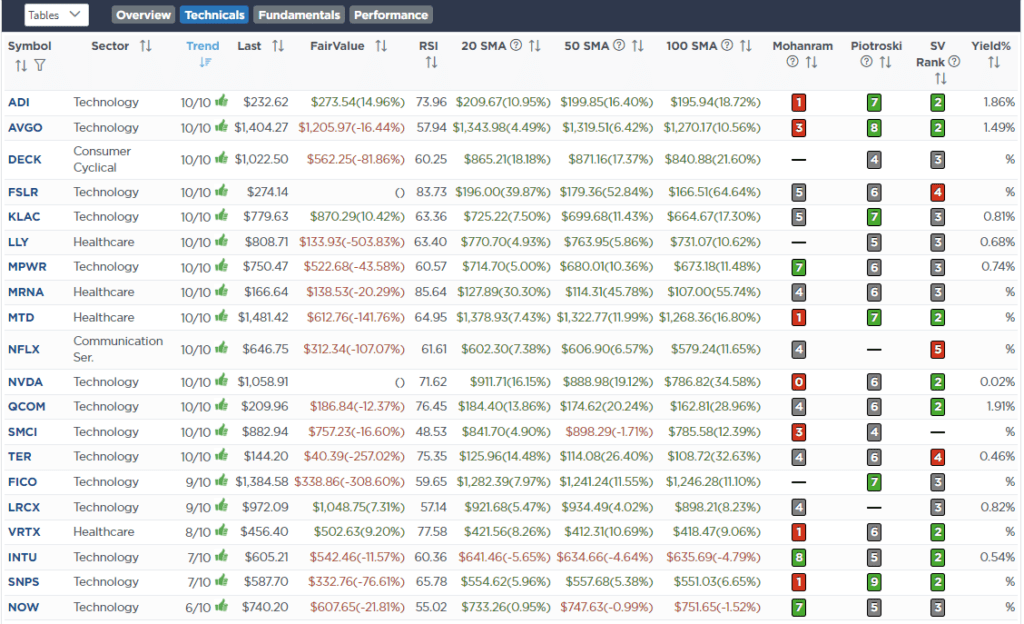
- Momentum Stocks
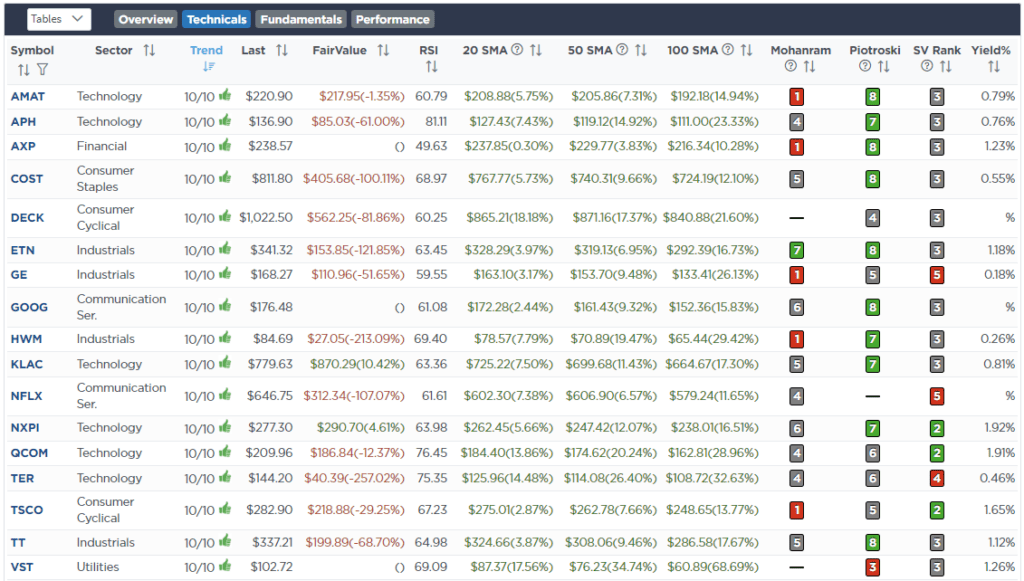
- Fundamental & Technical Strength W/ Dividends
(Click Images To Enlarge)
RSI Screen
Momentum Screen
Fundamental & Technical Screen
SimpleVisor Portfolio Changes
We post all of our portfolio changes as they occur at SimpleVisor:
May 21st
“This morning, we are selling down Nvidia (NVDA) ahead of earnings tomorrow night. As we saw with Palo Alto Networks (PANW), good earnings, revenue, and in-line guidance weren’t enough to satisfy Wall Street. In other words, if Nvidia crushes earnings and estimates but fails to guide higher for the next quarter, that disappointment could send prices lower.
Therefore, we are rebalancing the position back to model weight after a decent run in NVDA over the last few days. Notably, we have been managing this position in recent months. We added to it in October, rebalanced it to model weight in February, and added back to it in April. As is always the case, while we like the position long-term, we continue to manage portfolio risk by managing position risk.”
Equity Model
- Rebalance Nvidia (NVDA) back to its 2% portfolio weight

Lance Roberts, C.I.O.
Have a great week!

