
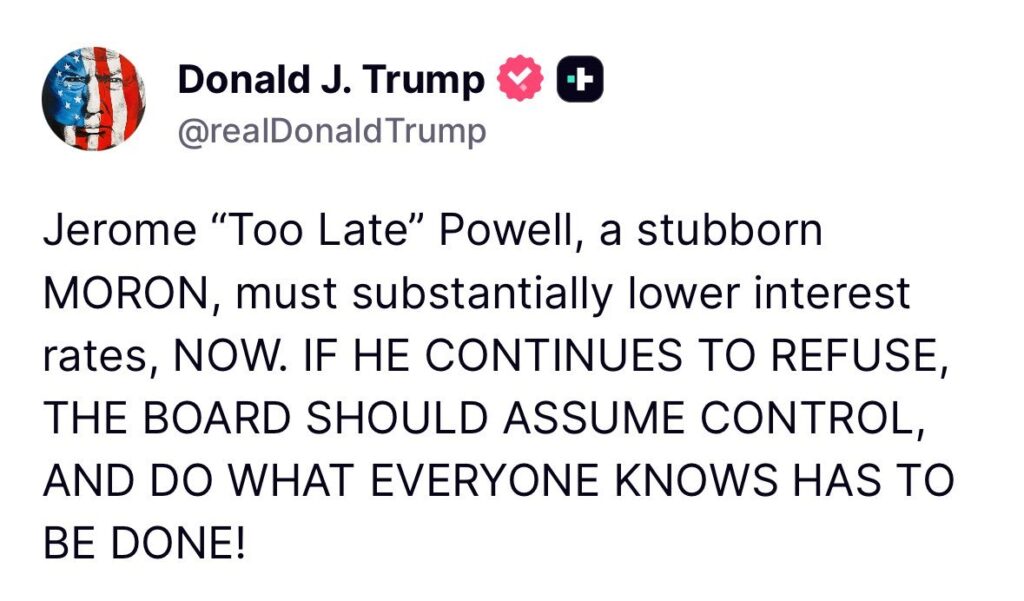
President Trump has been incessantly pressuring Jerome Powell to cut rates ever since he took office. To wit, check out Trump’s latest post on Truth Social below. The Fed cut rates in late 2024 but stopped when Trump took office. Some claim the pause is political. Conversely, the Fed primarily supports its case with fears that tariffs could generate inflation. Given their grave error in stoking inflation in 2020 and 2021, they don’t want to make the same mistake again.
To better appreciate the situation, we compare the current environment to that when the Fed last cut rates in December 2024. We focus on the three goals as mandated to the Fed by Congress.
- Maximum employment: Based on 3-month averages, payroll growth is 35k today versus 209k last December. Personal income was growing at a 5.9% annual rate last December versus 2.7% now. JOLT’s job openings have slipped from 7,718 last December to 7,514.
- Stable prices: Last December, the 3-month CPI rate was 2.87% and trending higher. Today, the last 3-month average CPI rate is 1.70%. The latest annualized monthly reading is about 1.2% below last December’s rate. The Cleveland Fed 1-year expected inflation is slightly higher today at 2.80% versus 2.65% last December.
- Moderate long-term rates: Real rates (yields less inflation) have oscillated between 1.5% and 2.0% for the last few years. Before COVID, they were between 0% and 1%. Economic growth in the first half is averaging 1.25% compared to 2.60% in the second half of 2024.
Given that the labor market and economy are truly showing signs of weakening and tariffs are not overly impacting inflation, it seems Trump has a case. That said, it may be a few more months before the Fed appreciates how tariffs impact prices and the economy.
What To Watch Today
Earnings

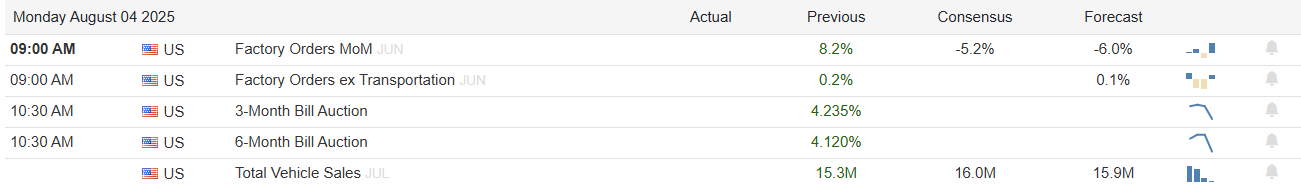
Economy
Market Trading Update
After a long period of “complacency” in the market, volatility finally returned on Friday, dropping more than 1%. As we noted Friday morning, before the market opened:
“While stretches have previously been longer, a consideration of such an event is that low volatility tends to beget high volatility. These “buying stampedes” typically last on average about 15 trading days, so at 25 and counting, we are certainly pushing a more extended duration.”

The market’s technical backdrop has shifted notably over the past week as the S&P 500 pulled back sharply from record highs, breaking below its short-term uptrend channel at the 20-DMA. While longer-term moving averages (50- and 200-day) remain positively sloped, the near-term price action reflects growing technical deterioration. The index failed to hold the 6,300 support zone, raising the risk of a deeper correction toward the 50-day moving average near 6,150.
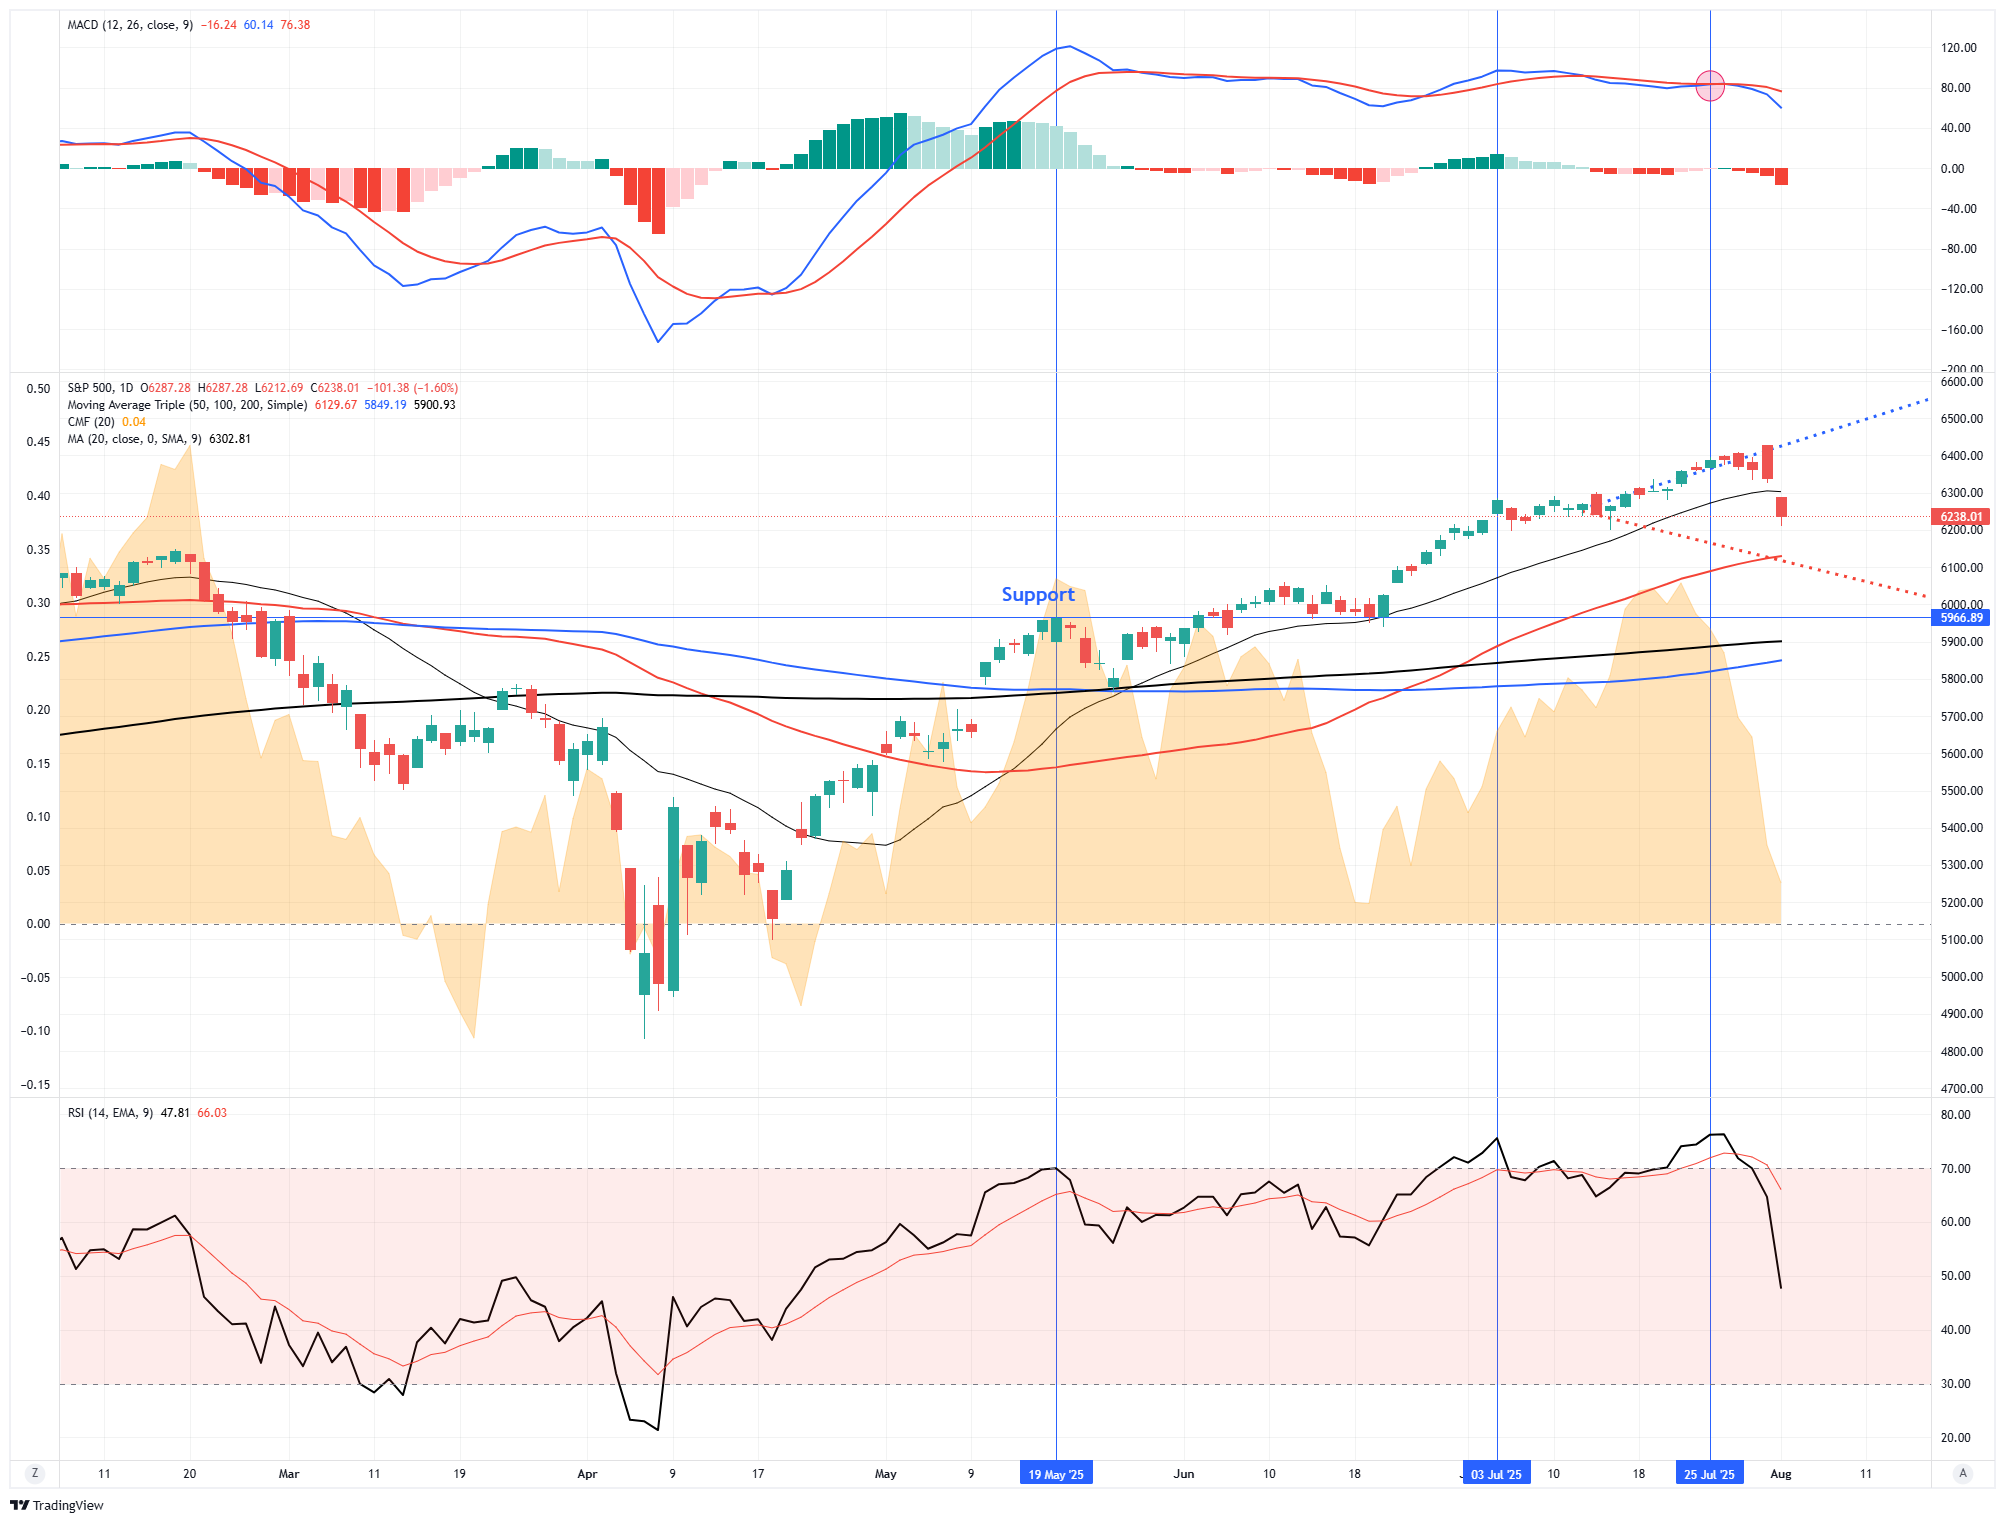
Momentum indicators are flashing caution. The Relative Strength Index (RSI) has rolled over from overbought levels and is now testing neutral territory (~50 level). MACD has produced a bearish crossover, confirming the loss of upside momentum. Additionally, market breadth has weakened; only ~58% of S&P 500 constituents remain above their 50-day moving averages, down from over 70% two weeks ago. Furthermore, money flows are deteriorating sharply as buyer pressure fades. Also, the heavy selling in small-cap stocks and the sharp rise in volatility (VIX spiking above 17) further signal risk aversion under the surface.
That said, the primary uptrend remains intact, with the market still well above its 200-day moving average, which currently sits near 5,900. Large-cap technology continues to provide index-level support, with earnings momentum in AI-leveraged names mitigating broader weakness. This remains a consolidation within an ongoing uptrend until the S&P 500 breaks below its 50-day.
Outlook: Neutral-to-Bearish. The market appears vulnerable to additional downside pressure soon, especially if upcoming economic data (like ISM Services and productivity reports) disappoint. However, unless selling accelerates through key support at the 50-day moving average, this pullback could ultimately serve as a reset for an overbought market. Investors should remain cautious, tighten stops, and look for stabilization signals before re-engaging aggressively on the long side.

Employment And The Week Ahead
The BLS employment report was weaker than expected at +73k. However, more importantly, June’s data was revised sharply lower from 147k to 14k and May’s from 144k to 19k. Judging by the recent months, the pattern is clear: the U.S. labor market is slowing considerably, and there is enough data to conclude this isn’t a statistical or seasonal fluke. The graph below shows that with the revisions, the BLS has caught down to the ADP data, as we suspected would happen.
After the deluge of data last week, traders get a break. Most of the largest companies have reported earnings, albeit Nvidia’s earnings will not be reported until the end of the month. Economic data this week will be sparse. ISM services will headline the data. ISM Manufacturing last Friday slipped further into recessionary territory, as it has been for the better part of the previous three years. The good news is that ISM prices slipped as tariff-based inflation fears receded.
Most telling this week will be Fed speakers. We will get to hear their latest thoughts on the employment data and the growing odds of a rate cut in September.

Debasement: What It Is And Isn’t
One of the favorite charts used to make the “debasement” case is the classic graph showing that the U.S. dollar has lost 90% of its purchasing power since 1966.
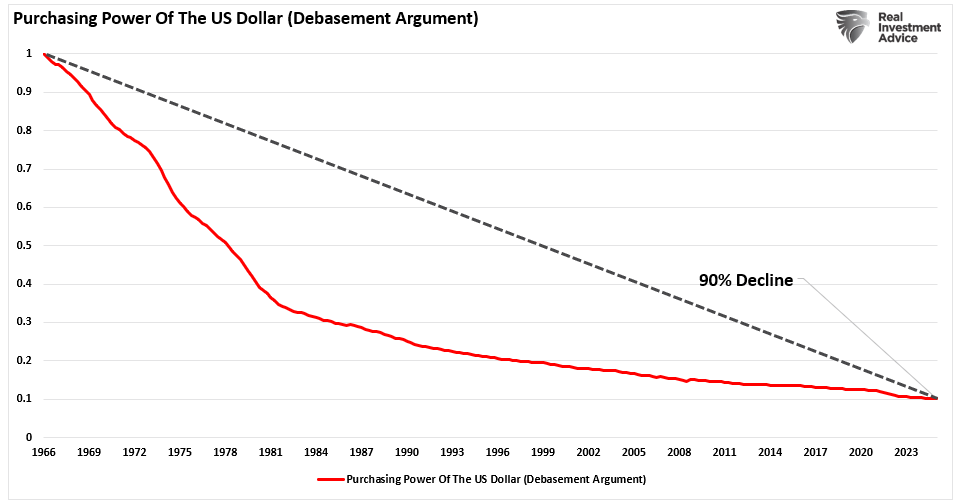
It’s striking, and those selling gold, silver, or other doomsday assets often use it. But here’s the thing: that chart doesn’t show debasement. It only reflects inflation, a well-understood and largely expected outcome in a growing economy.
Prices rise over time because demand increases due to population growth, rising incomes, and growing consumption. This is especially true in a post-industrial, service-driven economy that incentivizes credit expansion and capital investment. As we often say, it’s not the dollar losing value; it’s the economy expanding.
Let’s discuss what “debasement” is and is not as it relates to the economy.
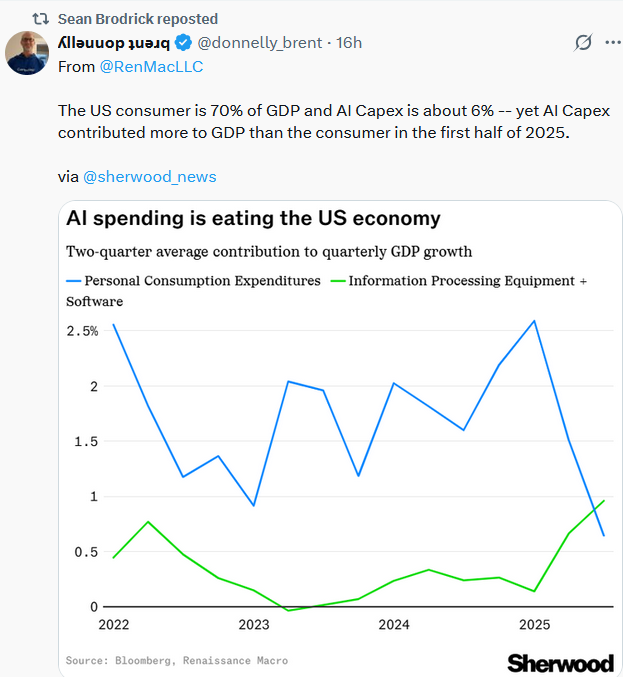
Tweet of the Day
“Want to achieve better long-term success in managing your portfolio? Here are our 15-trading rules for managing market risks.”
Please subscribe to the daily commentary to receive these updates every morning before the opening bell.
If you found this blog useful, please send it to someone else, share it on social media, or contact us to set up a meeting.

