
🔎 At a Glance
- Investor Greed Returns With A Vengeance
- Nasdaq 2025 Tracking 2020
- S&P 500 – Technical Analysis Update
- From Lance’s Desk:
- Portfolio updates & sector strategy shifts
- Market stats, screens, and risk indicators
💬 Ask a Question
Have a question about the markets, your portfolio, or a topic you’d like us to cover in a future newsletter?
📩 Email: lance@riaadvisors.com
🐦 Follow & DM on X: @LanceRoberts
📰 Subscribe on Substack: @LanceRoberts
We read every message and may feature your question in next week’s issue!
📊 Market Brief: Entering H2 2025
Markets kicked off the second half of 2025 with a strong finish to Q2, propelled by easing geopolitical fears, falling oil prices, and a reaffirmation of the Fed’s dovish tone. The S&P 500 rose 3.4% in the final week of June to close at new record highs.
Key Drivers:
- Mega-cap leadership remains dominant, with tech names up nearly 6% on the week, fueled by continued AI optimism and strong momentum.
- Retail speculation returned in full force, as non-profitable tech, meme stocks, and penny names all saw outsized gains—signs of rising risk appetite.
- Institutional flows were modest, driven more by short-covering and tactical positioning than broad conviction buying.
- Breadth remains narrow, with only about 22 stocks in the S&P 500 hitting new all-time highs, underscoring the fragility beneath the surface.
📈 Technical Spotlight: The Golden Cross Emerges
This past week, the S&P 500’s 50-day moving average crossed above the 200-day moving average—a classic Golden Cross formation. While not infallible, this technical signal is generally seen as a bullish long-term indicator. Historically, Golden Crosses tend to precede extended rallies when supported by improving breadth and strong macro momentum.
However, this particular instance presents a mixed picture:
- The cross occurred amid narrow leadership, driven primarily by mega-cap tech, with cyclicals and small caps still underperforming.
- Volume has not confirmed the breakout, with much of the recent move attributed to lower-quality speculative flows.
With that stated, the historical performance of “Golden Crosses” tends to yield positive returns, but that does not necessarily come without volatility in the near term.

🔮 Looking Ahead: Strategy for a Narrow, Overbought Market
While the strong finish to Q2 has given investors reason to celebrate, the underlying structure of the rally calls for caution. Markets are increasingly stretched in the short term, both technically and sentiment-wise, and investor positioning should reflect the potential for increased volatility in July and August.
- Seasonality turns weaker in mid-to-late July, with August and September historically being two of the most volatile months of the year.
- Earnings season begins post–July 4th, and corporate guidance—particularly from cyclicals and retailers—will be critical in determining whether broader market participation emerges.
- Volatility remains unusually low, increasing the probability of sharp, sentiment-driven pullbacks in overbought sectors.
- Breadth remains narrow, with gains concentrated in mega-cap tech. This divergence between index strength, weak money flows, and internal weakness could create fragility if leadership falters.

🧱 Investor Positioning Recommendations:
- Trim gains in extended positions, particularly in high-momentum tech and speculative trades (e.g., AI, leveraged ETFs, meme stocks). Rebalance toward more fundamentally sound holdings.
- Maintain core exposure to broad indexes or quality growth names, but avoid chasing performance in overbought sectors. Instead, look to build or rotate into areas showing early signs of leadership (e.g., industrials, financials, energy).
- Focus on risk-adjusted returns, not absolute upside. With sentiment elevated, adopting a more selective and valuation-aware approach will provide better long-term results.
🛡️ Risk Management Guidelines:
- Raise cash allocations modestly to take advantage of potential pullbacks in late July or August.
- Utilize trailing stop-losses on aggressive trades, particularly in leveraged ETFs or speculative names that have already seen sharp moves.
- Avoid overexposure to crowded trades, especially single-stock themes and high-beta names vulnerable to profit-taking.
- Monitor macro developments, including Fed commentary, PCE inflation data, and geopolitical headlines, as catalysts for sentiment reversal.
With the S&P 500 breaking out to new highs but doing so on narrow participation and stretched technicals, now is the time to focus on disciplined execution, thoughtful asset rotation, and proactive risk control. As we enter the seasonally weaker half of the year, managing downside risk is just as crucial as capturing upside momentum.
Need Help With Your Investing Strategy?
Are you looking for complete financial, insurance, and estate planning? Need a risk-managed portfolio management strategy to grow and protect your savings? Whatever your needs are, we are here to help.

💥Investor Greed Returns With A Vengeance
Retail investor greed again dominates market activity, echoing some of the same speculative behaviors seen during previous risk-on phases. Retail investors show heightened risk appetite across multiple metrics, from options trading to leveraged ETF flows, with little regard for valuation or macroeconomic headwinds.

Put/call ratios are flashing strong bullish sentiment, with the SPY ratio hovering around 0.79, reflecting an imbalance toward calls over puts.
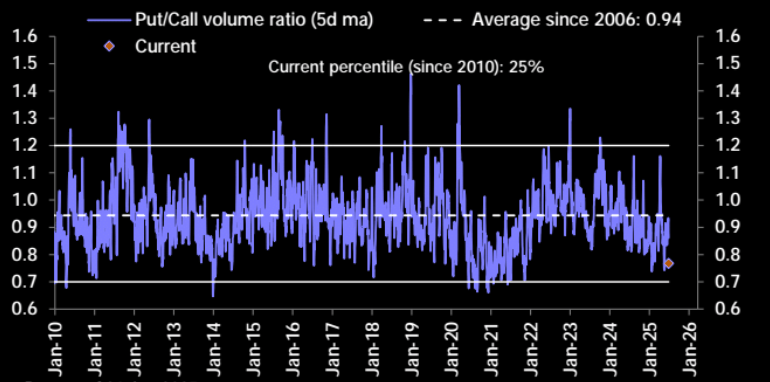
Investor greed primarily drives this skew, particularly in names and sectors associated with high momentum or popular narratives.
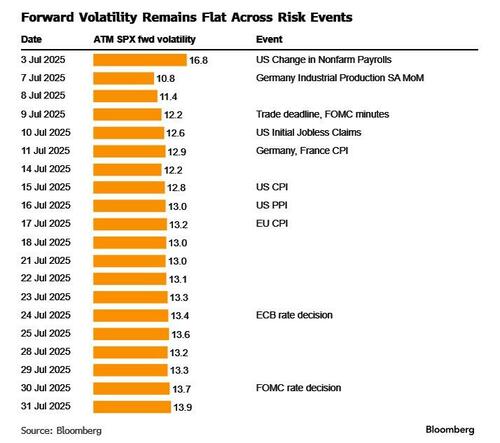
“Despite the looming July 9th trade negotiation deadline, not much is priced into the SPX vol surface for the event, suggesting investors either expect a positive resolution or for the deadline to be extended. Interestingly, the flattening in skew was mostly concentrated in the front-month, suggesting this was mostly positioning-driven FOMO-type call buying. Longer-dated skew remains steep in comparison.” – CBOE
The surge in call option volumes has occurred across semiconductor plays, especially in leveraged vehicles like SOXL, the 3x bullish semiconductor ETF, where open interest in call options far exceeds puts. Similar patterns are emerging in thematic ETFs like RETL (3x retail) and DRN (3x real estate), which are seeing elevated daily volume despite mixed performance. This appetite for leverage is being pushed further with the proliferation of single-stock leveraged ETFs, such as HIMZ, a leveraged play on HIMS, which saw a dramatic 70% collapse after a corporate announcement, highlighting how retail speculation often ignores risk asymmetry.
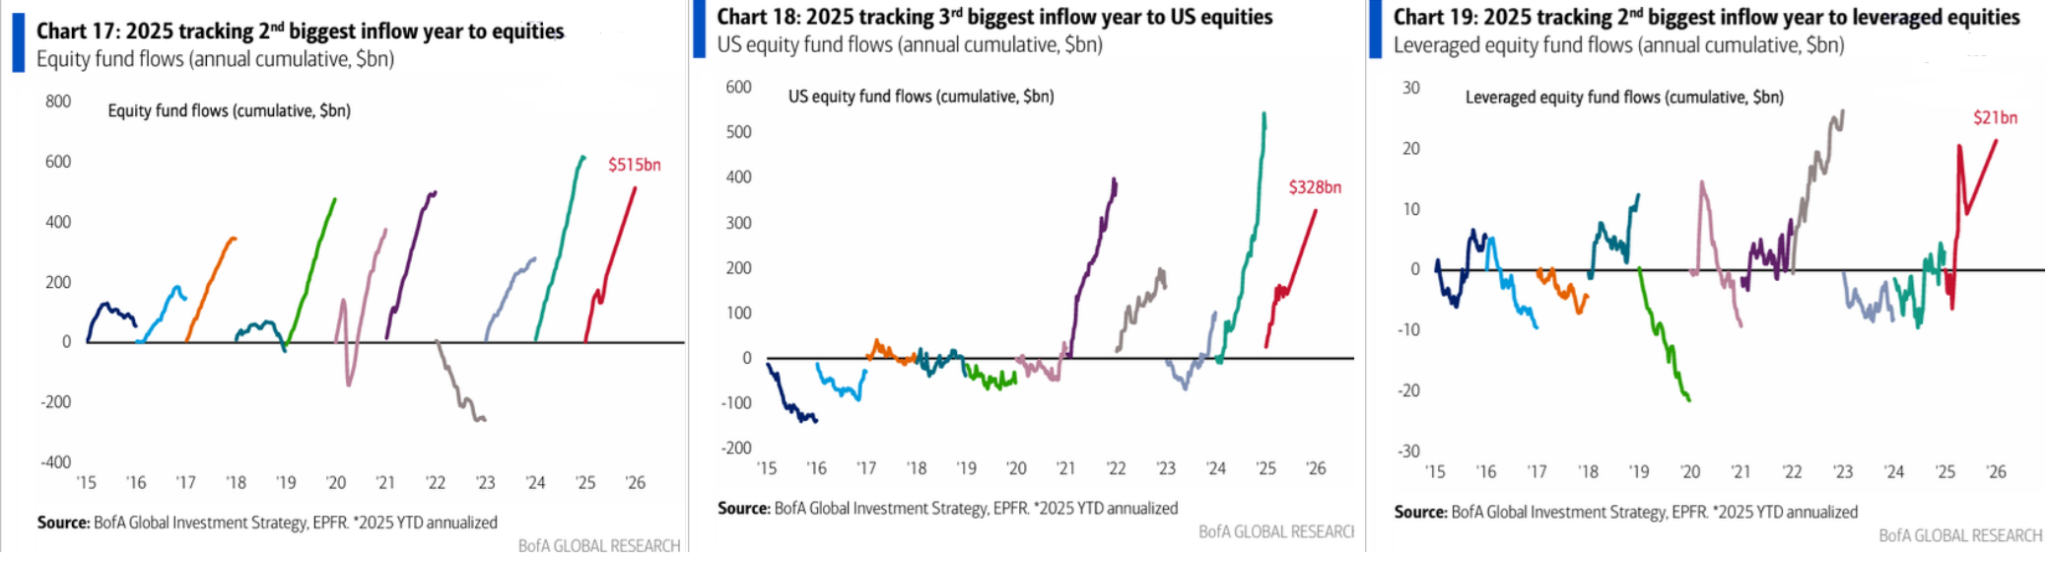
Investor greed is also evident in flows to speculative and penny stocks. Retail inflows into U.S. equities have topped $70 billion year-to-date, with much of that concentrated in highly volatile names like Palantir, MicroStrategy, and other crypto-adjacent or AI-linked plays. Penny stocks and small caps, traditionally the domain of risk-seeking traders, have also seen outsized gains in short bursts, primarily driven by social media chatter and retail momentum chasing. At the same time, investors are doubling down on speculative trades even after short-term losses, reflecting a “buy-the-dip” mindset that prioritizes quick returns over fundamental analysis.
Supporting this activity are broader ETF flow dynamics. Retail-focused providers like Vanguard have seen their share of total U.S. ETF inflows jump to 37%, up from 27% a year earlier. Leveraged equity ETF flows reached a five-year high this past spring and have remained elevated through Q2. Meanwhile, tighter bid-ask spreads and more retail-accessible platforms are enabling higher trade volume with lower friction, further fueling this behavior.
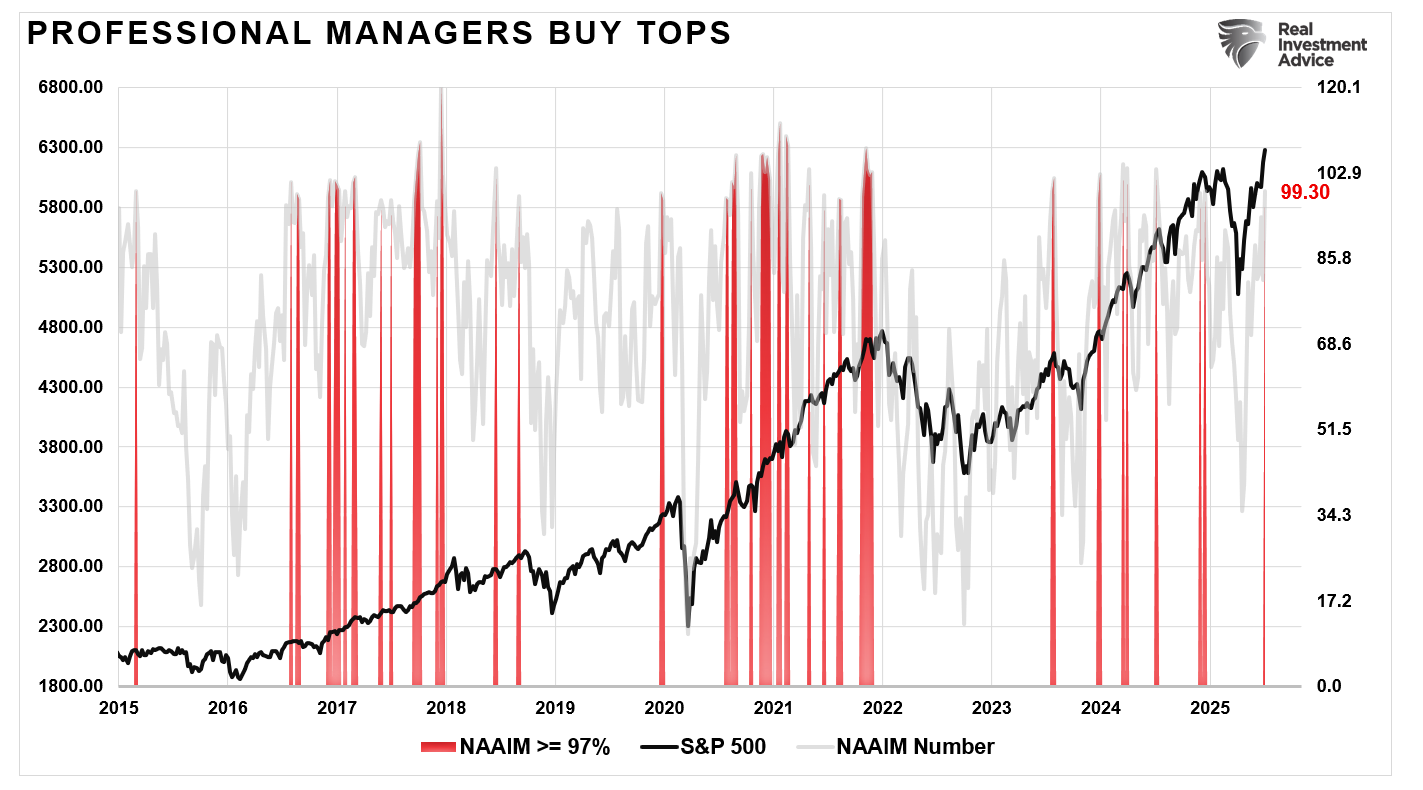
However, it isn’t just retail investor greed driving the market. While a bit late to the party, professional investor sentiment and positioning have surged higher, helping the recent push of the markets to all-time highs.
While retail and professional exuberance fueled the market’s rise, it also introduces fragility. Leveraged ETFs suffer from compounding decay in volatile markets, and speculative trades can unwind violently, as HIMZ demonstrated. While momentum can extend rallies, the resulting reversals are often sharp when sentiment turns.
Optimism is working in the Bulls’ favor, but the warning signs of overreach are mounting. It won’t take much for a decent price correction, which could begin as soon as next week.
Trade accordingly.
📈 Nasdaq 2025 Tracking 2020
I have noted many times previously that I hate market analogs. The reason is that they require “cherry-picking” starting and ending points to make the correlation. However, there are times when analogs can help display similarities between market performance periods and investor greed or fear. The following chart of the Nasdaq in 2020 and 2025 is a good example of the latter. As shown, the onset of the pandemic led to a 35% decline in March of that year. The market then bottomed and began a sharp rally into the end of 2020, and further in 2021. As shown, in 2025, the Nasdaq is tracing out a similar pattern with the decline in March and early April, and the subsequent rebound through the end of June.

This is undoubtedly an encouraging analogy for the bulls, suggesting that the market has plenty of runway left for the rest of 2025. However, this is why I personally dislike analogs like this because it assumes that just because something occurred in the past, it will repeat identically in the future. The problem is that the analysis lacks the data that supported the previous rally.
The table below details some of the differences between 2020 and today. It is also critical to remember that during 2020, sporting events from football to horse racing were shuttered, leaving only the stock market as a viable outlet for gamblers to place bets. Armed with a Robinhood account, a $1500 stimulus check, and a “bad attitude”, investors flocked into the financial markets chasing some of the speculative corners of the market. Of course, with the Federal Reserve cutting rates to ZERO, injecting a $120 billion a month into the financial system, and ensuring the junk bond market functioned, it is unsurprising that markets quickly recovered from their lows.

The fascinating thing about 2025 is that the market “feels” much like it did in 2020, but the backdrop is entirely opposite. The Fed is maintaining elevated interest rates, reducing its balance sheet, and fiscal support for the country continues to reverse. Yet, even with monetary and fiscal policy absent, the market is rallying with seemingly the same reckless abandon.
Will the 2025 analog continue to mirror 2020? Maybe. But with valuations elevated and the economy slowing, I would bet that the analog breaks sooner than later.
Be careful taking analogs at face value.
📒 Portfolio Tactics
As noted last week, we are still maintaining a decent slug of cash as the current risk/reward dynamics are skewed towards “risk.” While such may lead to a temporary lag against our benchmark, we are okay waiting for a pullback in August or September. July tends to have positive returns with lower volatility. In fact, over the last decade every July period has posted positive returns.
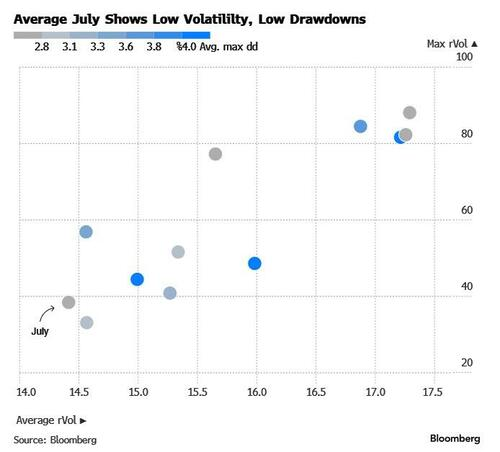
However, even if July does provide a low volatility return to investors, there is still substantial headline risk heading into the fall. Beyond the tariff deadline on July 9th, some caution could be warranted if labor market data deteriorates faster than anticipated, even if that speeds up the central bank’s intervention. Aggressive rate cuts are rarely taken well by stock markets.
Continue to manage risk accordingly, but with markets approaching more overbought level, investors should consider rebalancing risks accordingly. While July tends to have positive returns, such an outcome is not guaranteed.
🖊️ From Lance’s Desk
This week’s #MacroView blog explains the Federal Reserve’s recent, understated tweak to the Supplementary Leverage Ratio (SLR), which has unlocked meaningful bank balance sheet capacity, boosting Treasury demand, improving liquidity, and potentially marking a turning point in the bond bear market by pulling yields lower.

Also Posted This Week:
📹 Watch & Listen
In this video, Lance Roberts explains how the recent spike and equally sharp slide in oil prices, now hovering around the 50‑day moving average near $60, signal cooling economic demand despite a strong market rally and why that trend could shape investor sentiment through summer.
Subscribe To Our YouTube Channel To Get Notified Of All Our Videos
📊 Market Statistics & Analysis
Weekly technical overview across key sectors, risk indicators, and market internals

💸 Market & Sector X-Ray: Extreme Overbought
The market advanced this week, crossing above 6200 and pushing the majority of sectors and markets into extreme overbought territory. As noted in this week’s missive, the more speculative frenzy has returned to the market, and the risk of a consolidation or correction is building. Take profits in very overbought sectors and rebalance portfolio risks as needed.

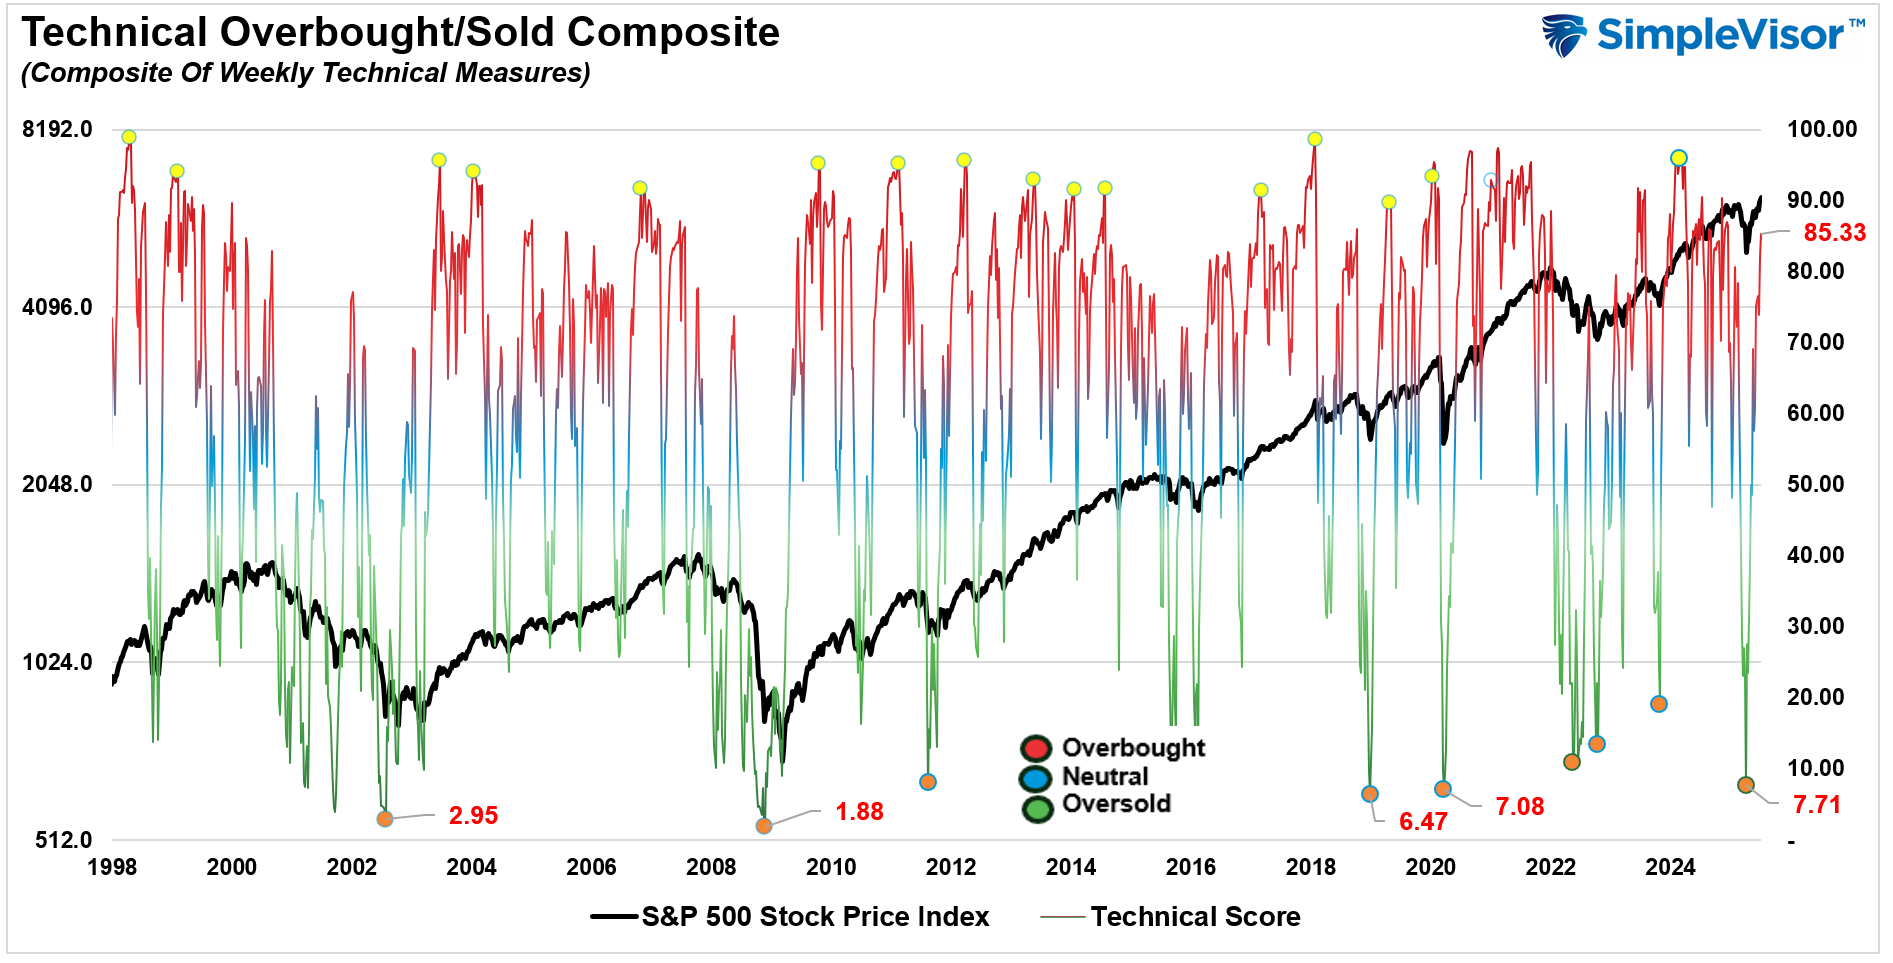
📐 Technical Composite: 85.33 – Very Overbought, Risk Rising
Markets are pushing into more overbought territory, and pullbacks to support are likely.
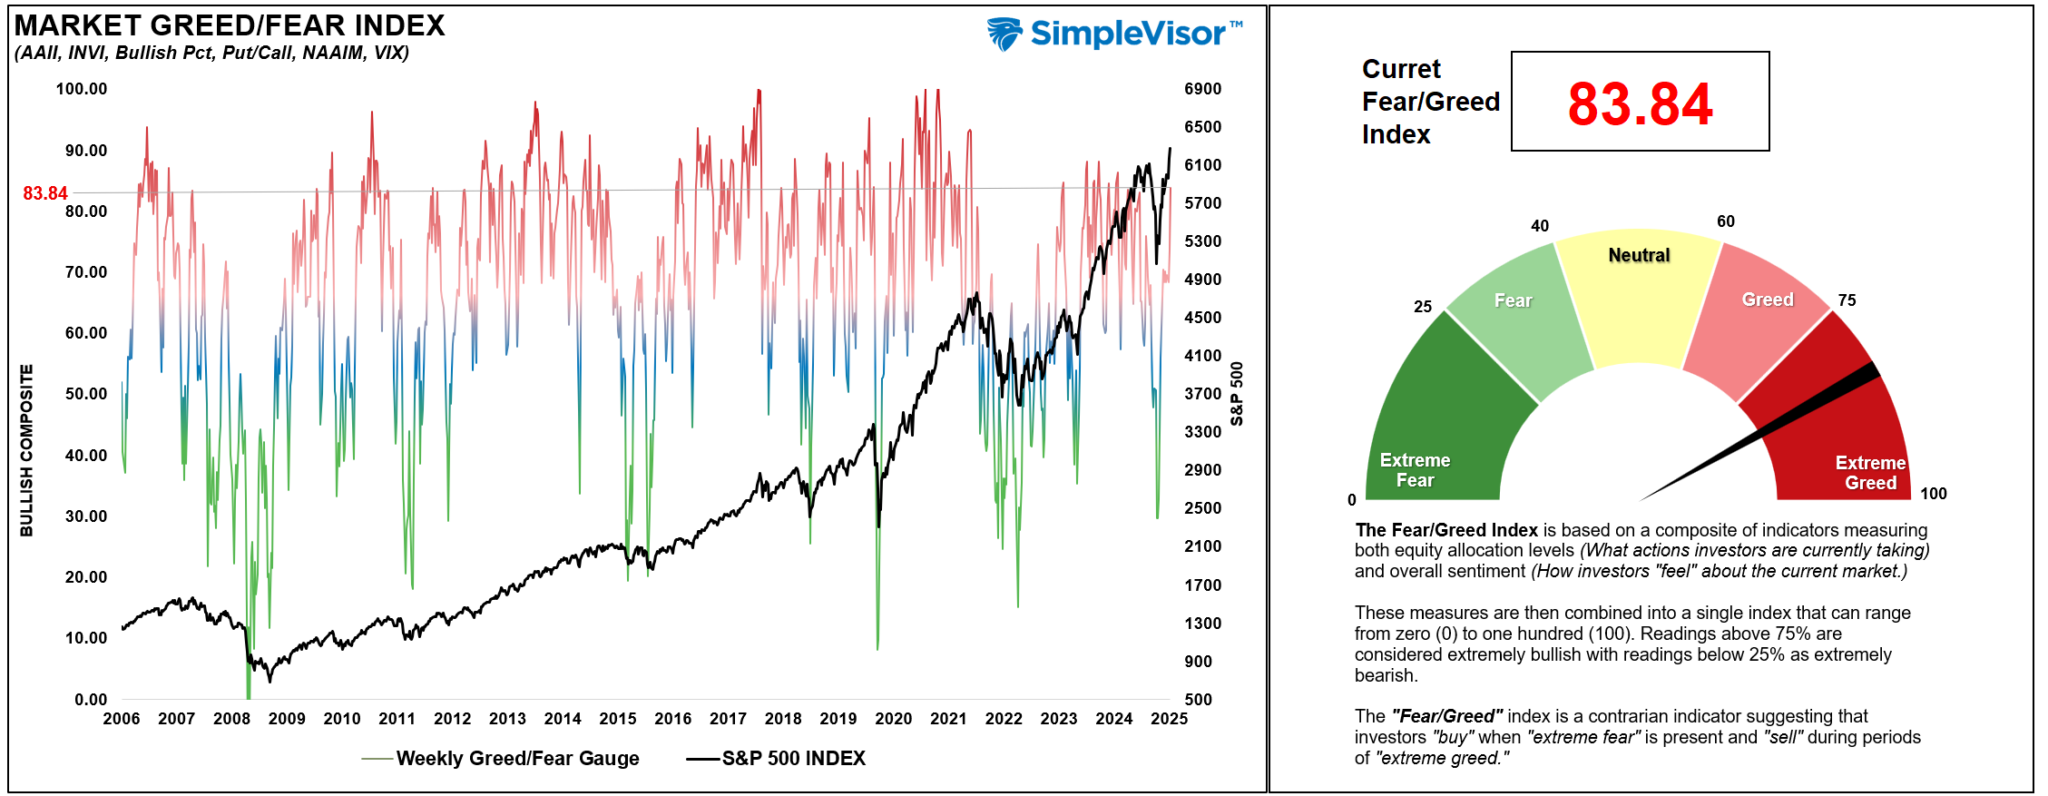
🤑 Fear/Greed Index: 83.34 – Extreme Greed, Risk Warning
Investor psychology and risk appetite surged this past week into extreme greed territory. Current readings are at levels that suggest risk management is more important than chasing further gains.
🔁 Relative Sector Performance
Real Estate, Staples, and Healthcare underperformed the most this week as investors chased Technology, Materials, Transportation, and Communications. With the leaders in more extreme overbought territory, a rotation to Staples and Healthcare is likely.

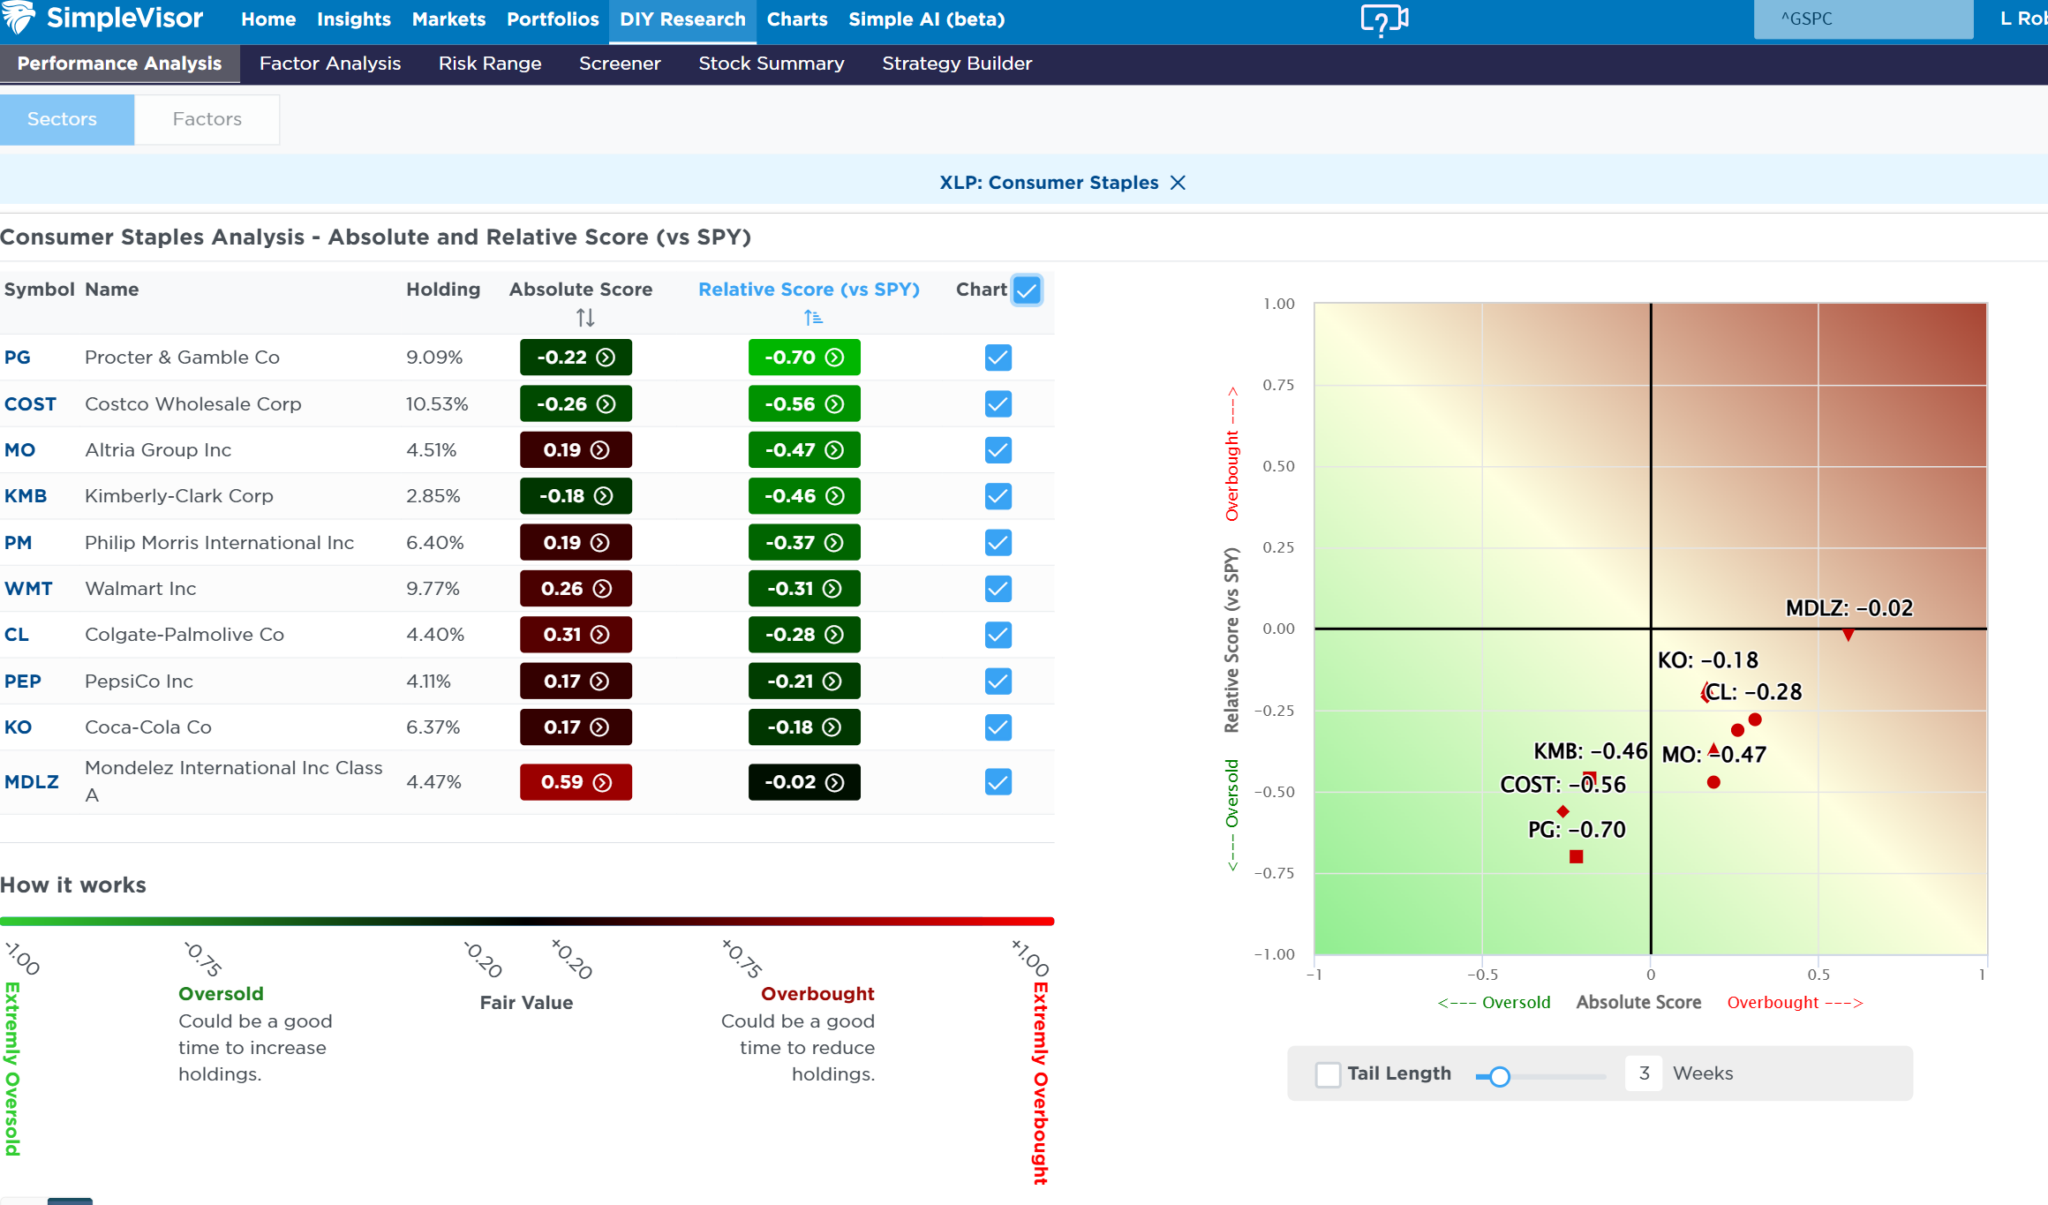
🧊 Most Oversold Sectors
As noted, Healthcare and Staples are two of the market’s more oversold sectors, which could catch inflows from a risk-off rotation. COST, PG, and MO are currently the most oversold in the Staples sector.
📊 Sector Model & Risk Ranges
The Risk Range Report resets on the first of each month, but Transports and Materials are already above monthly norms. Furthermore, the S&P index and Technology, Communications, and Discretionary, are trading well above long-term moving averages. Take profits and rebalance risk as a correction or consolidation period is approaching.

Have a great week.
Lance Roberts, CIO, RIA Advisors

