Inside This Week’s Bull Bear Report
- Oil Price Rise, Not Tariffs, Will Cause CPI To Tick Up
- How We Are Trading It
- Research Report – The Dollar’s Death Is Greatly Exaggerated
- YouTube – Before The Bell
- Market Statistics
- Stock Screens
- Portfolio Trades This Week
Back To Extreme Optimism
Last week, we discussed that the bull rally continues despite all of the negative narratives lately, from tariffs to the deficit to the potential onset of WWIII.
“The market’s bullish trend continued this week, and it is rapidly approaching all-time highs. However, an Israeli strike on Iran early Friday morning sent stocks tumbling at the open, but as of midday, as I am writing this report, most of the initial decline has fully recovered. We noted that a correction or consolidation process is needed to work off some short-term overbought conditions. But, as seen on Friday, any pullback is quickly bought by investors chasing the market in the near term.”
The market continued to trade in a back-and-forth pattern this week as it consolidated recent gains. Negative news headlines from the ongoing Iran-Israel conflict continue to push and pull traders daily. Notably, the market held support at the 20-DMA, keeping the bullish trend intact. However, the market did break below the “rising wedge” pattern, increasing the potential for a further consolidation to work off the current overbought conditions.
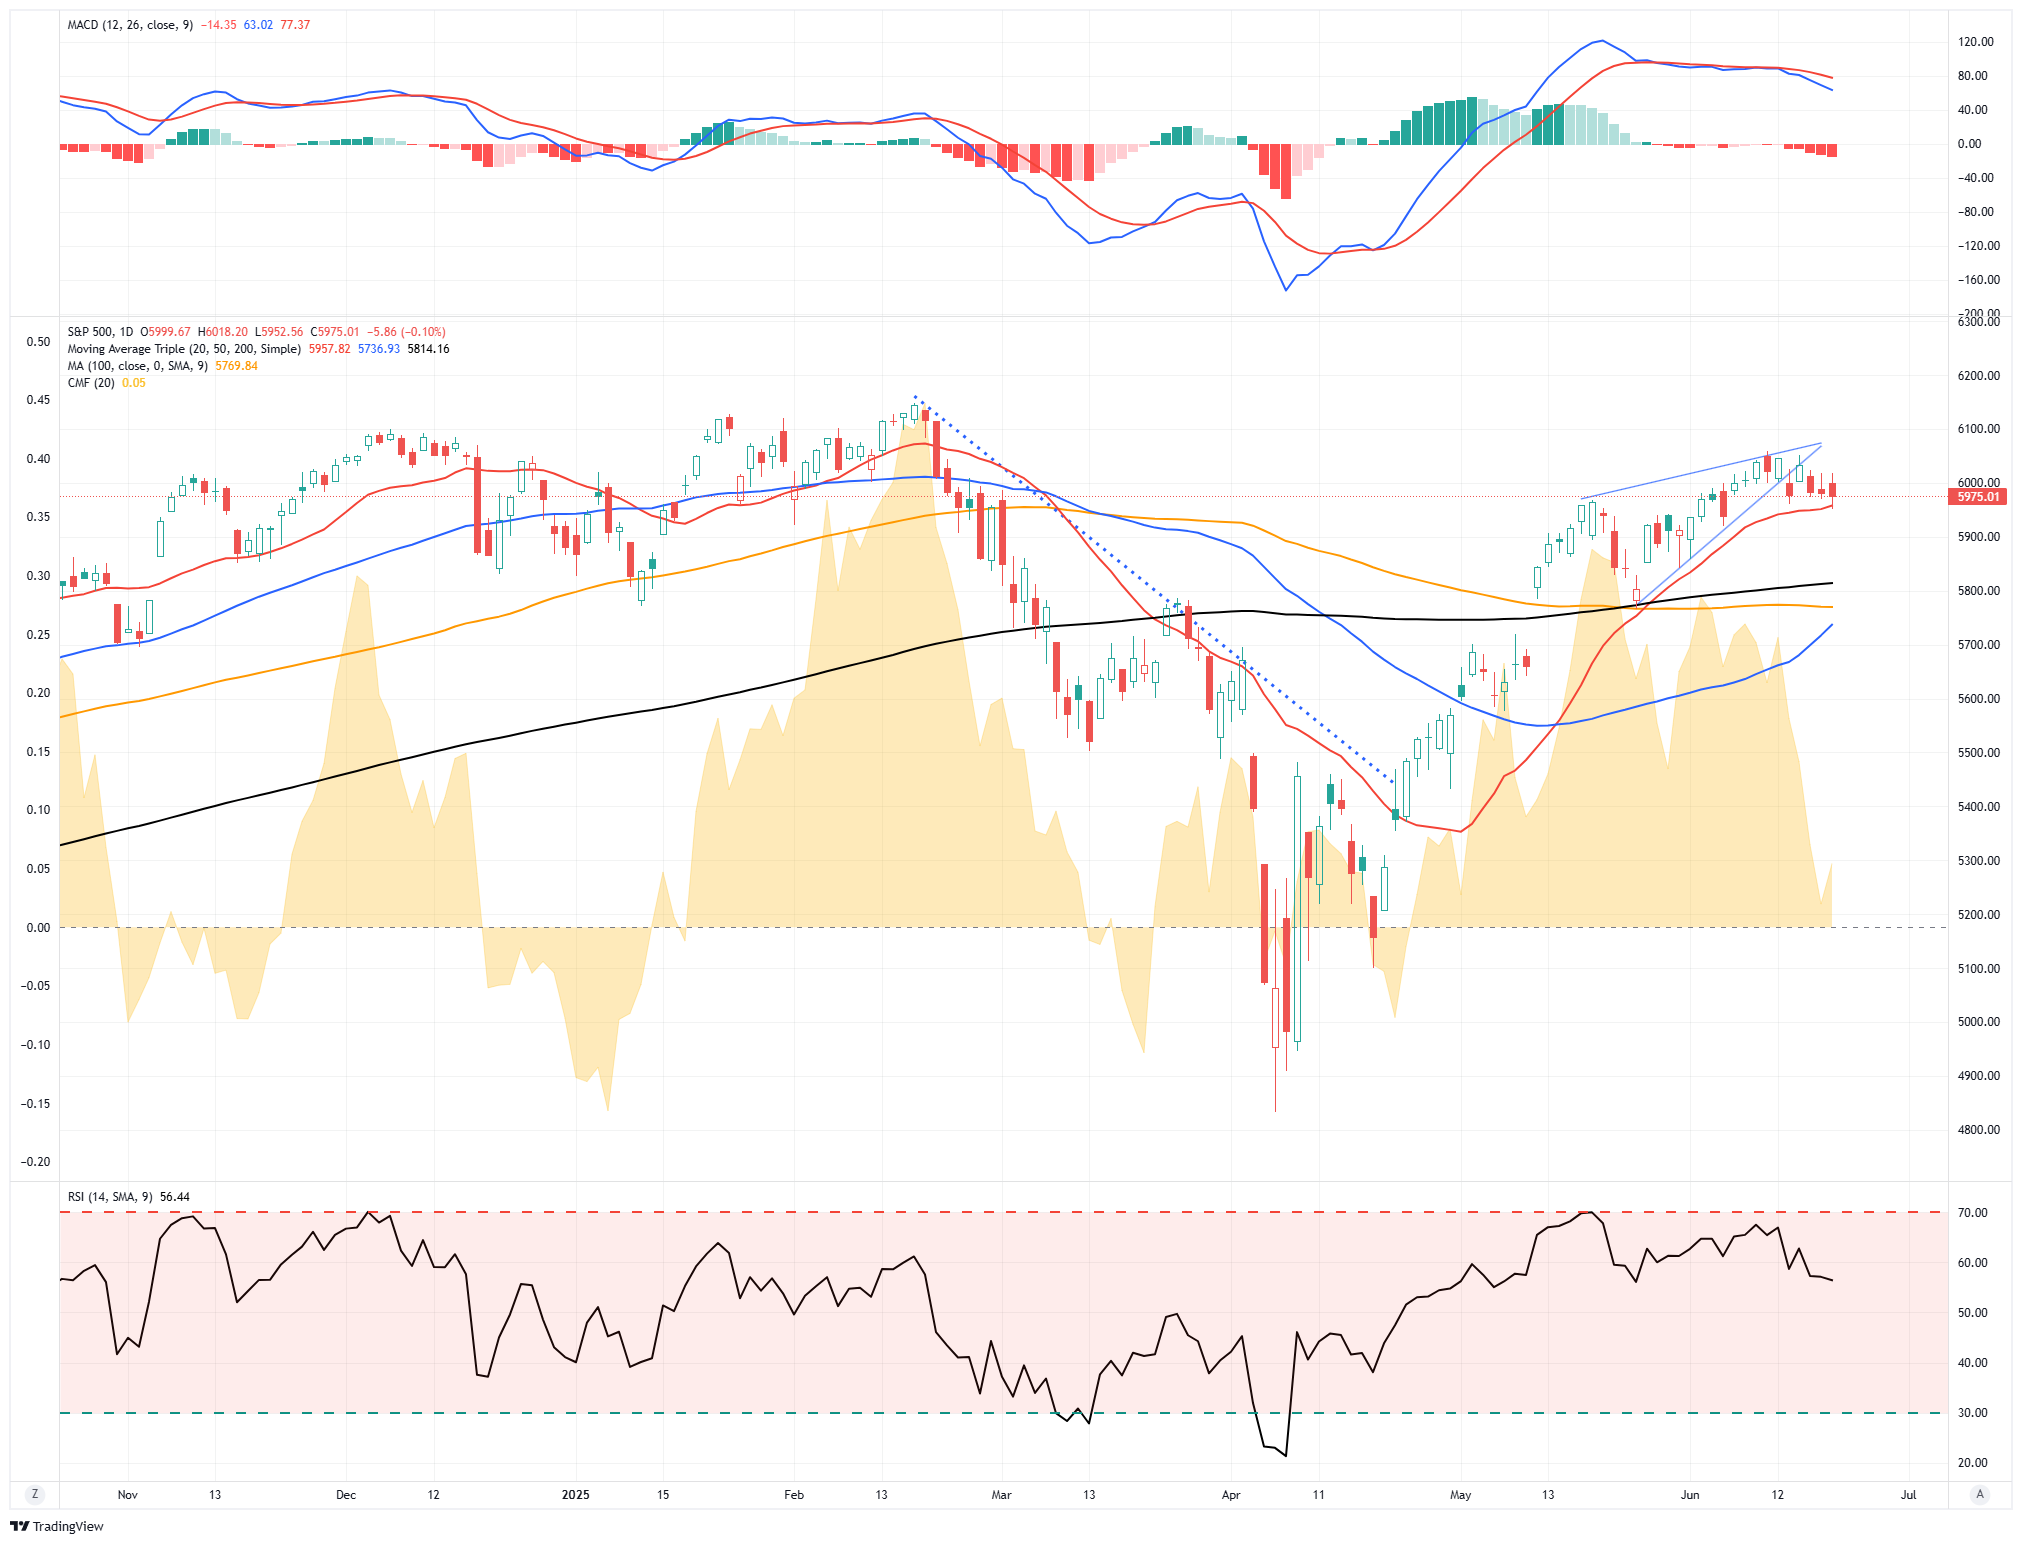
While many bearish headlines remain, the market is back into “risk-on” territory. As noted, while retail investors have been chasing the recent rally with more risky option trading and leveraged ETFs, professionals have not. At the same time, other measures of risk-on behavior have also appeared, as noted by Sentimentrader.com this past week.
“Human nature never changes, especially regarding making and losing money. When the market falls, investors become more fearful and lose their risk appetite. This creates an opportunity for individuals who know what to look for.
The S&P High Beta / S&P High Quality Relative Ratio Rank indicator shows where the ratio is relative to its range over the past four months. When the relative ratio is high, investors are showing risk-on behavior. When the ratio drops to a low level, they exhibit risk-off behavior. The chart below highlights those dates when the indicator dropped below five and then crossed above 75. The most recent signal occurred on 2025-06-09.”
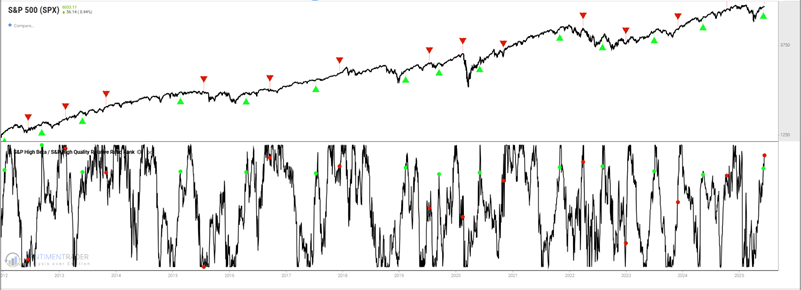
As shown, when that risk-on signal is triggered, it generally leads to higher asset prices over the next few months.

As Sentiment Trader concluded:
“That said, it is always important to remember that no favorable indicator – or combination of indicators -guarantees higher stock prices. Nevertheless, from a “weight of the evidence” perspective, the information above suggests giving the bullish case the benefit of the doubt unless and until price action provides us with a reason not to.”
The bullish case remains intact, suggesting that investor portfolios should be weighted toward equity exposure. However, that does not mean there will not be short-term pullbacks or consolidations in the market. Those pullbacks or consolidated positions should be used to increase exposure in portfolios. As we concluded last week:
“Patience is a virtue in this type of environment, but it is a tough commodity to come by. Those who have it tend to succeed, those who don’t, don’t.”
Let’s focus on the recent oil price rise and its impact on inflation.
Need Help With Your Investing Strategy?
Are you looking for complete financial, insurance, and estate planning? Need a risk-managed portfolio management strategy to grow and protect your savings? Whatever your needs are, we are here to help.

Oil Price Rise And The Impact On Inflation
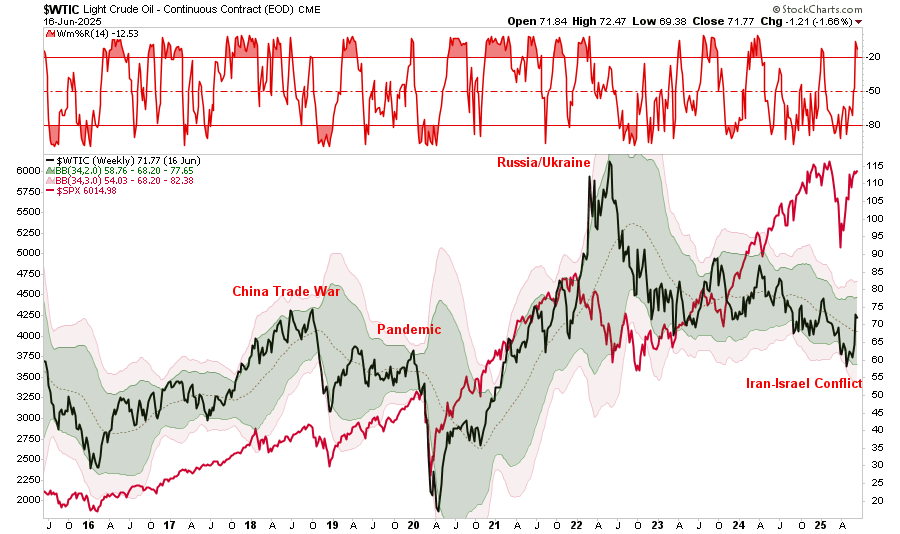
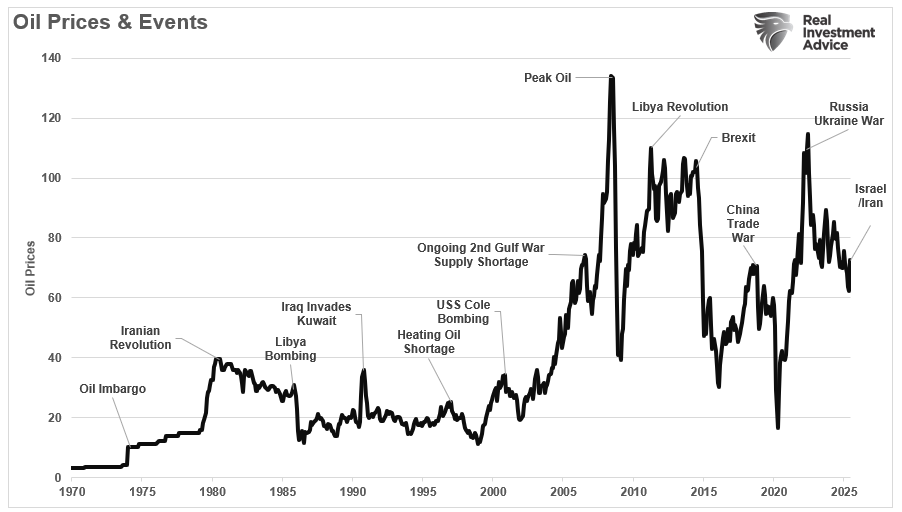
This past week, the oil price rise caused by the outbreak of the Iran/Israel conflict caught investors’ attention. However, as is always the case, it is important to keep price movements in context. As shown in the chart below, oil prices had become oversold early in the year as concerns of recession increased. Notably, oil prices, while not more extremely overbought, are moving in that direction. While there is much arm-waving and hand-wringing about the current oil price rise, oil remains in a broad downward trend from the 2022 Russian/Ukraine invasion.
While the oil price rise is certainly a worry, as it increases the burden on individuals, will it lead to a rise in the Consumer Price Index (CPI)? This is an important question, given that following the Federal Reserve meeting this week, its outlook for “tariff-driven” inflation remains unchanged. However, after four straight months of lower-than-expected inflation prints, that “tariff-driven” inflation has yet to appear amid slowing economic data. While it would seem the Fed should be cutting rates, the recent oil price rise may vindicate them with a short-term pick-up in inflation.
Let’s start with the linkage between oil prices and inflation by examining the makeup of the CPI inflation index.

Notice that “Food & Beverage,” “Housing,” “Transportation,” and “Medical Care” are the most significant weights in the CPI calculation. While Energy is included and makes up about 7% of the total CPI calculation, it is excluded, along with food, in the core inflation calculation. While oil price rises do negatively impact consumers, it is excluded by the Federal Reserve from its monetary policy decisions. The chart below compares oil prices to the core inflation rate.
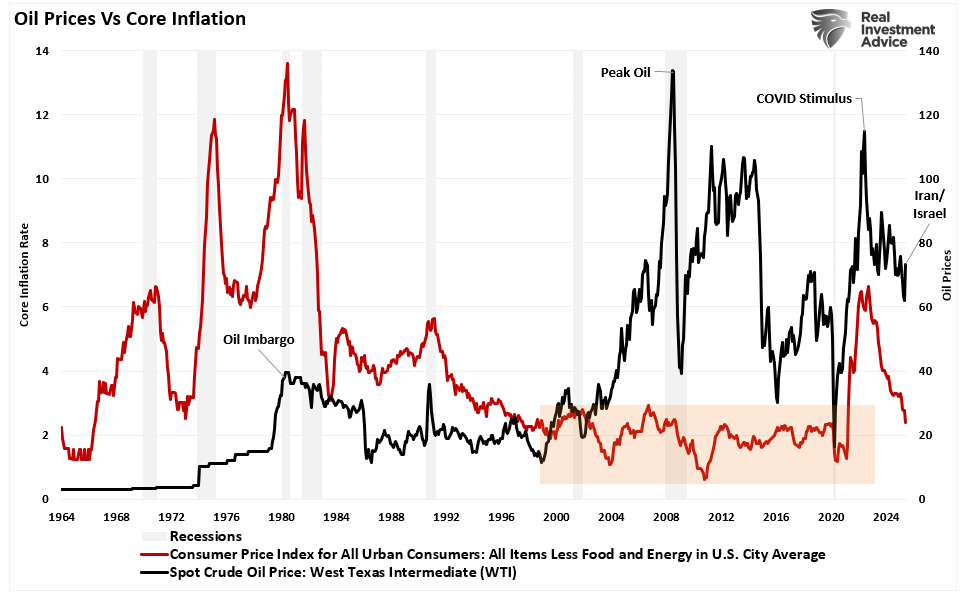
What you should notice is that oil price rises do impact core inflation. In other words, as oil prices rise, which feed into the most extensive constituents of the CPI calculation, from food to clothing to housing and transportation. If the current rise in oil prices persists, we should expect an uptick in headline and core inflation prints.
Crucially, any increase in inflation due to oil prices will also be very short-lived due to their impact on the economy and, ultimately, consumer demand.
Oil Price Inflation And Economic Outcomes
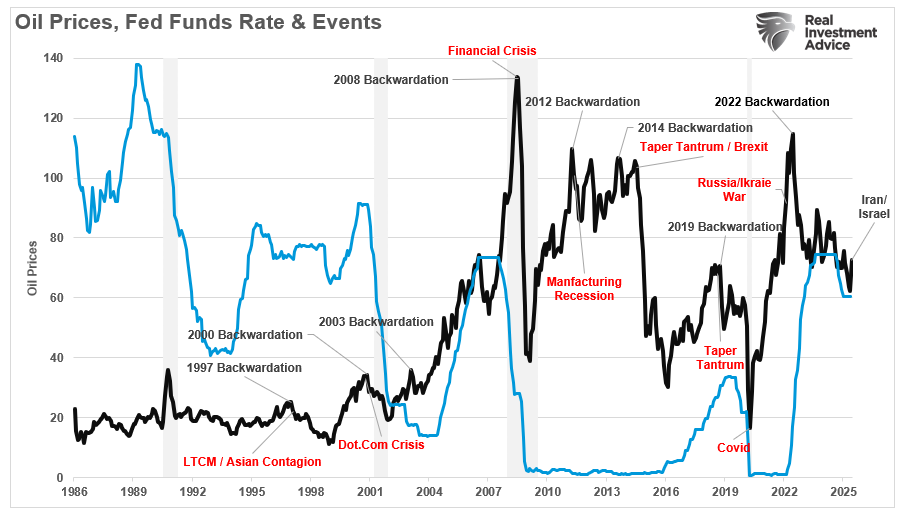
Oil spikes have historically negatively impacted economic outcomes. As the chart below shows, oil spikes typically are short-lived due to some exogenous geopolitical event. However, as was the case from 2003 to 2008, fundamental concerns, such as the fear of “peak oil,” can lead to more extended periods of higher prices.
The chart shows the inflation-adjusted price of oil since 1970.
While higher oil prices benefit oil companies by making the extraction process more profitable, they harm the economy.
“High oil prices add to the costs of doing business. And these costs are area also ultimately passed on to customers and businesses. Whether it is higher cab fares, more expensive airline tickets, the cost of apples shipped from California, or new furniture shipped from China, high oil prices can result in higher prices for seemingly unrelated products and services.” – Investopedia
Of course, high oil prices are immediately noticeable to consumers who fill up their gas tanks each week. While economic inflation reports strip food and Energy from the core calculation, the cost of food and fuel drives consumption patterns in the short term. Given that consumption comprises roughly 70% of the GDP calculation, the impact of higher oil prices is almost immediate.
Oil prices are crucial to the overall economic equation. As such, there is a correlation between oil prices and the economy.
The Link To Oil
We consume oil in virtually every aspect of our lives. From the food we eat to the products and services we buy. The demand side of the equation is a tell-tale sign of economic strength or weakness. We can see this clearly in the chart below, which combines rates, inflation, and GDP into one composite indicator.
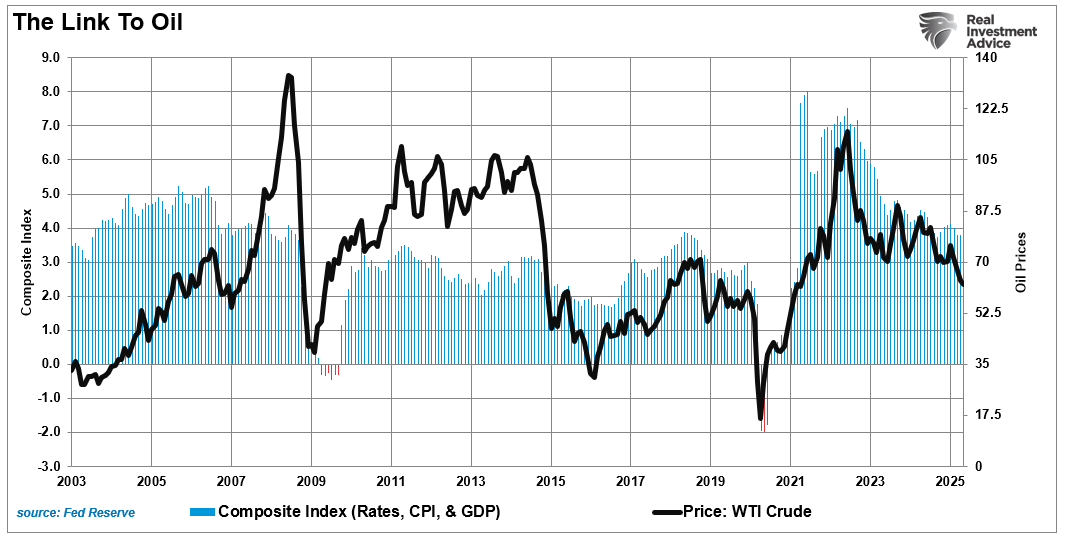
Notably, the oil industry is very manufacturing and production-intensive. Therefore, unsurprisingly, when oil prices rise, those increases correlate highly with economic composite changes. While rising oil prices increase manufacturing and CapEx, reducing consumption subtracts from economic growth.
However, here is the most critical point.
“It should not be surprising that sharp spikes in oil prices have been coincident with downturns in economic activity, a drop in inflation, and a subsequent decline in interest rates.“
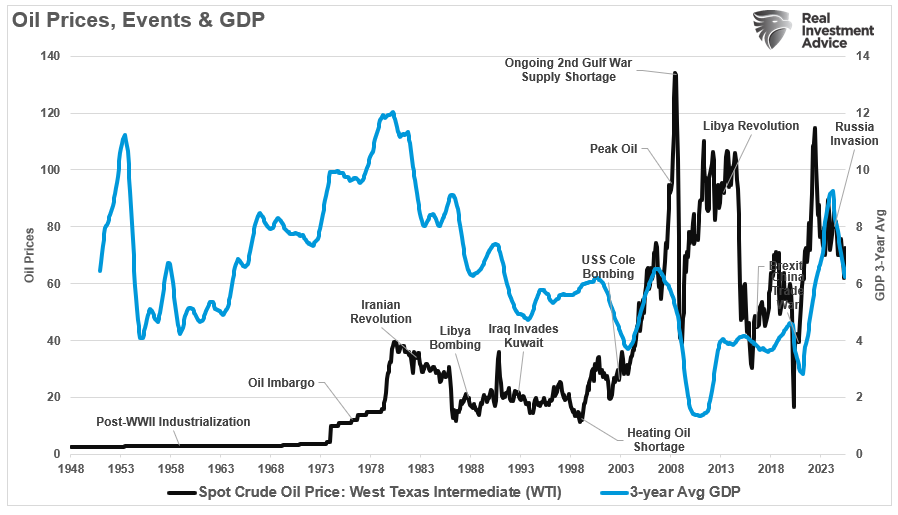
The chart below shows the historical oil price rises as a percentage change from the 4-year moving average. As noted, significant percentage increases typically precede recessionary onsets as the increased tax impacts the consumer. However, the recent price increase due to the Iran/Israel conflict does not suggest that any recession risk is present.

Most critically, when events such as the Russia/Ukraine invasion lead to a sharp increase in oil prices, the impact is immediate on the economy, but also short-lived. As the economy slows, demand falls, and oil prices contract due to the increased tax on consumers. As such, media-driven narratives about a “new future” of $100/bbl oil always fall short of reality due to the lack of consideration for oil prices’ tie to economic activity.
The short version is that oil prices reflect supply and demand. When economic demand weakens and surging oil prices divert disposable incomes from other consumption needs, the result tends to be a recessionary onset. As shown, the correlation between oil spikes and declines in economic growth (3-year average growth rate) should not be surprising.
Recessions Reduce Oil Prices
The latest employment and retail sales data suggest the economy is already slowing. As such, a sharp increase in oil prices increases the possibility of the economy slowing faster than anticipated. Debt and demographics will continue to drive deflationary pressures, further reversing inflation.
The recent oil price rise drove investors’ fears about a resurgence of inflation. As stated, such is not likely the case for the simple reason that higher oil prices are a drag on consumption. As the economic slowdown continues into early next year, this will coincide with a sharp decline in interest rates as deflation re-emerges.
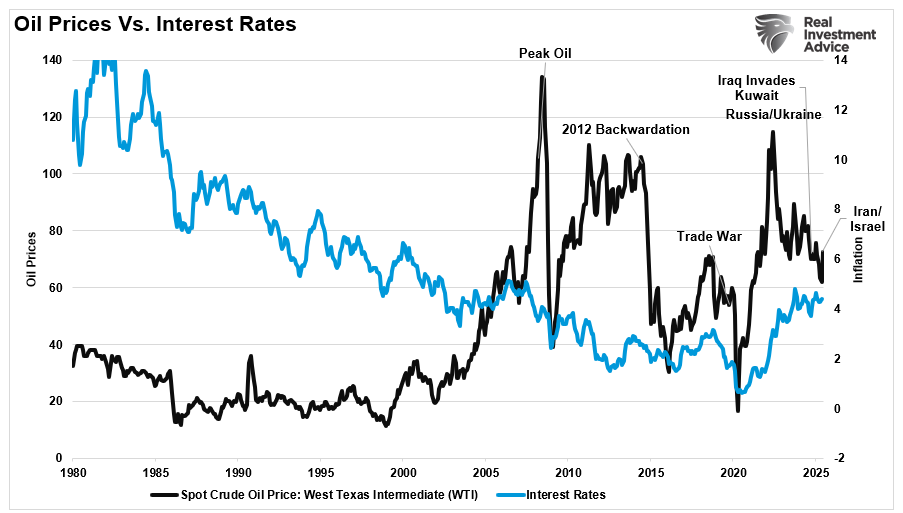
Of course, the Federal Reserve’s monetary policy is currently the biggest drag on economic growth, with the highest propensity to induce a recession. Historically, when the Fed has hiked rates or tapered its balance sheet, oil prices fall due to slower economic growth. Again, such should be unsurprising as oil prices are a function of supply and demand.
Notably, with oil prices rising, student loan payments restarting, delinquency rates rising, and slowing job growth running headlong into elevated interest rates, the drag on the economy is significantly larger than economists currently expect. The weight of evidence suggests that the recent rise in oil prices, not tariffs, will likely lead to a temporary uptick in inflation. However, as history clearly shows, it won’t last long before the deflationary impact of higher oil prices takes hold.
How We Are Trading It
Rising tensions between Iran and Israel are once again pushing oil prices higher, fueling headlines and investor anxiety. While these geopolitical shocks can cause sharp, short-term spikes in energy prices, investors must separate emotional reactions from portfolio strategy.
Historically, oil price spikes driven by conflict tend to be short-lived. Why? As discussed above, higher energy costs tax consumers and businesses, slowing economic activity and dampening demand. Eventually, that drop in demand brings prices back down, often quickly once tensions ease.
So, how should investors navigate this volatile environment?
- Avoid Overreacting to Headlines. These price surges are usually temporary. Do not make drastic allocation changes based solely on geopolitical noise.
- Diversify Across Asset Classes. Commodities like oil are inherently volatile. Balance exposure with uncorrelated assets such as bonds, cash equivalents, or sectors that benefit from falling energy costs, such as consumer staples and utilities.
- Use Tactical Exposure Sparingly. If you choose to add energy exposure, do it tactically and temporarily. Consider integrated oil companies with strong balance sheets that weather both price spikes and declines.
- Focus on Risk Management. Now is the time to recheck portfolio allocations and ensure you’re not overly exposed to inflation-sensitive assets or sectors that suffer from higher input costs.
Geopolitical risks are ever-present, but like most market disruptions, they tend to pass. Stay disciplined, stay diversified, and let fundamentals—not fear—drive your investment decisions.

At RIA Advisors, we help clients manage volatility with strategies focusing on long-term stability, not speculation.
Feel free to reach out if you want to navigate these uncertain waters with expert guidance. Our team specializes in helping clients make informed decisions in today’s volatile markets.
Research Report
Subscribe To “Before The Bell” For Daily Trading Updates
We have set up a separate channel JUST for our short daily market updates. Please subscribe to THIS CHANNEL to receive daily notifications before the market opens.
Click Here And Then Click The SUBSCRIBE Button
Subscribe To Our YouTube Channel To Get Notified Of All Our Videos
Bull Bear Report Market Statistics & Screens

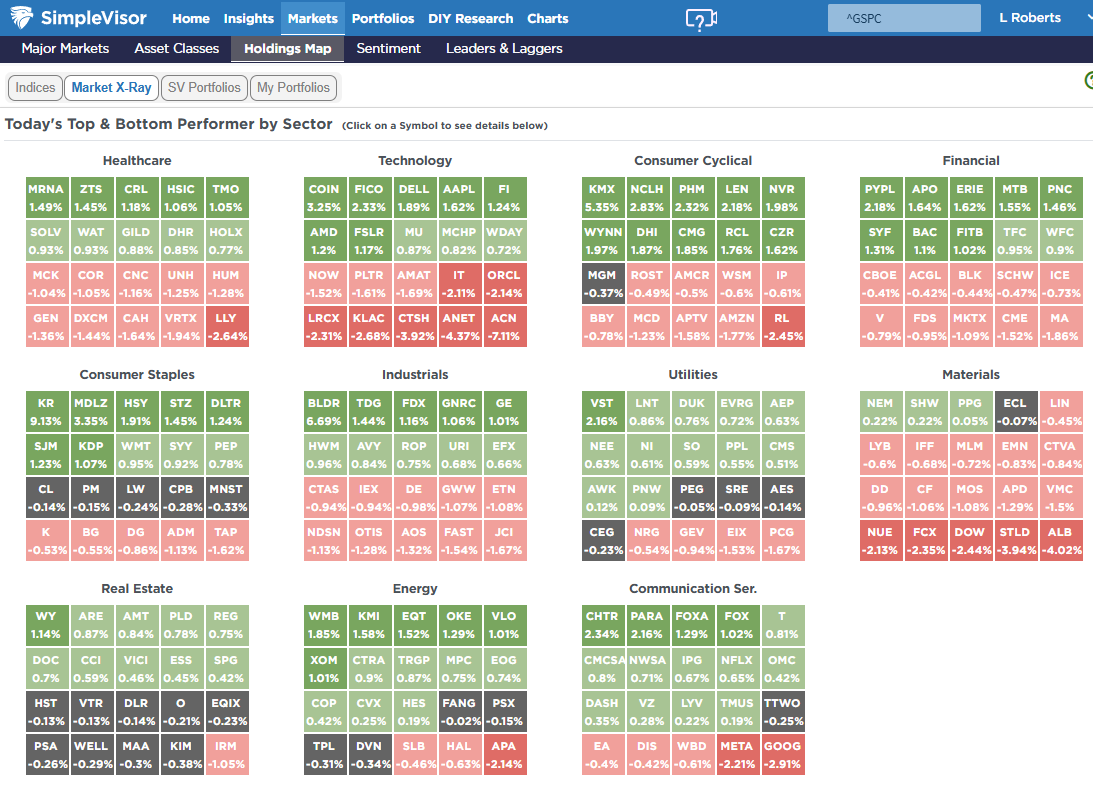
SimpleVisor Top & Bottom Performers By Sector
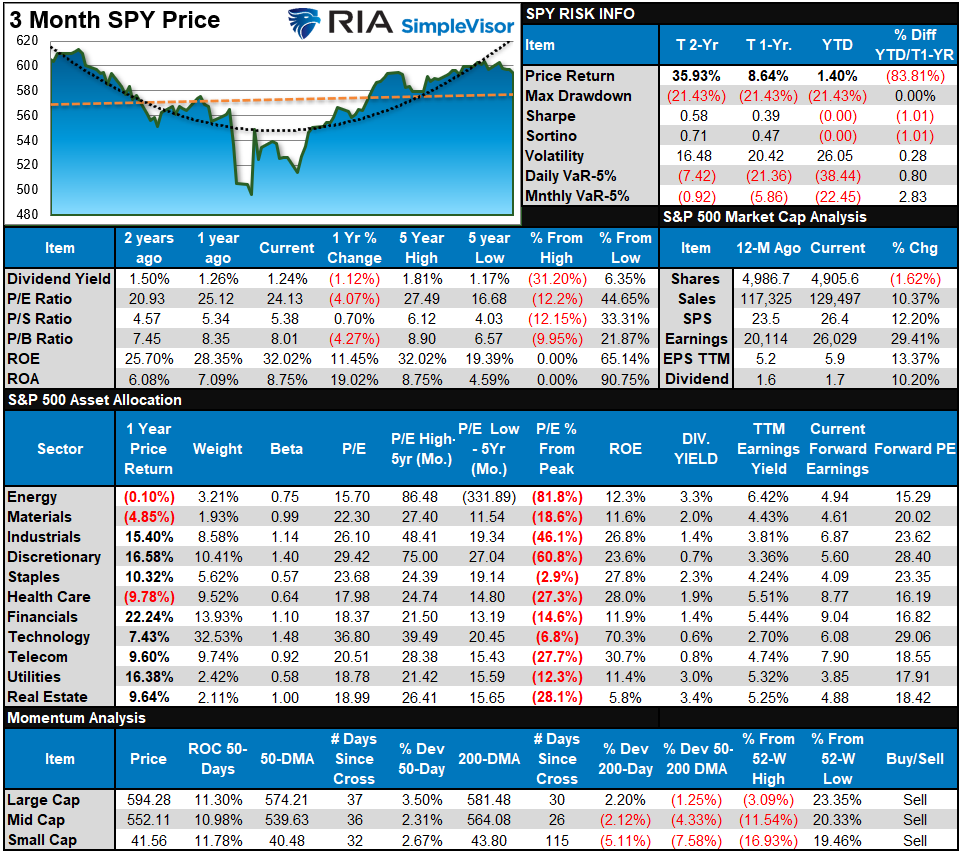
S&P 500 Weekly Tear Sheet
Relative Performance Analysis
As noted last week, the market continued to consolidate as investors wrestled with headlines of the Iran/Israel conflict. With the market moving back toward oversold, we could see more consolidation this week as we wrap up the quarter-end, but with earnings season starting after Independence Day, we could see the bulls return to the market. Continue to manage risk, but look for opportunities to increase exposure in oversold markets and sectors as needed.
Technical Composite
The technical overbought/sold gauge comprises several price indicators (R.S.I., Williams %R, etc.), measured using “weekly” closing price data. Readings above “80” are considered overbought, and below “20” are oversold. The market peaks when those readings are 80 or above, suggesting prudent profit-taking and risk management. The best buying opportunities exist when those readings are 20 or below.
The current reading is 73.92 out of a possible 100.

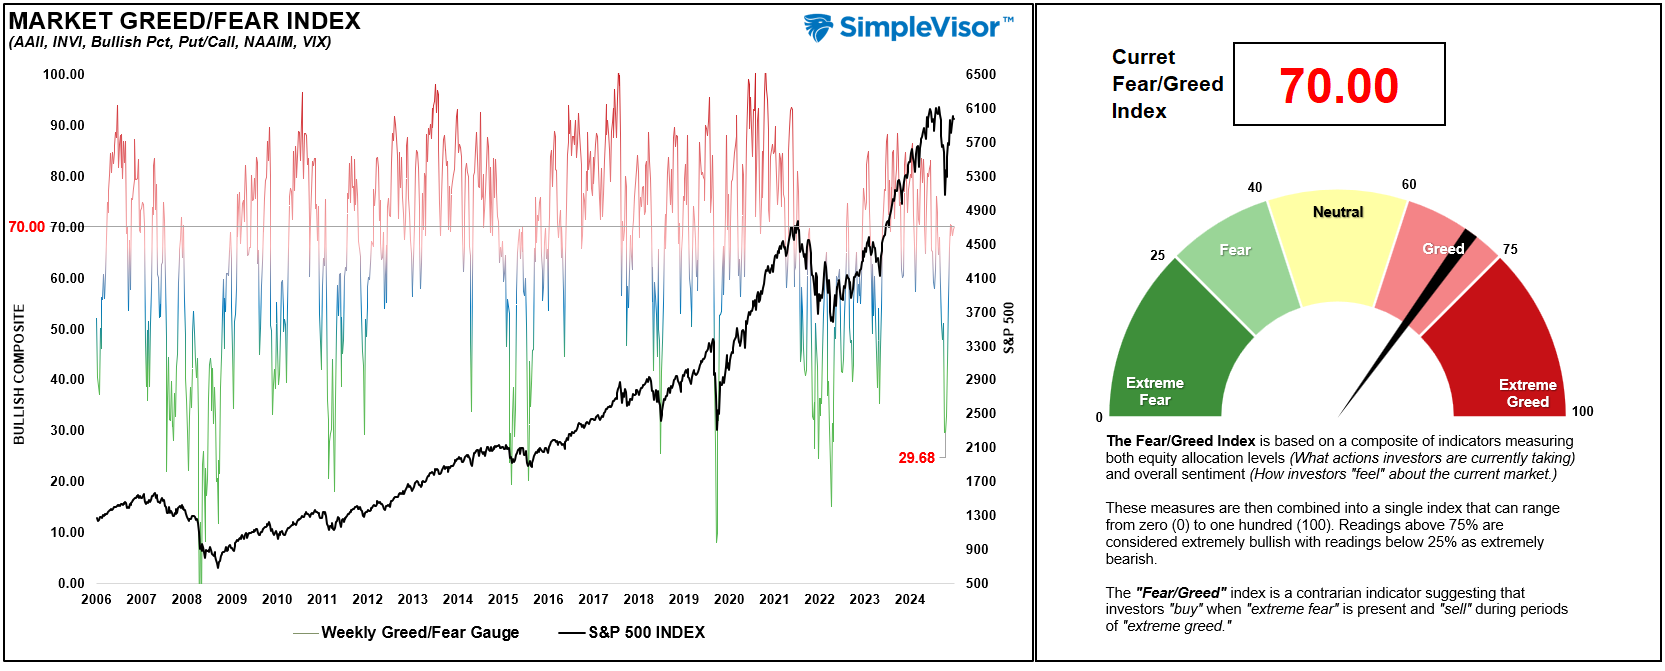
Portfolio Positioning “Fear / Greed” Gauge
The “Fear/Greed” gauge is how individual and professional investors are “positioning” themselves in the market based on their equity exposure. From a contrarian position, the higher the allocation to equities, the more likely the market is to be closer to a correction than not. The gauge uses weekly closing data.
NOTE: The Fear/Greed Index measures risk from 0 to 100. It is a rarity that it reaches levels above 90.
The current reading is 70.00 out of a possible 100.
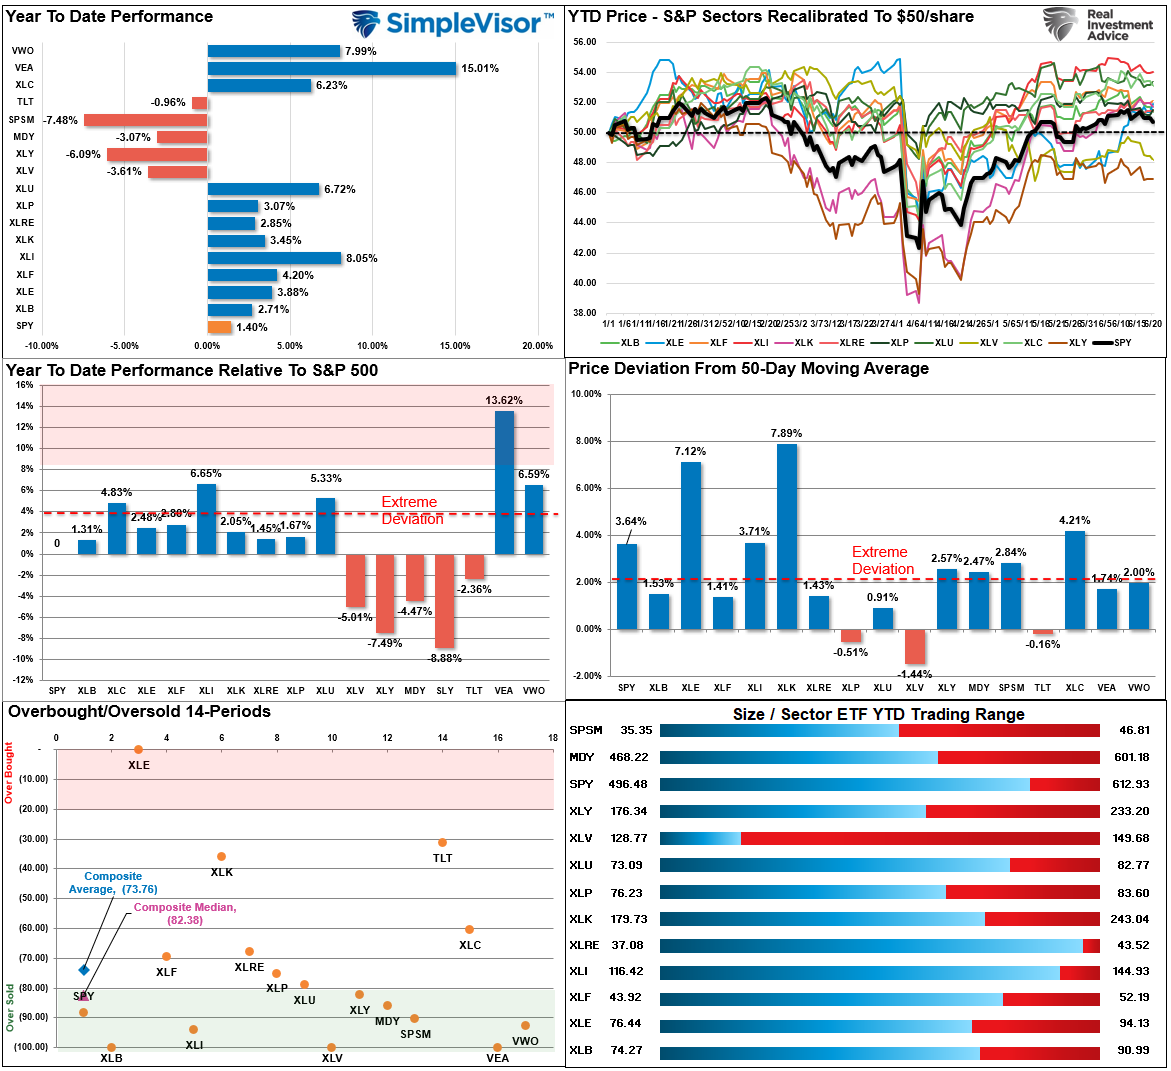
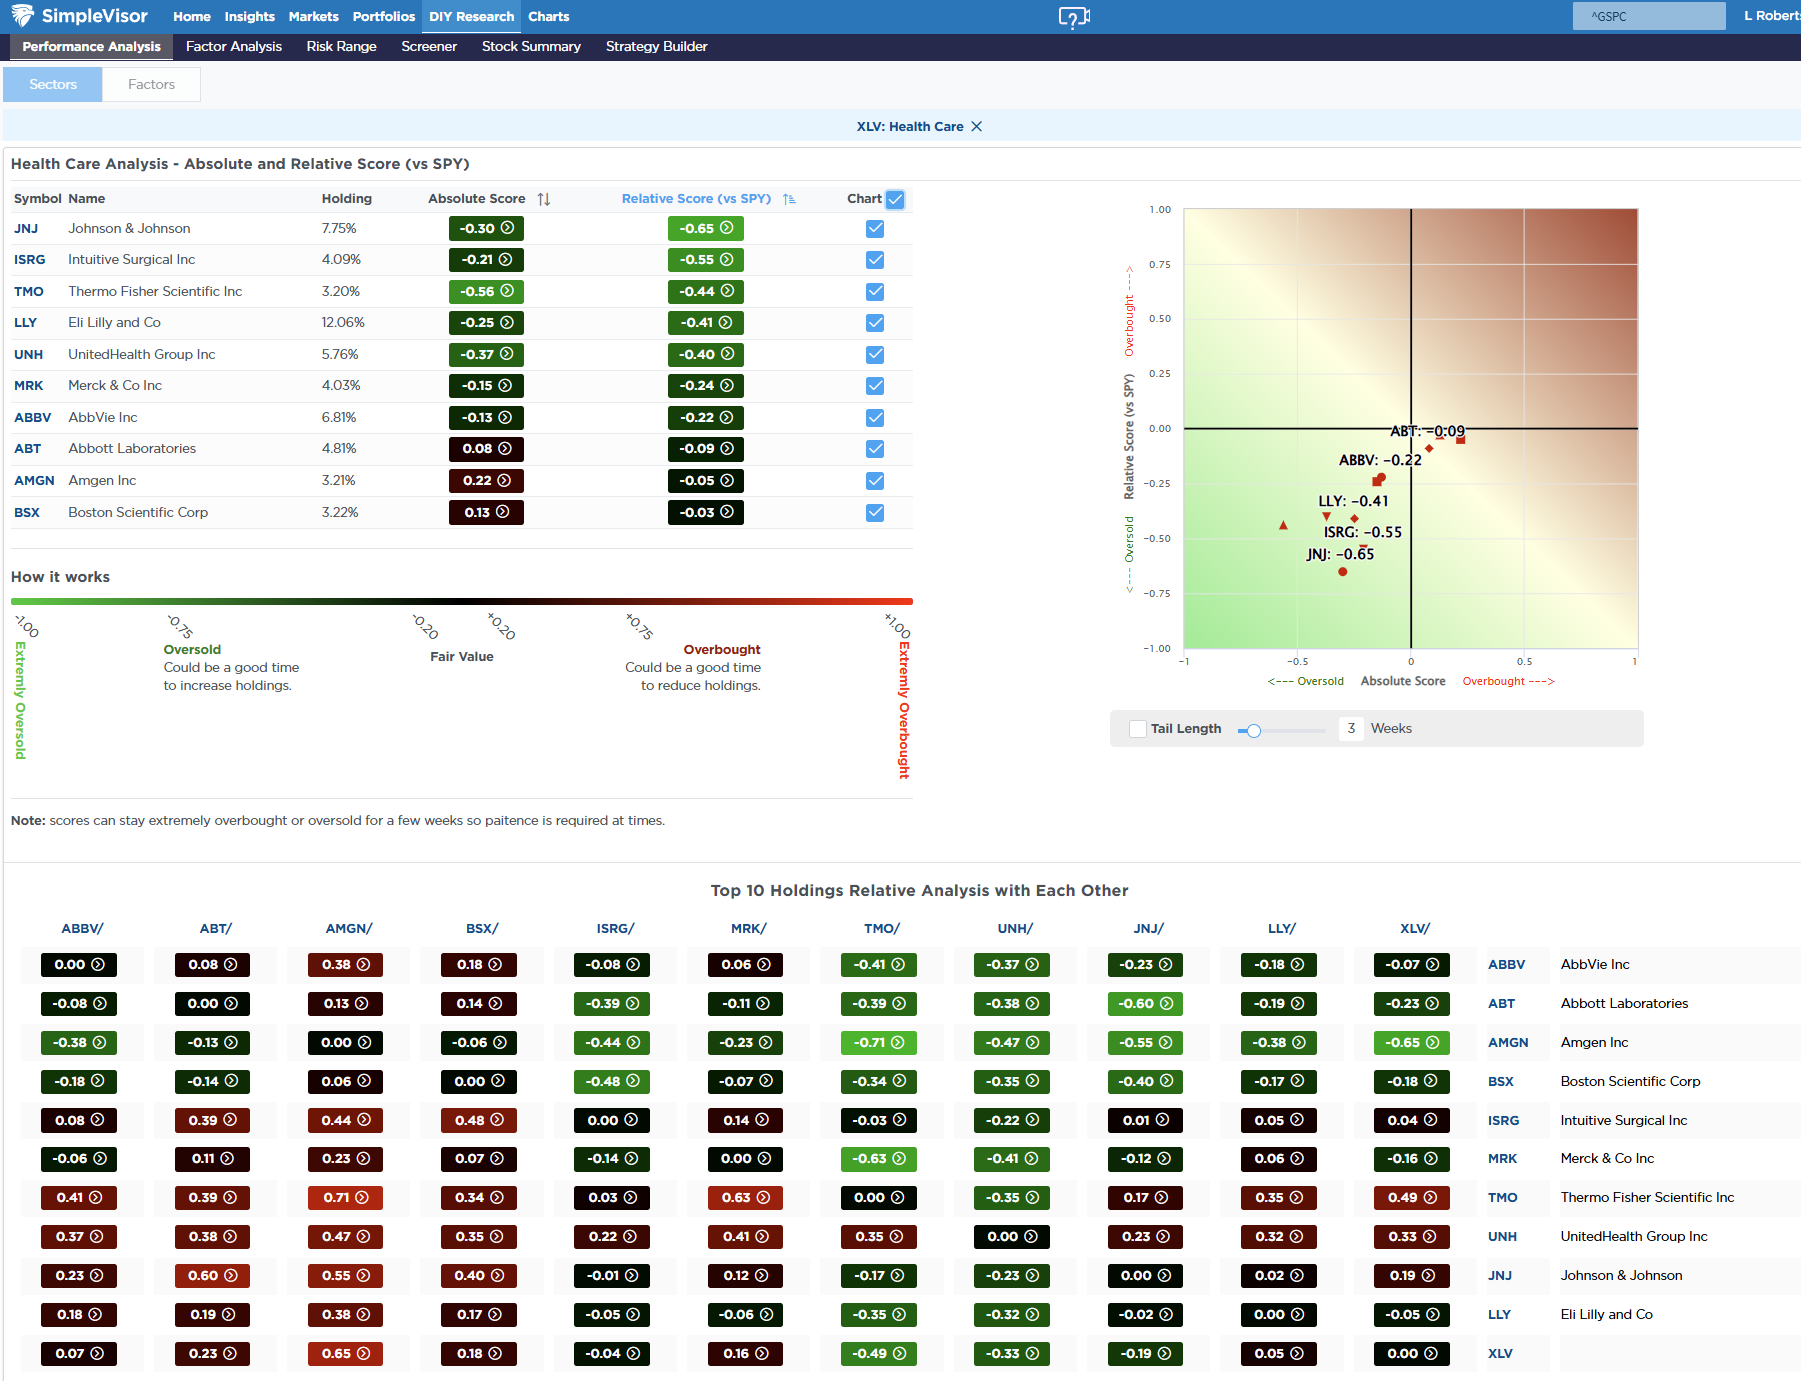
Relative Sector Analysis

Most Oversold Sector Analysis
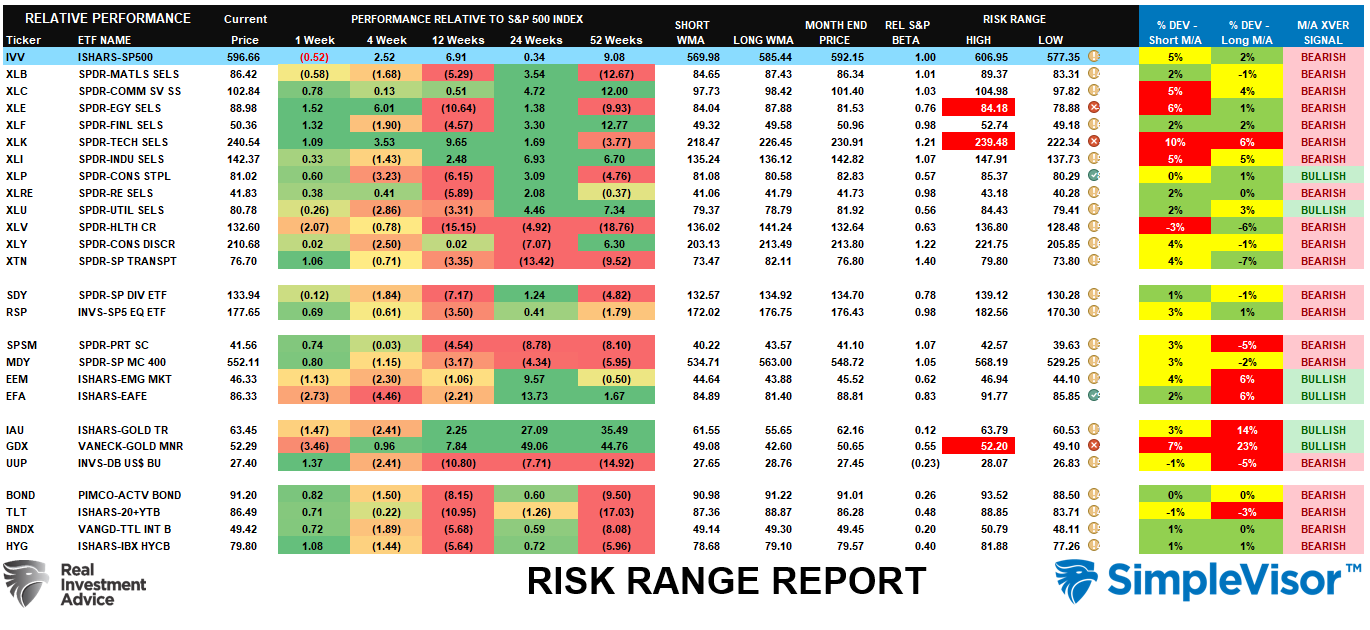
Sector Model Analysis & Risk Ranges
How To Read This Table
- The table compares the relative performance of each sector and market to the S&P 500 index.
- “MA XVER” (Moving Average Crossover) is determined by the short-term weekly moving average crossing positively or negatively with the long-term weekly moving average.
- The risk range is a function of the month-end closing price and the “beta” of the sector or market. (Ranges reset on the 1st of each month)
- The table shows the price deviation above and below the weekly moving averages.
Despite the quick attempt to break out of the consolidation range from mid-May, the market struggled this week with overbought conditions and headlines of the Iran/Israel conflict. Currently, energy, technology, and gold miners are the ones that most deviate from their monthly ranges. However, with many sectors still on bearish crossovers, this suggests some caution until we begin to see improvement. There is no reason overly bearish in allocations, but there is also not much support for being excessively bullish. Continue to manage risk and exposures until we get through the end of the quarter, and then we can reassess portfolios heading into July.
Weekly SimpleVisor Stock Screens
We provide three stock screens each week from SimpleVisor.
This week, we are searching for the Top 20:
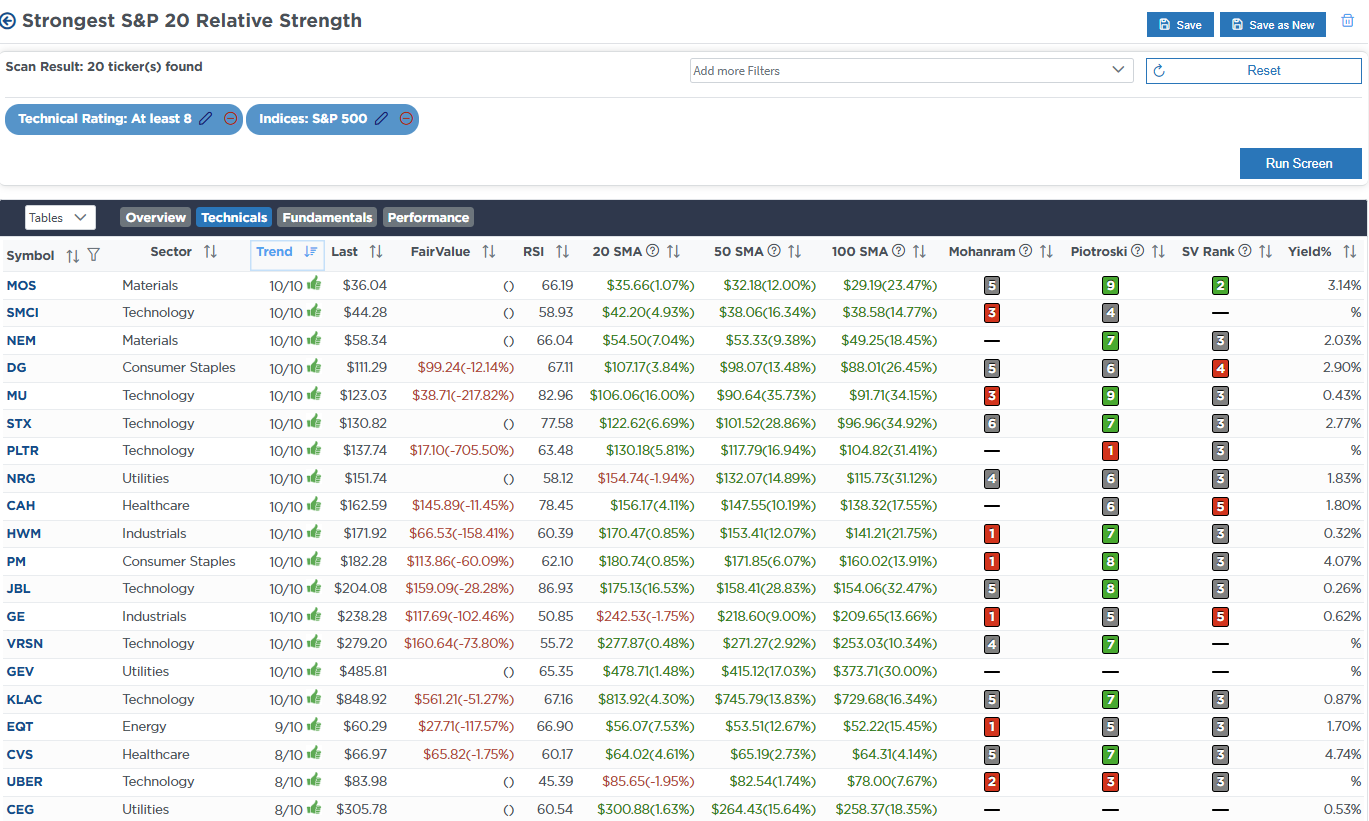
- Relative Strength Stocks
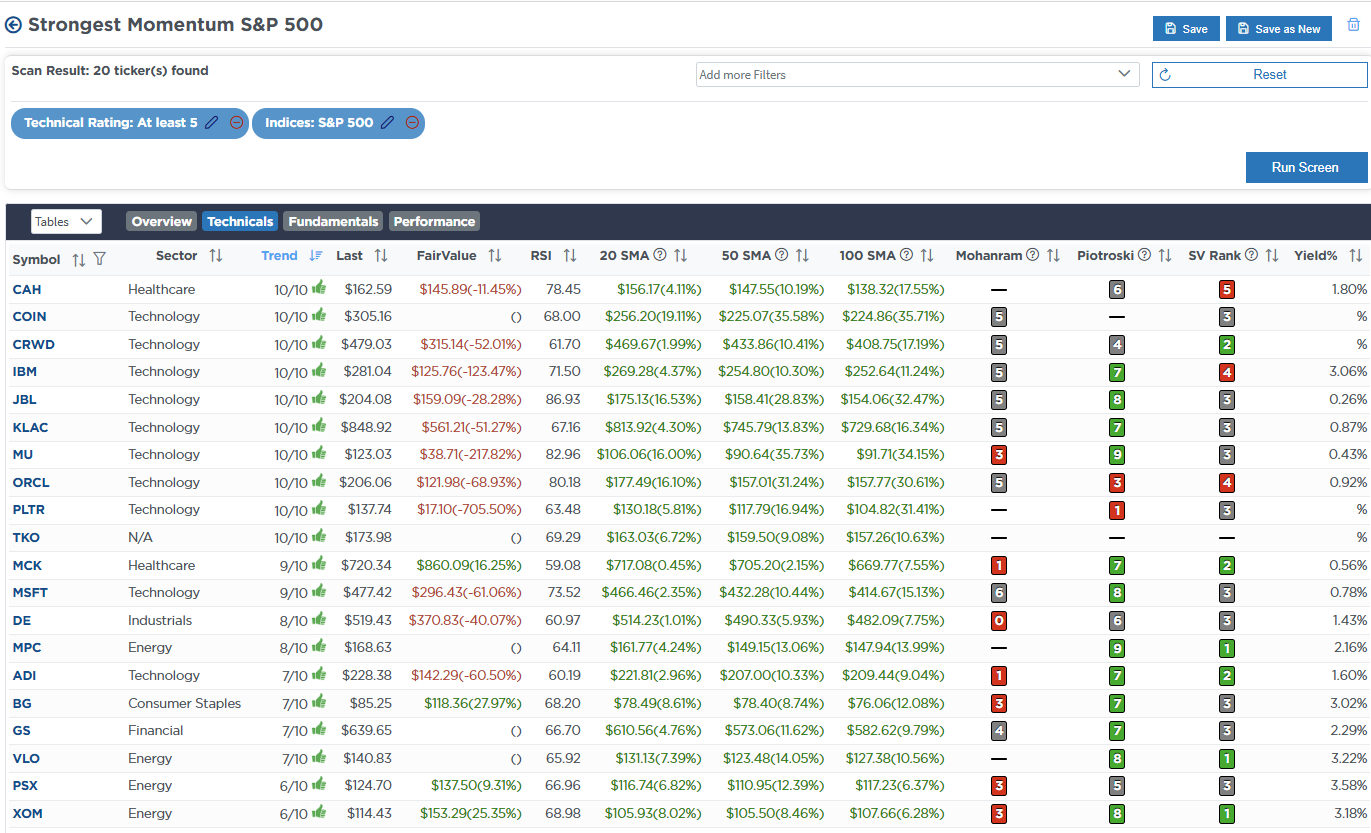
- Momentum Stocks
- Technical Strength W/ Dividends
(Click Images To Enlarge)
RSI Screen
Momentum Screen
Technically Strong With Dividends

SimpleVisor Portfolio Changes
We post all of our portfolio changes as they occur at SimpleVisor:
No Trades This Week
Lance Roberts, C.I.O., RIA Advisors

