Inside This Week’s Bull Bear Report
- The Bull Rally Continues
- How We Are Trading It
- Research Report – The Deficit Narrative May Find Its Cure In AI
- YouTube – Before The Bell
- Market Statistics
- Stock Screens
- Portfolio Trades This Week
Risk/Reward Favors Patience
I am traveling this weekend, so we are producing our weekly report a day early. As such, some charts using end-of-week data are using either Thursday or mid-Friday prices. All report will return to normal next week.
Let’s start with where we left off last week.“
“Despite a weakening unemployment report, a spat between President Trump and Elon Musk, a resurgence in the Ukraine/Russia conflict, and remaining tariff uncertainty between China, Europe, and the U.S., the markets continued their bullish ways this past week. Notably, the market broke out of the ongoing consolidation process that has been in place since May 12th. The good news is that bullish breakouts confirm bullish momentum and suggest markets will trade higher into the next resistance level. That next resistance level is 6100, the previous topping process before the March and April decline.”
The market’s bullish trend continued this week, and it is rapidly approaching all-time highs. However, an Israeli strike on Iran early Friday morning sent stocks tumbling at the open, but as of midday, as I am writing this report, most of the initial decline has fully recovered. We noted that a correction or consolidation process is needed to work off some short-term overbought conditions. But, as seen on Friday, any pullback is quickly bought by investors chasing the market in the near term.
As noted last week, we await a pullback to increase portfolio exposure further. However, given that sentiment and positioning measures are in the middle of their ranges, this suggests the bulls remain in control, and any substantial correction could take a while longer to occur. Let me repeat an essential statement from last week:
“Critically, we are not looking for LOWER prices to add exposure. I am okay with paying higher prices. However, we are searching for a better risk/reward opportunity to add exposure. As such, a consolidation period that allows relative strength or momentum to cool off somewhat will provide a better buying opportunity than under current conditions. We already have sufficient exposure to the market to gain performance when markets rise, but deploying capital at these levels is more “risky” than I prefer.”
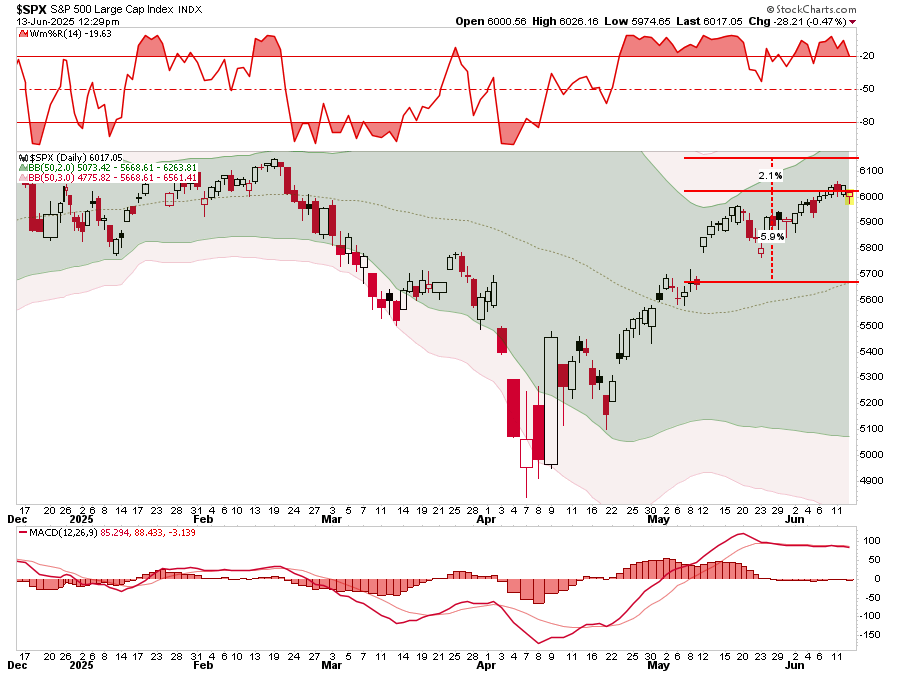
If we measure risk/reward technically, there is more downside risk than upside potential. The market could reach all-time highs, about 2% above current levels. Conversely, it would take nearly a 6% decline to retrace to the 50-DMA. That is a negative 3-to-1 bet. Most poker players I know would not take those odds. As such, there is no compelling “bet” for deploying capital. However, with some patience and the willingness to sacrifice some short-term performance, we will get an opportunity where the risk/reward proposition improves markedly. Just not when most expect them.
However, the psychological weight of “missing out” on a bull rally that won’t seemingly stop is hard to fight in the short term. This is usually when most investors make their worst investment decisions. Patience is a virtue in this type of environment, but it is a tough commodity to come by. Those who have it tend to succeed, those who don’t, don’t.
Need Help With Your Investing Strategy?
Are you looking for complete financial, insurance, and estate planning? Need a risk-managed portfolio management strategy to grow and protect your savings? Whatever your needs are, we are here to help.

Will This Bull Rally Ever Stop?
The most asked question this past week is, “When will this bull rally end?“ This is an interesting note given that in early April, amid the tariff-driven selloff, the question was, “When will this selloff end?” Of course, this is always the issue with market swings as they feed into our emotional biases of “fear” and “greed.”
Since hitting its lows in April 2025, the stock market has staged an impressive bull rally, driven by a series of pivotal shifts. The initial trigger was the sharp sell-off sparked by President Trump’s announcement of sweeping tariffs on nearly all U.S. trading partners, which rattled investors. However, the administration’s decision on April 9 to pause tariff increases for 90 days and exempt high-demand tech products like smartphones and computers ignited a historic relief rally, with the S&P 500 soaring 9.52%, the Dow 7.87%, and the Nasdaq 12.16% in a single day.
That momentum, which has been primarily driven by retail investors, has carried forward, helped by corporate earnings where S&P 500 companies posted 12.5% year-over-year profit growth in Q1 2025, led by mega-cap tech, AI-driven firms, and consumer discretionary sectors. Economic data has also supported the bullish sentiment, with May’s Nonfarm Payrolls adding 139,000 jobs and April’s CPI inflation at a lower-than-expected 2.3%, easing fears of tariff-driven price spikes. Falling Treasury yields, from 4.6% in April to below 4.5% by June, and global liquidity boosts from central banks like China’s have further propped up risk assets. The market’s optimism is also rooted in technical strength, with the S&P 500 nearing all-time highs around 6,144 and small-cap indices like the Russell 2000 breaking key levels, signaling sustained bullish momentum.
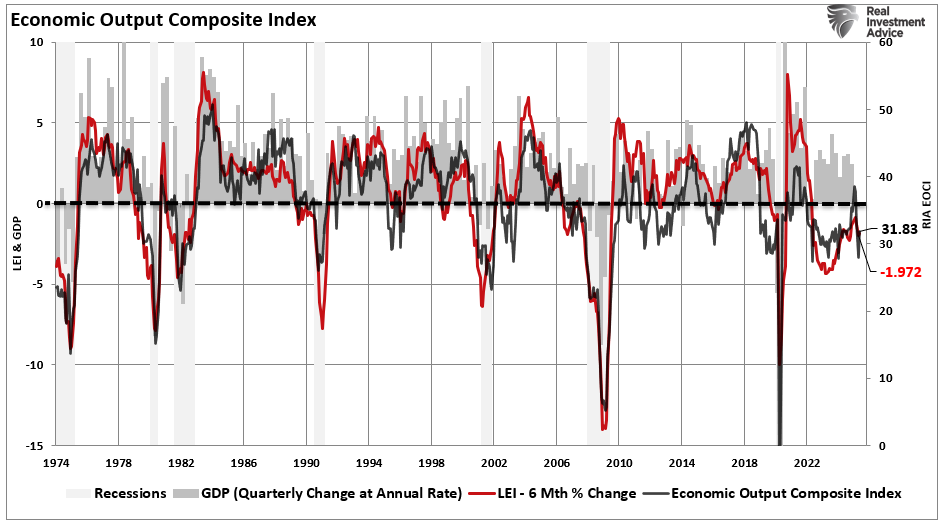
However, there are technical and fundamental risks for the bull rally to continue. A key risk is the potential reinstatement of tariffs if the 90-day pause expires without resolution or if trade talks, like those with China, falter. Inflation remains an ongoing concern, potentially keeping the Federal Reserve on pause with its rate-cutting cycle, which markets now expect to deliver only 1.77 cuts in 2025, down from 2.19. Signs of economic cooling, such as rising unemployment claims and overall economic data slowing, could put earnings expectations at risk. The economic composite index below, which comprises more than 100 data points, dropped sharply in April with the tariff announcements but rebounded sharply in May. However, it remains in very slow growth territory.
Overvaluation is a growing worry, as lofty valuations in tech and AI stocks may not hold if earnings growth slows—2025 estimates have already been trimmed from 14% to 8.5%.

However, despite those concerns, the bull rally rides a wave of optimism.
Optimism is another word for the current market price momentum levels, which are fed by investors’ emotional “fear of missing out.” Those rallies tend to last longer than most think.
So, when will this rally end? No one knows; however, some indicators can help us navigate this bull rally.
The Herd Is Right In The Middle
This past Monday, we posted an article about “How To Buy The Dip,” which covered two crucial ingredients of both bearish corrections and bullish rallies: sentiment and price. As discussed, sentiment is essential in this analysis for several reasons:
- Contrarian Indicator: Extreme sentiment often signals reversals. When investors are overly bullish (e.g., excessive buying, high confidence), it may indicate a market peak, as most buyers are already invested, leaving little room for further gains. Conversely, extreme bearishness (e.g., panic selling, widespread fear) often marks market lows, as selling pressure may be exhausted, creating rebound opportunities.
- Herd Behavior: Sentiment drives herd mentality, amplifying price movements. At peaks, euphoria can lead to overvaluation as investors pile in. At lows, fear can cause undervaluation as investors exit en masse.
- Market Psychology: Sentiment reflects psychological biases like greed and fear, which can disconnect prices from fundamentals. Understanding sentiment helps identify when markets are driven by emotion rather than value.
- Timing Entry/Exit Points: Investors use sentiment to time trades. For example, high bullishness may prompt contrarians to sell, anticipating a correction, while extreme bearishness may signal a buying opportunity.
However, while sentiment is crucial, investors should integrate technical signals with fundamental analysis and sound risk management to avoid false signals and optimize outcomes. However, here is the most critical point as noted:
“The biggest challenge for investors is always being patient and waiting for the “fat pitch.” When we examine the sentiment and technical indicators in more detail, we find their validity is at the extremes, not in the middle. In other words:
“The “herd” tends to be right in the middle of a move but wrong on both ends.”
With both weekly technical and sentiment measures in the middle, and the market rising, the odds favor a market that will continue to increase further. In other words, don’t bet against the bulls during a bullish trend in the market, and vice versa.“
In that article, we discussed the composite sentiment “fear/greed” gauge and the technical composite in further detail. For this post, I have combined the two to represent the high correlation between market price and sentiment visually. This is obvious but essential to understand.
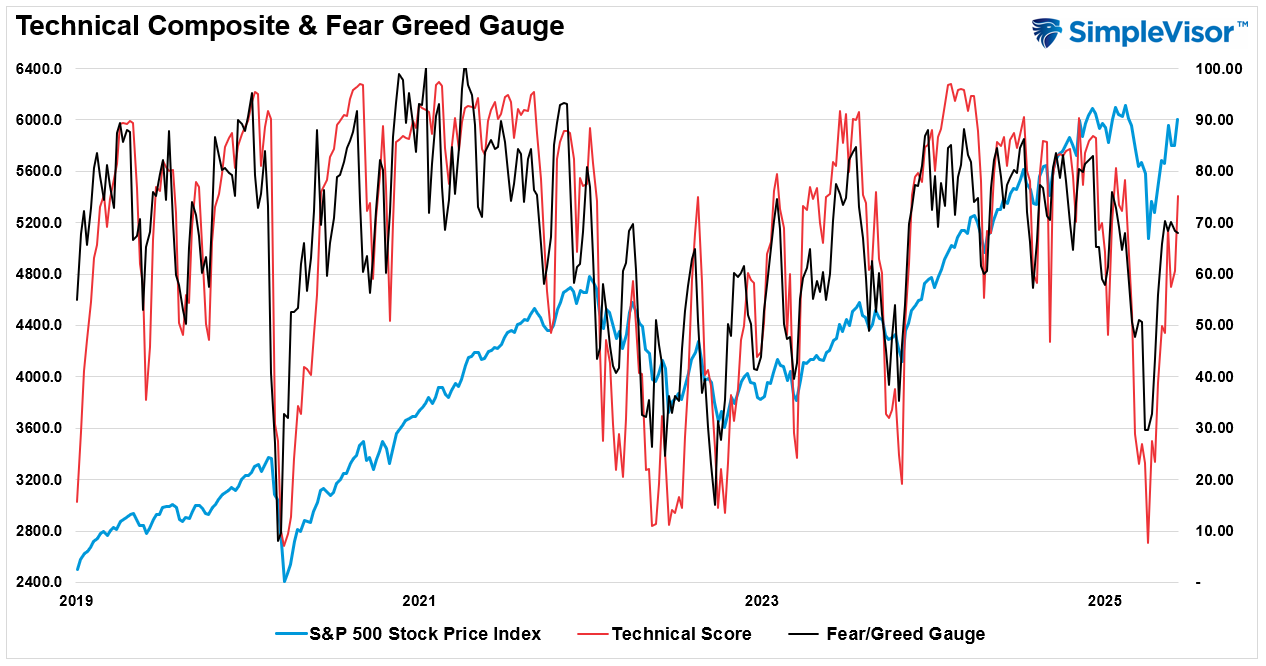
As shown, the best opportunities to “buy” or “sell” the market are when the indicators are at extremes. Such extremes tend to be very close to market peaks or troughs. However, as noted above, the “herd” tends to be correct in the middle. When both the price and sentiment of the market are turning more bullish, particularly from being extremely bearish, that trend tends to stay intact for some time. This is because investors are chasing price for the “fear” of missing out on further gains.
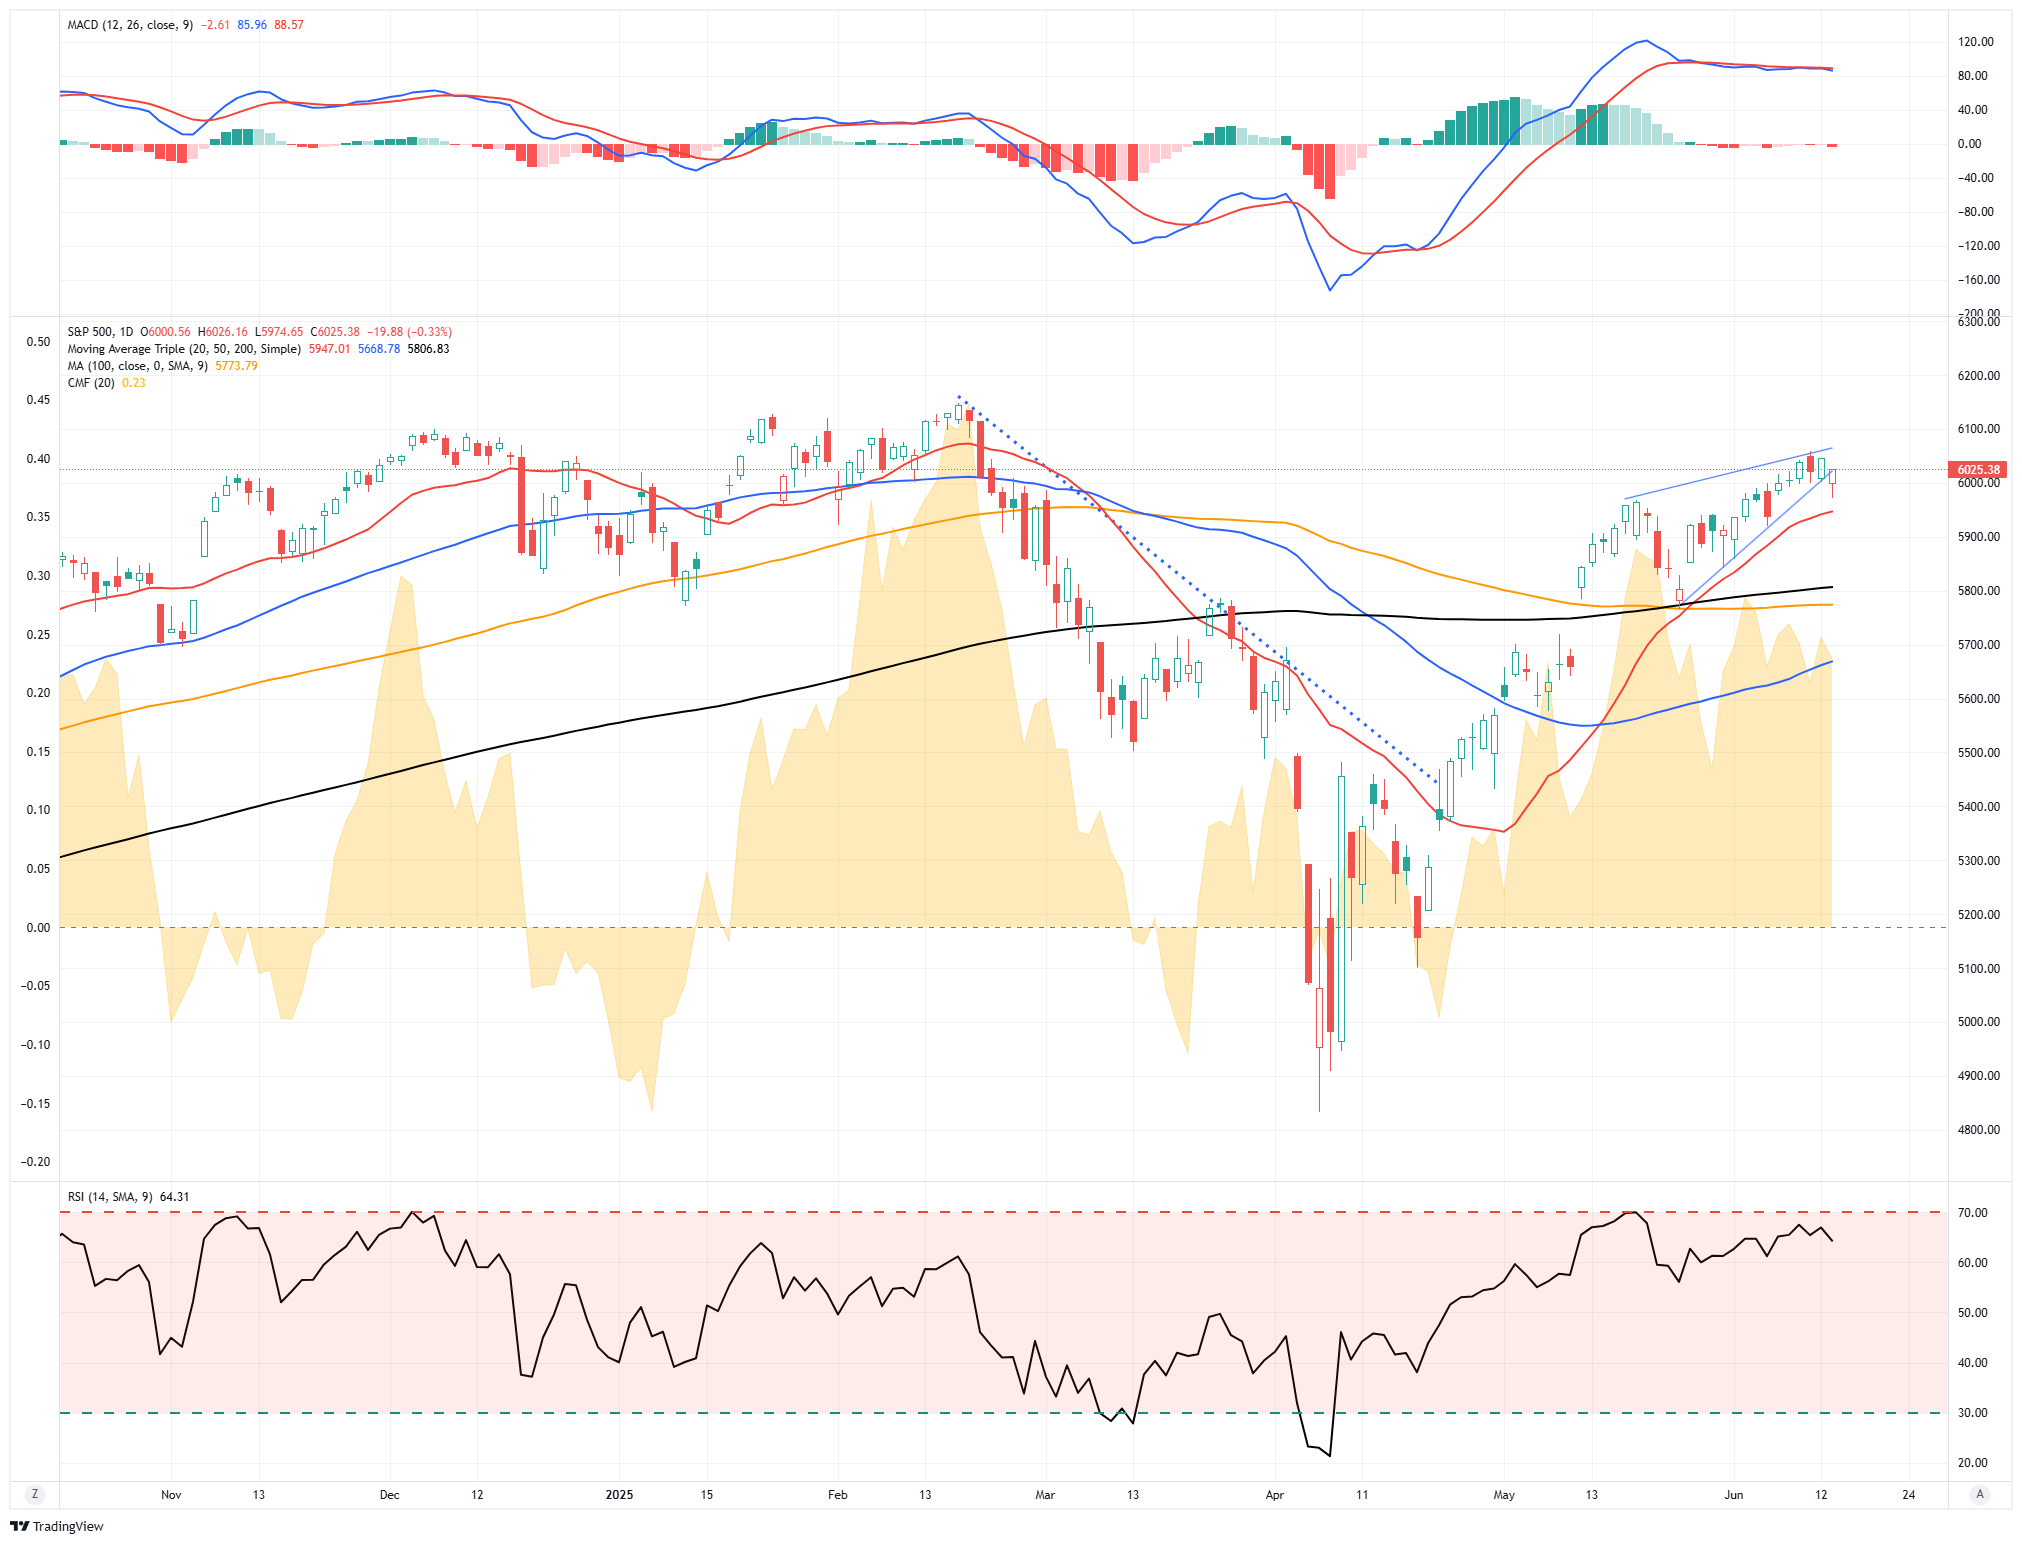
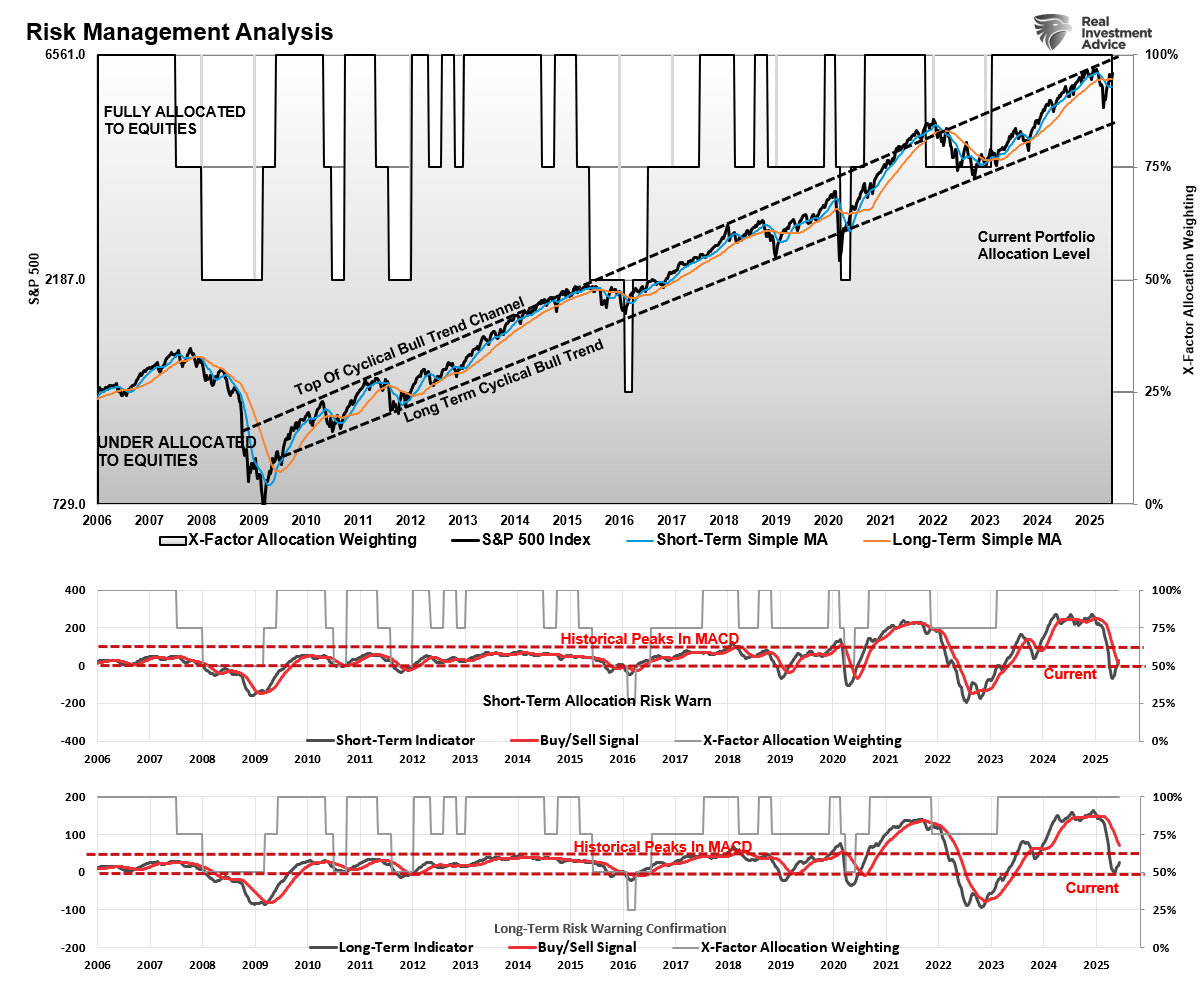
Furthermore, from a purely technical point of view, based on weekly price data, the March correction reversed much of the previous overbought conditions and bullish exuberance. By the end of the correction in early April, both relative strength (RSI) and momentum (MACD) had fully reversed. Furthermore, the deviations from long-term moving averages were also resolved. While the correction was painful, it reset the market for investors to re-enter at better prices.

With the momentum indicator triggering a “buy signal” and relative strength rising, the previous bull rally has resumed and likely has more room to run. Sentiment and technical gauges are “in the middle,” supporting further market gains.
Yet, while investors are worried about the next “shoe to drop,” professional investors are currently worrying about how to get capital invested.
Professionals Still Offside
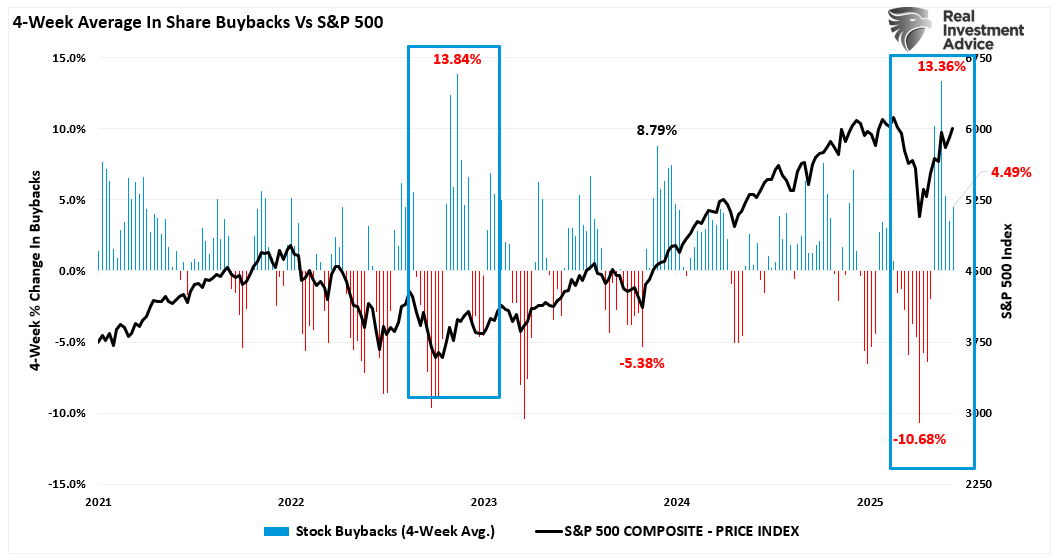
As we have noted previously, two of the biggest buyers in the market have been very supportive of the rally so far. After evaporating in March, heading into earnings season, corporate buying of shares surged in May, supporting the rally from the April lows.
As we discussed previously, retail investors were heavy buyers of equities in April and May, with equities pulling large inflows despite the selloff. Retail investors have also been piling into leveraged ETFs to chase market recovery.

However, while retail investors were jumping in with both feet, professional investors remained underweight and are now beginning to increase exposure as portfolio performance (aka career risk) begins to weigh on them. However, that equity exposure remains very low relative to historical norms, which suggests that buying could continue to support the current rally into July.

Notably, risk parity models remain grossly underweight equities. Risk parity portfolio models are an investment strategy that allocates risk equally across different asset classes, rather than allocating capital based on traditional metrics like market value or equal dollar amounts. The goal is to create a balanced portfolio where each asset contributes roughly the same amount of risk to the overall portfolio, regardless of its expected return or market size. While risk/parity models seek to avoid unbalanced risk exposure, they are currently on the “wrong side” of the equation, leading to underperformance risk. If this market continues to rally, we should expect to see these allocations rise, providing further support to the rally.

However, with the “herd” pushing markets higher, and now forcing professional investors to play “catch up,” this does not mean the markets won’t take a breather before continuing the bull rally. Risk appetite is approaching more elevated levels, historically arguing for a pause in the rally.

While there are certainly reasons to be concerned after a two-month 20% rally, the reality is that the bull market remains intact. The question for investors is how to trade it from here.
The Bull Rally May Pause, But Won’t End
As noted above, the bull rally remains intact, and as shown by the technical and sentiment gauges, we do not yet have the conditions for a “mean-reverting” event. As Nomura Securities recently penned, for such an event to occur, you first need:
1) Excess Length / Positioning / Leverage -accumulation;
2) Elements of “Speculative Froth” to develop in High Beta / High Vol market segments;
3) Steep Skew, where due to said “Extreme Positioning” and in High-Beta / Speculative sectors and assets, End-Users then NEED TO HEDGE their Downside risk, which in-turn means that Dealers would be put in a “Short Gamma / Short Vega” position into a Spot selloff, which creates “Accelerant Flow” to the DOWNSIDE
4) Typically from there, the Dealer “Accelerant flows” then knock-into Systematic Deleveraging from Vol-Scalers as additional source of synthetic “Negative Gamma” in the marketplace.
However, as shown in all the charts above, we are, to quote Nomura again, ” not there yet.”
Given the magnitude of the reversal in the technical and sentiment data, the current environment reminds us much more of late 2018 and early 2019. In 2918, you got very negative technical and sentiment readings before the Fed reversed course in December. That led to the rally off those lows into early 2019, which continued into the early summer before a sizeable reversal occurred. However, as shown, between now and then, there were “dips” that could be bought along the way.

We suspect it will be much the same this time until bullish sentiment and positioning become more extreme.
However, on a longer-term basis, the recent correction also provides sufficient runway for the bull market to continue well into next year. The current upper trend line suggests a new target for the S&P 500 of 6561 near term, and above 7000 by 2026. With the longer-term momentum indicators turning positive, the bullish backdrop for equities is improving.
Yes, many things could occur between now and then that could derail the markets. That is always the risk in investing. However, markets are always forward-looking and quickly factor in “known” risks like tariffs, the debt, and deficits.
The best course of action for investors is to continue managing risk and allocations. Economic data is improving, the risk of recession is non-existent, and sentiment is mainly neutral, which suggests that portfolios should be weighted towards equity risk until the data changes.
How We Are Trading It
Given the sharp decline and subsequent rally, the rise of voices expressing “disbelief” in the bull rally is unsurprising. However, a review of the technical backdrop suggests that current risk may be lower than many expect.
Do we know that with certainty? No. But that is why we continually reiterate the importance of paying attention to portfolios, managing risk, and holding more cash when uncertainty exists. As you can see in the portfolio model below, we are doing this.

Is that excess cash currently causing a performance drag? Yes. Do we like it? No. However, a temporary performance drag is worth the cost of allowing an entry into the market with fresh capital at a better risk/reward outcome.
That remains the case this week.
As investors, continue to focus on what matters to your investing outcomes.
- Avoid the “herd mentality” of paying increasingly higher prices without sound reasoning.
- Do your research and avoid “confirmation bias.”
- Develop a sound long-term investment strategy that includes “risk management” protocols.
- Diversify your portfolio allocation model to include “safer assets.”
- Control your “greed” and resist the temptation to “get rich quick” in speculative investments.
- Resist getting caught up in “what could have been” or “anchoring” to a past value. Such leads to emotional mistakes.
- Realize that price inflation does not last forever. The larger the deviation from the mean, the greater the eventual reversion. Invest accordingly.
We will use any summer weakness to buy quality companies on dips. Furthermore, we will watch the Federal Reserve closely for clues to monetary policy changes as the economy slows.
Continue to follow the rules and stick to your discipline. (Read our article on “What Is Risk” for a complete list of rules)
Feel free to reach out if you want to navigate these uncertain waters with expert guidance. Our team specializes in helping clients make informed decisions in today’s volatile markets.
Research Report

Subscribe To “Before The Bell” For Daily Trading Updates
We have set up a separate channel JUST for our short daily market updates. Please subscribe to THIS CHANNEL to receive daily notifications before the market opens.
Click Here And Then Click The SUBSCRIBE Button
Subscribe To Our YouTube Channel To Get Notified Of All Our Videos
Bull Bear Report Market Statistics & Screens

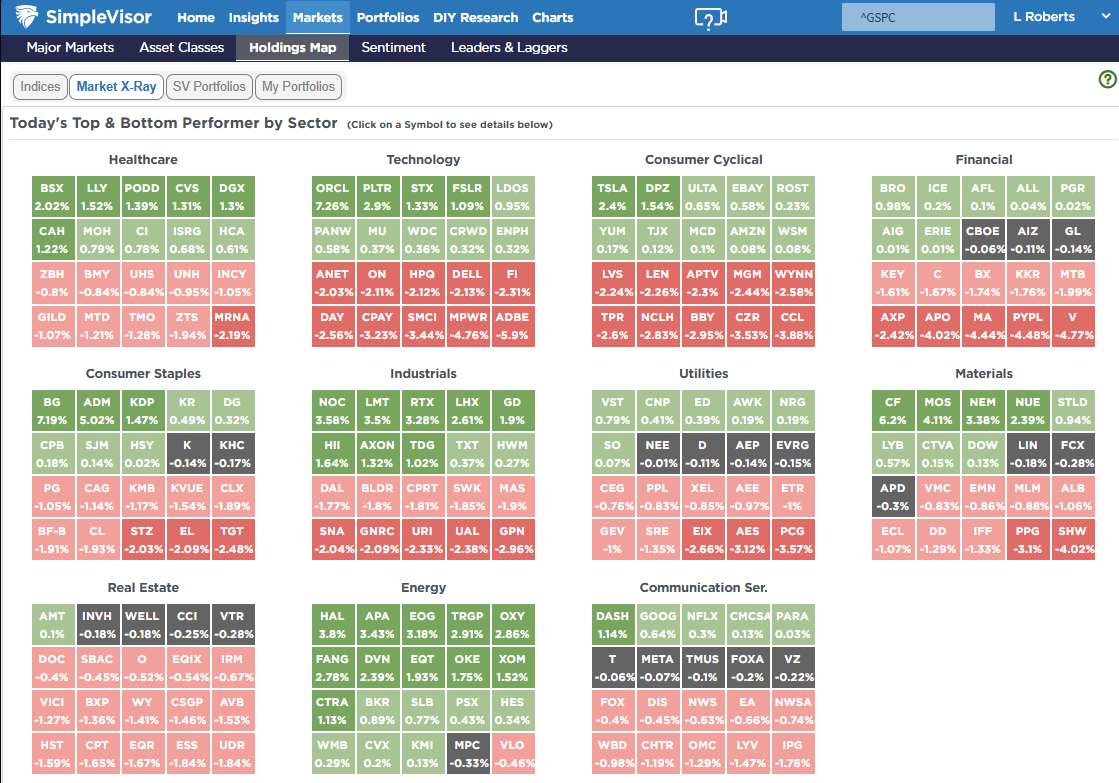
SimpleVisor Top & Bottom Performers By Sector
S&P 500 Weekly Tear Sheet

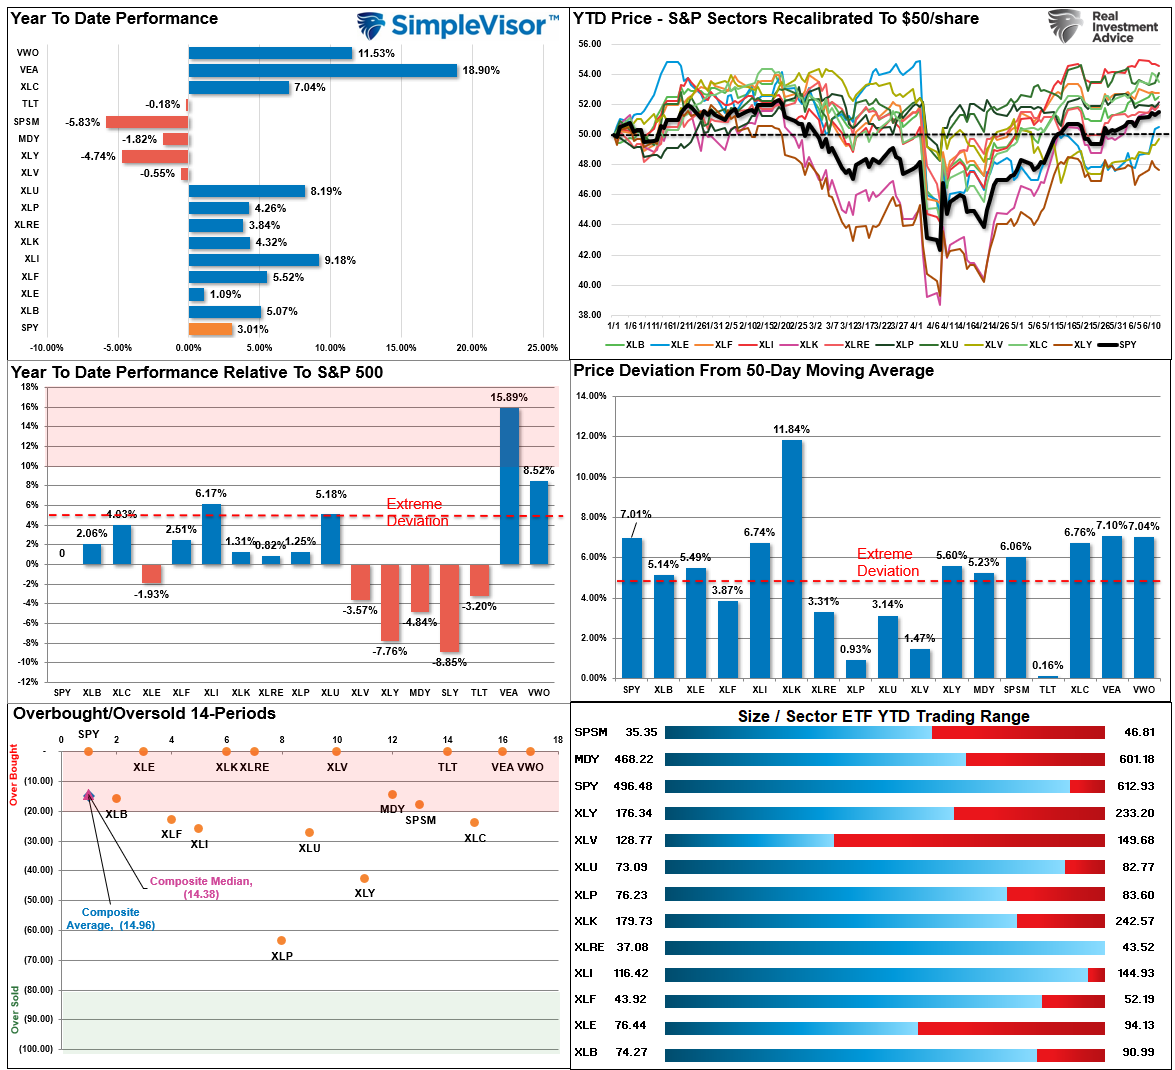
Relative Performance Analysis
The market continued its bullish way this past week, and many sectors and markets remain very overbought. The market will likely correct or consolidate this summer, and as such, investors should consider taking profits and rebalancing allocations back toward domestic equities. The most overcrowded trade currently is the “short dollar” trade, which, when it reverses, will provide a tailwind to domestic equities. However, for now, dollar weakness means investors should remain cautious and wait for a better entry opportunity.
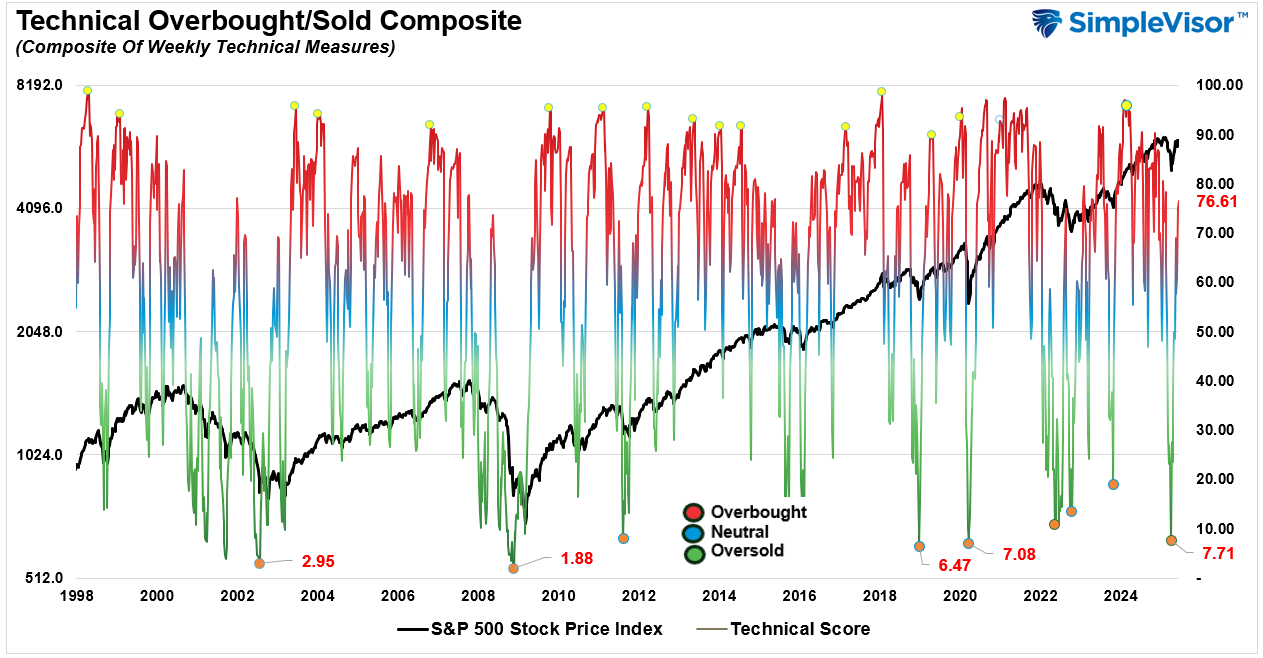
Technical Composite
The technical overbought/sold gauge comprises several price indicators (R.S.I., Williams %R, etc.), measured using “weekly” closing price data. Readings above “80” are considered overbought, and below “20” are oversold. The market peaks when those readings are 80 or above, suggesting prudent profit-taking and risk management. The best buying opportunities exist when those readings are 20 or below.
The current reading is 76.61 out of a possible 100.
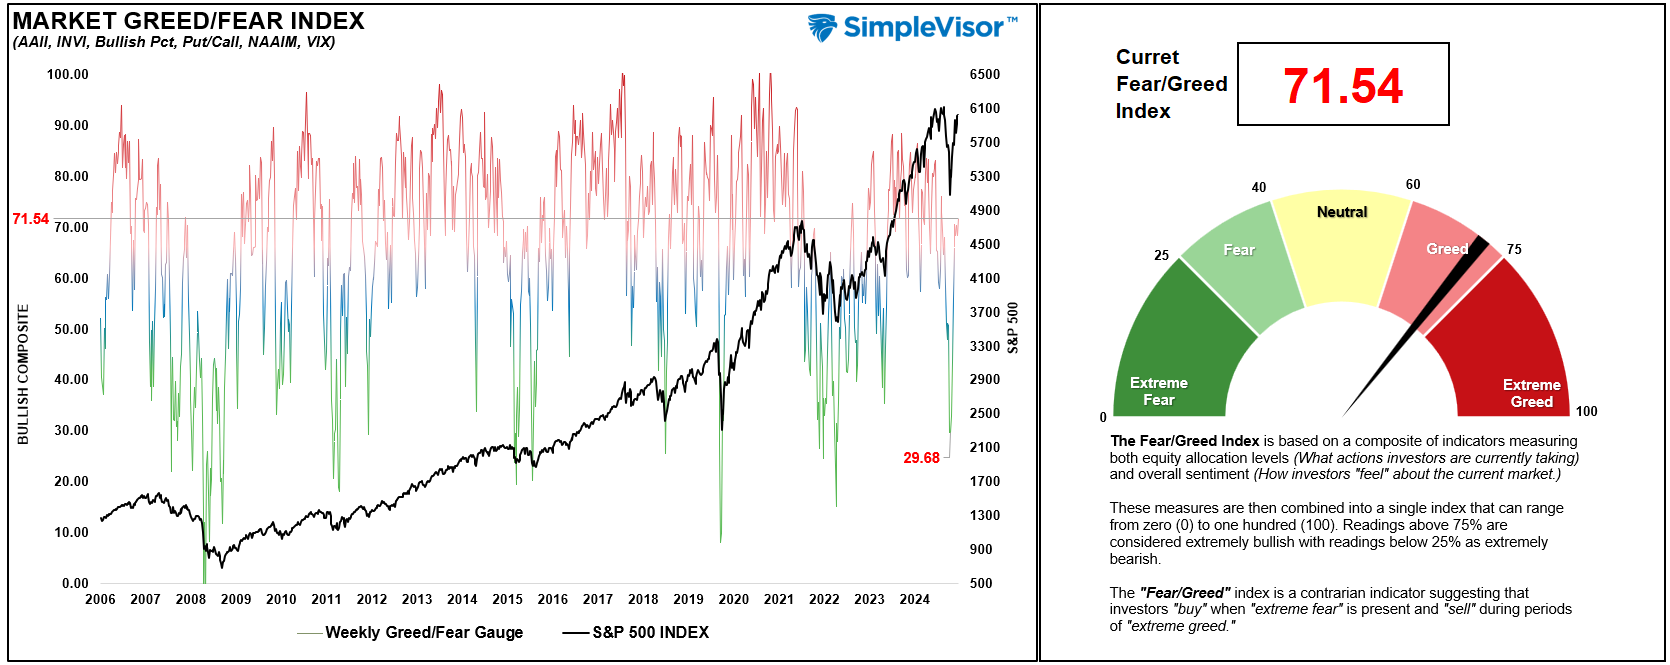
Portfolio Positioning “Fear / Greed” Gauge
The “Fear/Greed” gauge is how individual and professional investors are “positioning” themselves in the market based on their equity exposure. From a contrarian position, the higher the allocation to equities, the more likely the market is to be closer to a correction than not. The gauge uses weekly closing data.
NOTE: The Fear/Greed Index measures risk from 0 to 100. It is a rarity that it reaches levels above 90.
The current reading is 71.54 out of a possible 100.
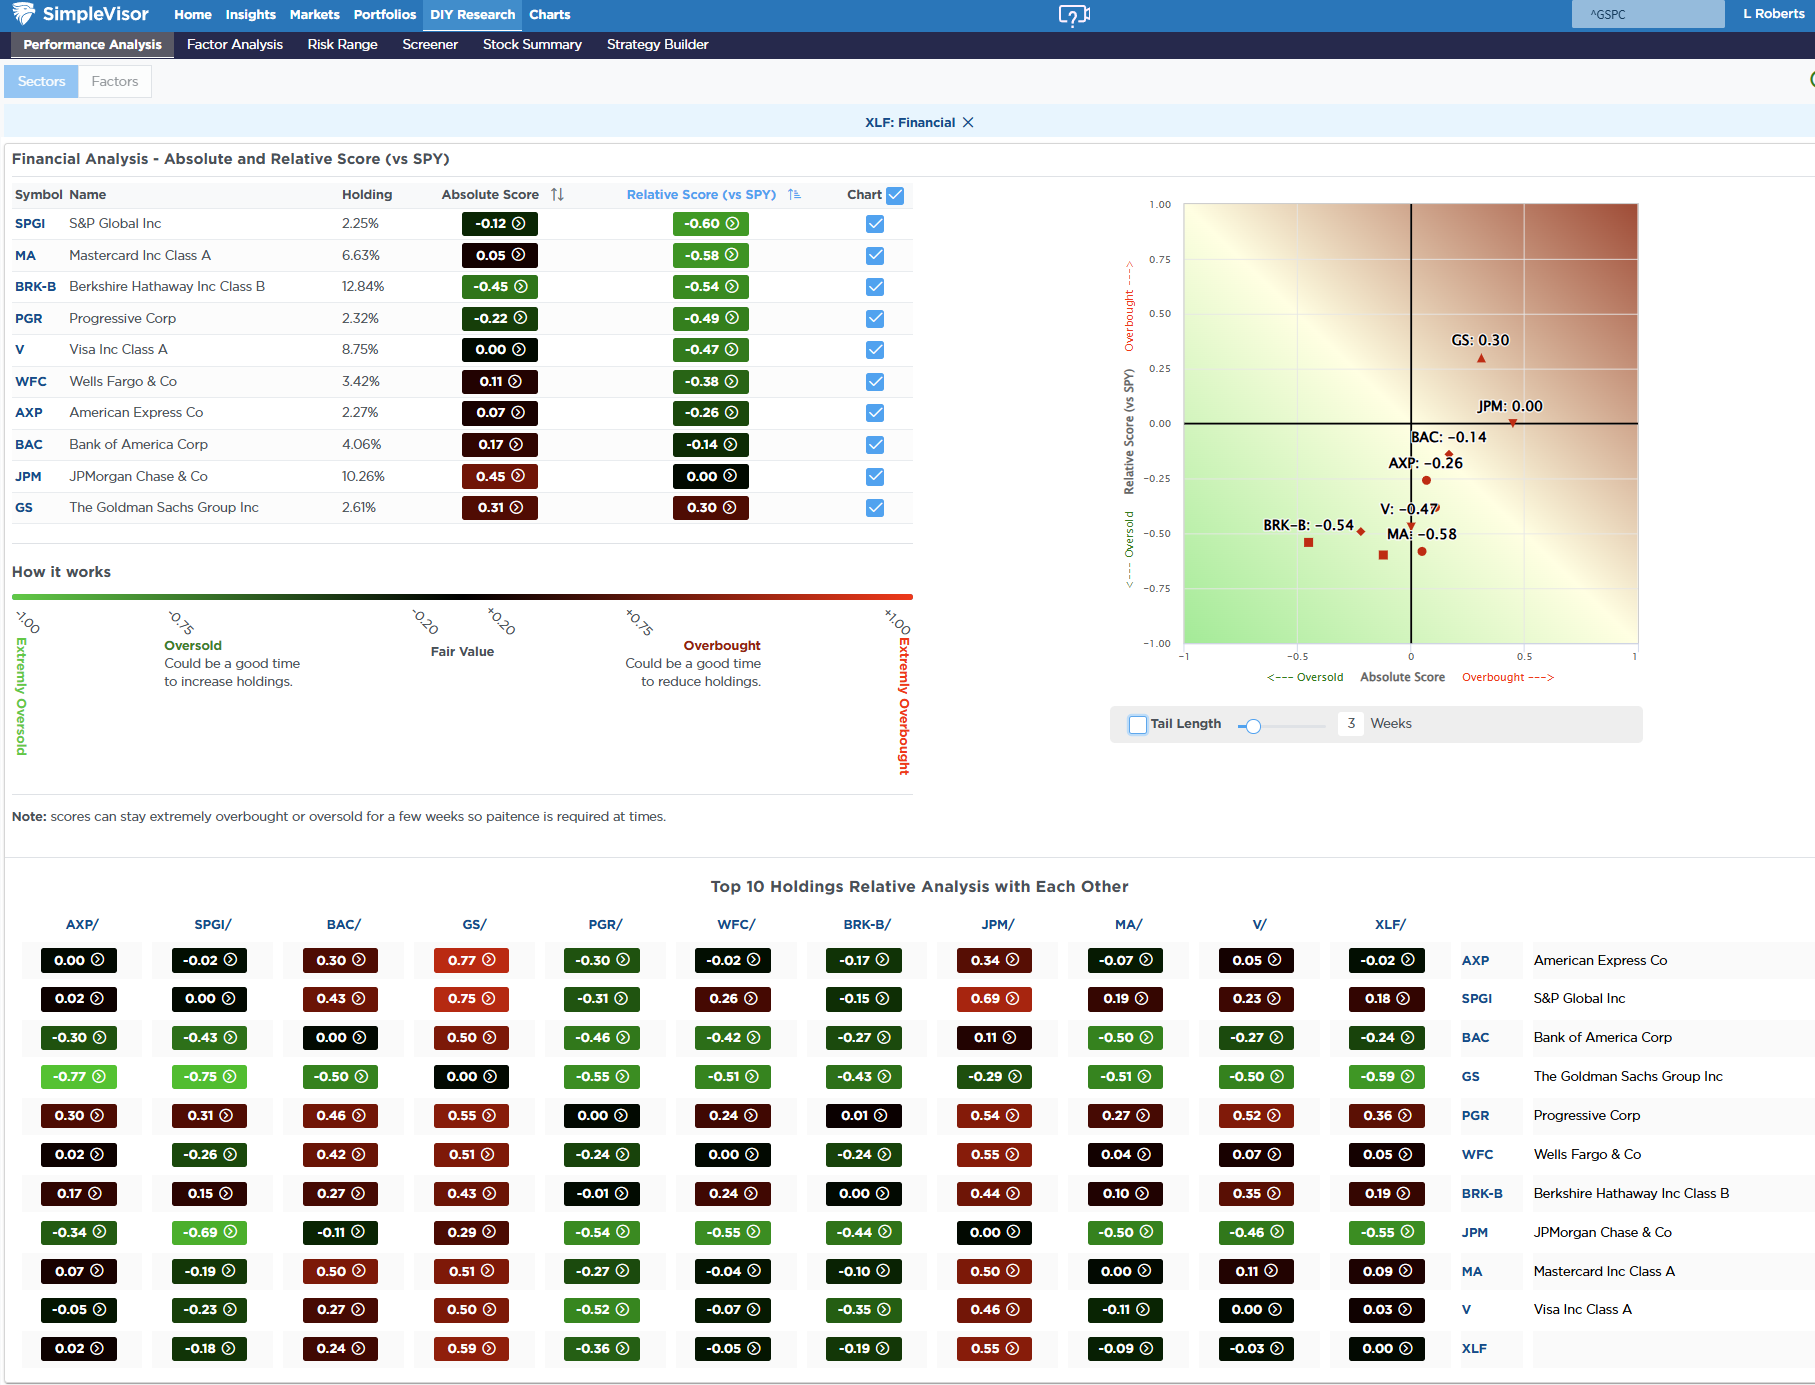
Relative Sector Analysis

Most Oversold Sector Analysis
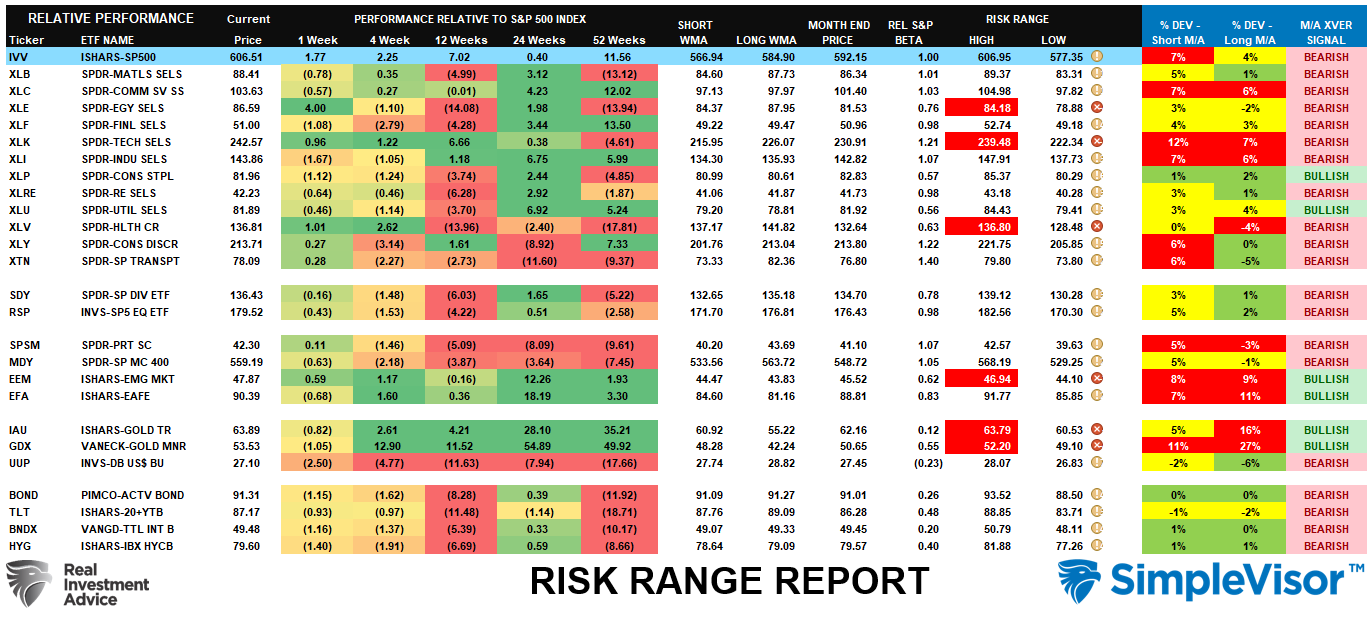
Sector Model Analysis & Risk Ranges
How To Read This Table
- The table compares the relative performance of each sector and market to the S&P 500 index.
- “MA XVER” (Moving Average Crossover) is determined by the short-term weekly moving average crossing positively or negatively with the long-term weekly moving average.
- The risk range is a function of the month-end closing price and the “beta” of the sector or market. (Ranges reset on the 1st of each month)
- The table shows the price deviation above and below the weekly moving averages.
While the market broke out of its consolidation range this past week, many sectors remain above normal risk ranges. Particularly, Energy, Technology, and Healthcare, which were previously laggards. You should review the relative analysis table above, which shows which sectors are lagging or leading the broader market. With regularity, previous laggards become leaders and vice versa. We remain concerned about most markets and sectors being on bearish weekly signals. While there seems to be minimal risk to the market, historically, the large number of bearish crossovers suggests that risk is not absent. Continue to trade cautiously and hold higher-than-normal levels of cash.
Weekly SimpleVisor Stock Screens
We provide three stock screens each week from SimpleVisor.
This week, we are searching for the Top 20:
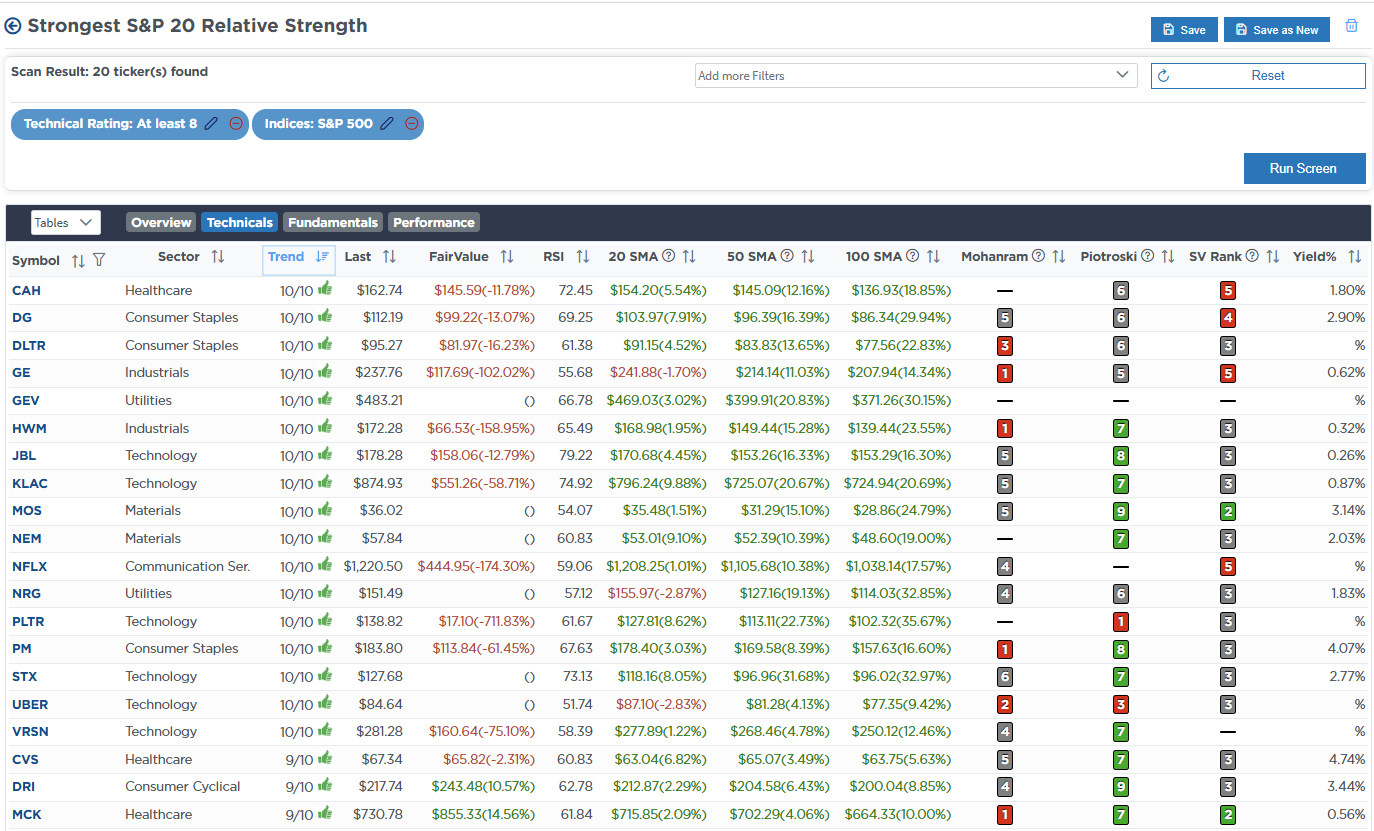
- Relative Strength Stocks
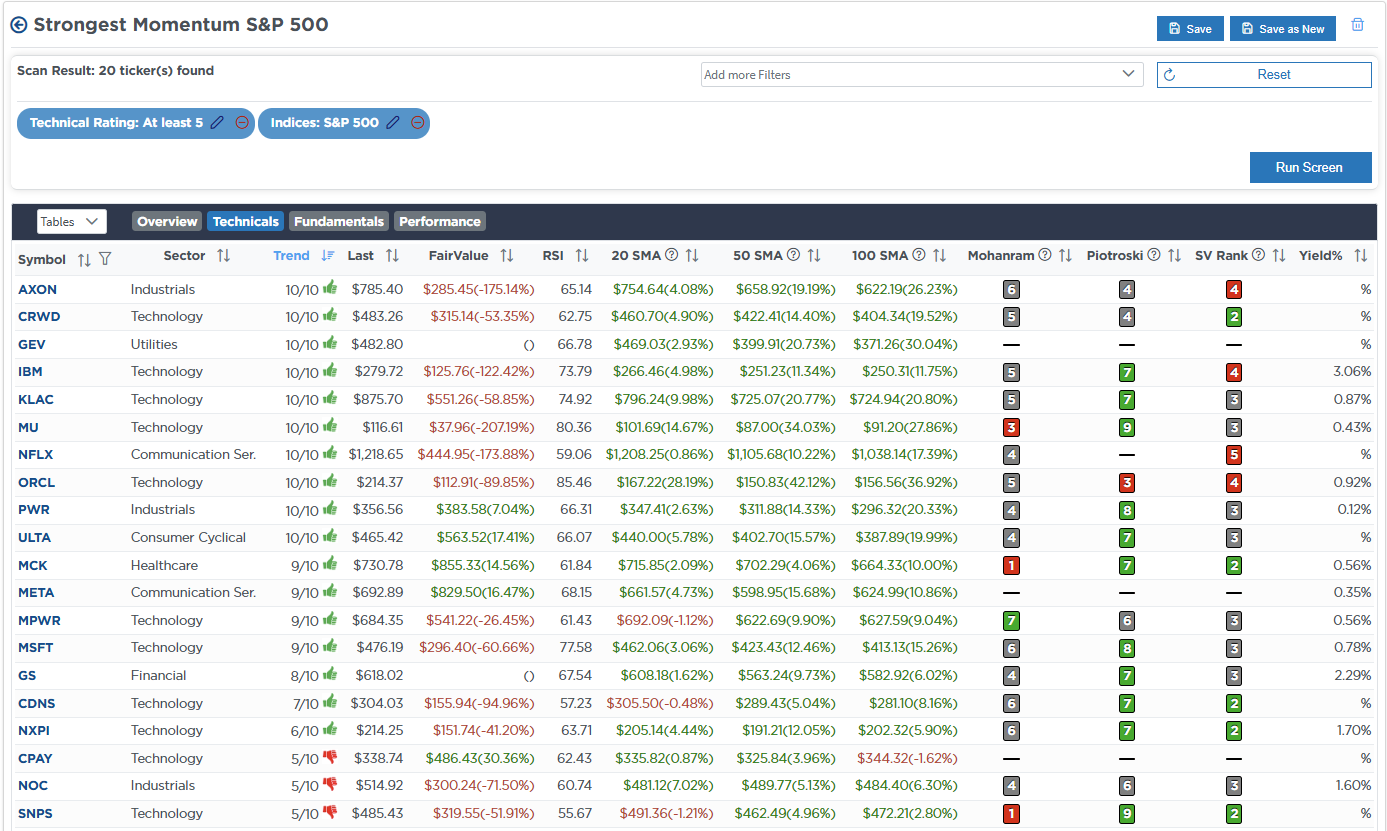
- Momentum Stocks
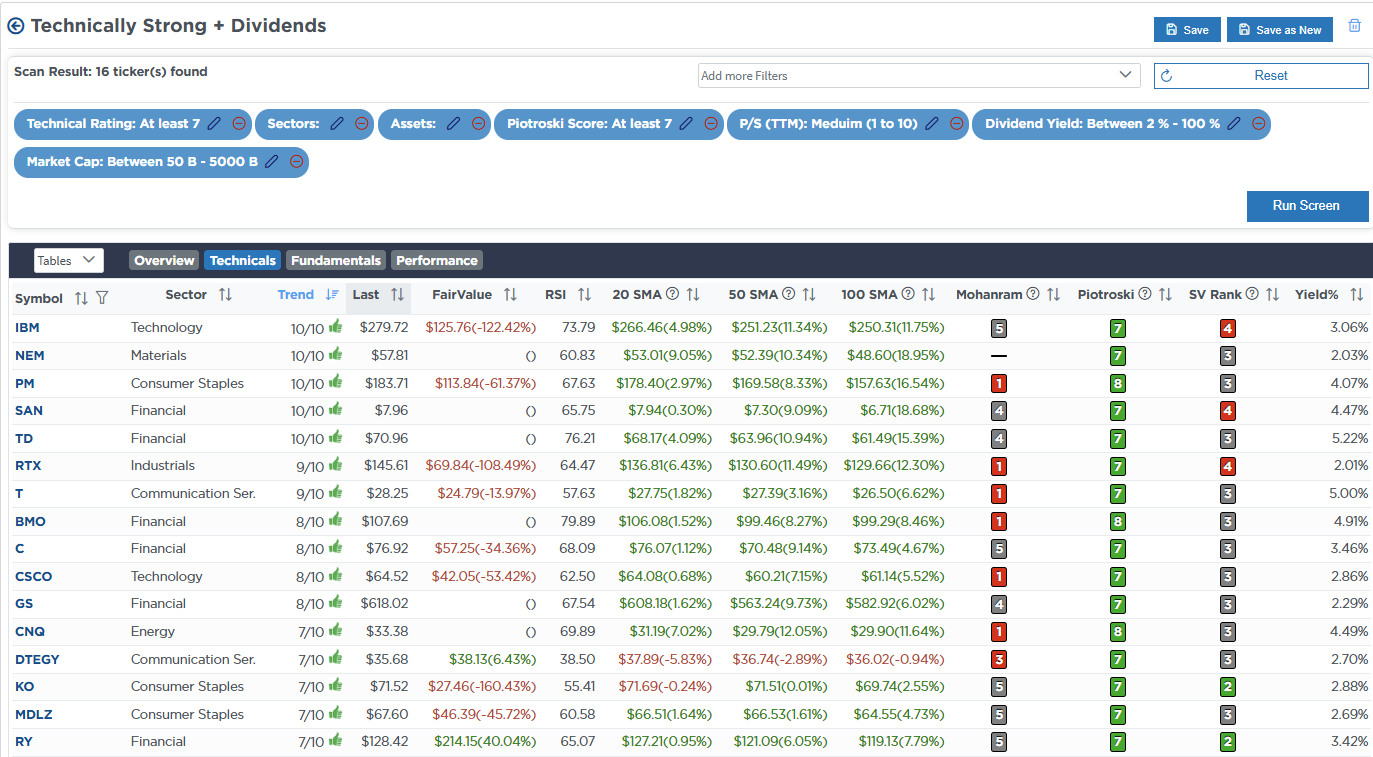
- Technical Strength W/ Dividends
(Click Images To Enlarge)
RSI Screen
Momentum Screen
Technically Strong With Dividends
SimpleVisor Portfolio Changes
We post all of our portfolio changes as they occur at SimpleVisor:
No Trades This Week
Lance Roberts, C.I.O., RIA Advisors

