
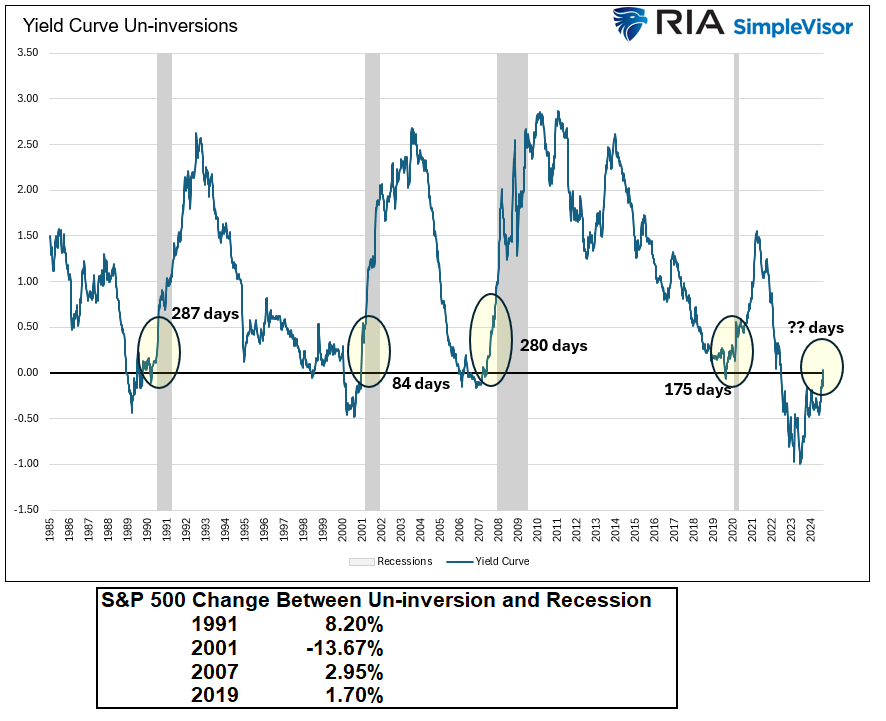
“The level of U.S. Treasury yields and the changing shape of the Treasury yield curve provide investors with critical feedback regarding the market’s expectations for economic growth, inflation, and monetary policy.” That sentence led off our article last week: Yield Curve Shifts Offer Signals For Stockholders. The Treasury yield curve has proven an accurate predictor of economic weakness and, ultimately, recessions. As fall is starting to show signs of emerging, the yield curve also warns of a new economic season. On Monday night, the 2-year note yield fell slightly below the 10-year yield. Thus, the yield curve inversion, which has lasted over two years, is over, ending one of the longest yield curve inversions on record.
The graph below charts the difference between ten and two-year Treasury yields, commonly called the yield curve. The shaded circles highlight the last four times the yield curve inverted and uninverted. Each time the yield curve inverted and uninverted, a recession followed. Next to the shaded circles, you will find the number of days between the uninversion and the start of the recession as deemed by the NBER. Bear in mind they always call the recession well after each recession started and backdate it.
If, and we stress “if,” the economy is heading for a recession and the S&P 500 is ultimately setting up for a drawdown as is typical in a recession, we best appreciate this warning. However, we have time to prepare. The table below shows that the stock market doesn’t always heed the yield curve warning mainly because the economic data at the time of the uninversion did not give the impression that a recession was imminent.
What To Watch Today
Earnings

Economy

Market Trading Update
In yesterday’s commentary, we discussed the market’s negative divergences and slowing momentum. As we stated:
“While markets can make all-time highs soon, the momentum and relative strength decline is certainly a cautionary tale. Just as a reminder, September and October tend to be weak performance months for the market, and the addition of a leadership or policy change could add to that risk.”
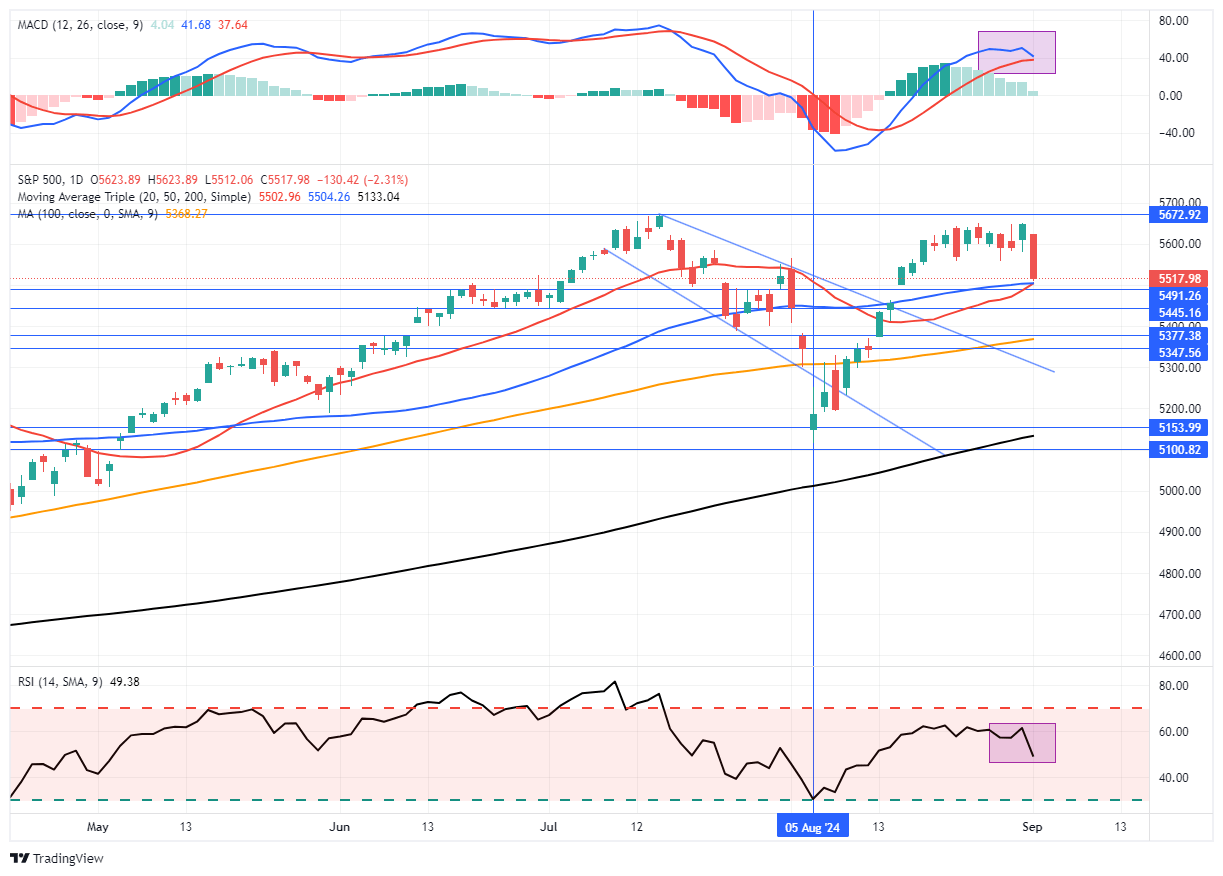
While we suspected a decline was likely, we didn’t expect it to occur in just one day. There are a couple of important points to yesterday’s action. First, the sell-off yesterday broke through the bottom of the recent trading range after failing resistance at all-time highs. Secondly, the reversal brought the market very close to triggering a “sell signal,” which would likely lead to lower prices over the coming days.
The good news is that the 20 and 50-DMA have converged to provide a significant level of price support for the market. Theoretically, the market should hold this level and bounce toward the bottom of the previous trading range. A failure of that support will lead to lower prices, but there are several support levels below yesterday’s close down to the 100-DMA. Unless something is brewing behind the scenes, the market should remain above the recent downtrend channel. Of course, there is always a risk that doesn’t occur, and the 200-DMA becomes a viable target.
As noted yesterday, investors got a decent reminder of the consequences of their complacency. We suggest managing risk until a better entry point presents itself. Today is not that point.

ISM Manufacturing
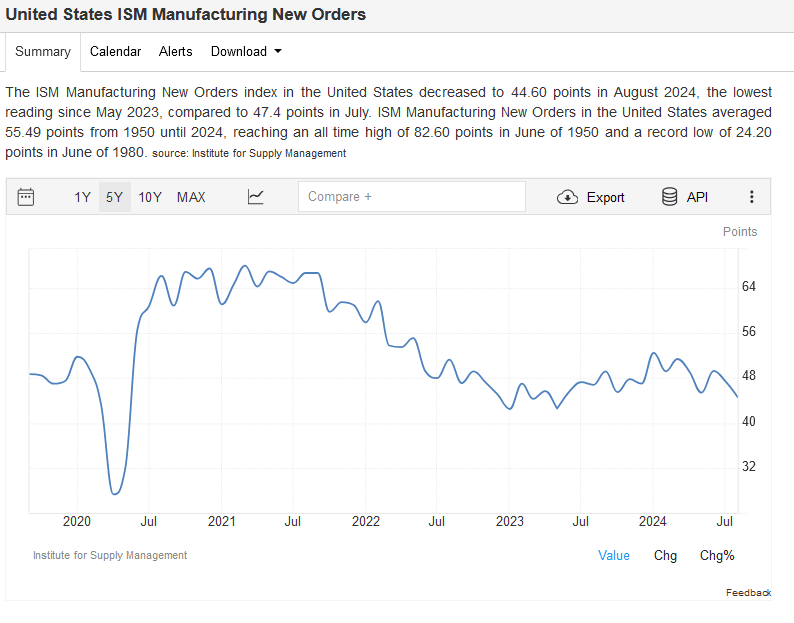
The ISM Manufacturing Index was a little weaker than expected, at 47.2, compared to expectations of 47.5. However, it was better than last month’s 46.8. Manufacturing Employment is still contracting at 46.0, but the latest is slightly better than last month’s 43.4. Of concern for the Fed, the price index rose to 54.0. The price index was below 50 from September 2022 through December 2023. This year, each monthly reading was above 50. It will be more critical to the Fed if tomorrow’s Services Price Index is higher than expected.
The graph below shows the ISM New Orders Index. This past month, it fell to 44.6, well below the previous reading of 47.4 and the optimistic consensus of 47.7. This index tends to be a good leading indicator for the manufacturing sector. Yields fell sharply on the release as it further cemented the market thinking that the Fed could cut rates by 50bps at the next meeting. The odds of a 50bps decrease are now up to 40%.
Risks Facing Bullish Investors
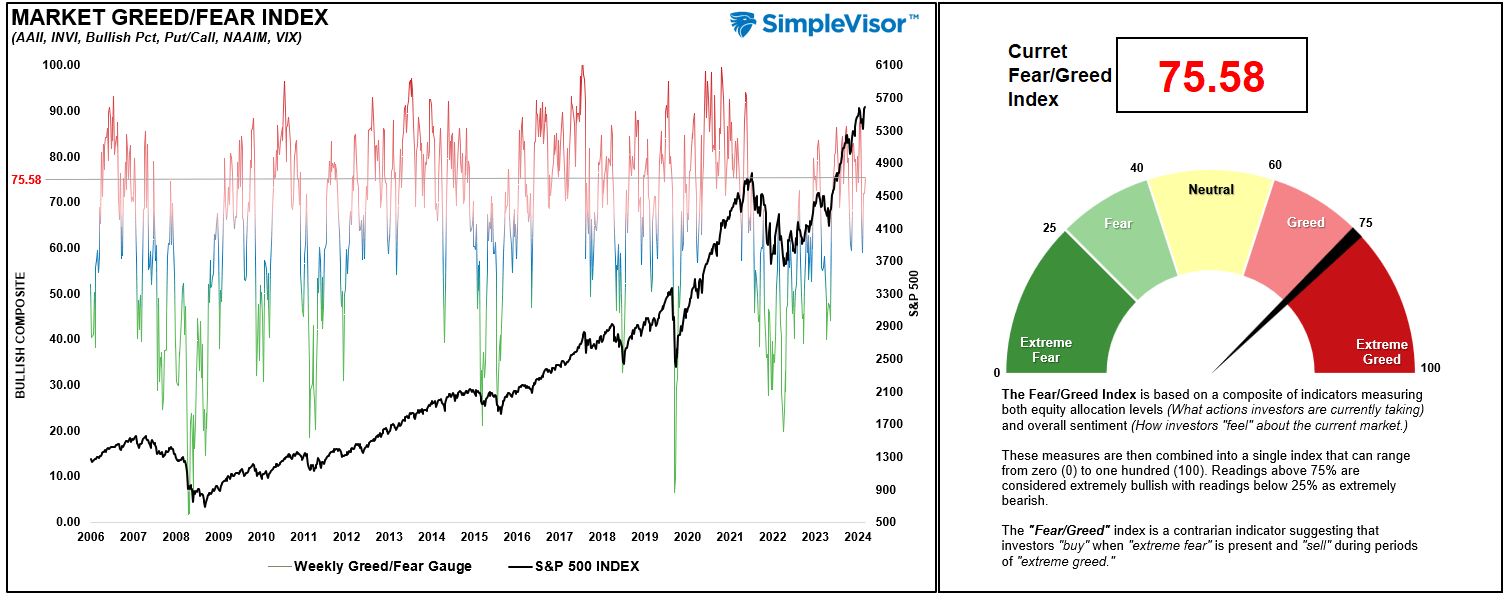
Since the end of the “Yen Carry Trade” correction in August, bullish positioning has returned with a vengeance, yet two key risks face investors as September begins. While bullish positioning and optimism are ingredients for a rising market, there is more to this story.
It is true that “a rising tide lifts all boats,” meaning that as the market rises, investors begin to chase higher stock prices, leading to a virtual buying spiral. Such leads to an improvement in market breadth and participation, which supports further price increases. Following the August decline, the chart below shows the improvement in the NYSE advance-decline line and the number of stocks trading above their respective 50-day moving averages (DMA).
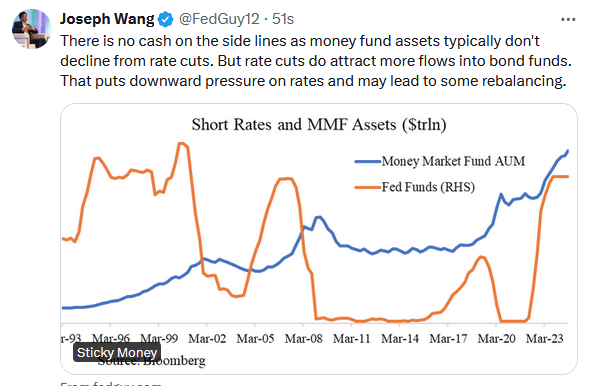
Tweet of the Day
“Want to achieve better long-term success in managing your portfolio? Here are our 15-trading rules for managing market risks.”
Please subscribe to the daily commentary to receive these updates every morning before the opening bell.
If you found this blog useful, please send it to someone else, share it on social media, or contact us to set up a meeting.

