
A reader asked us how concerned we are about the market’s extension from crucial moving averages. The short answer is we are. But that doesn’t mean we are moving our equity holdings to cash. We continue to hold our equity positions for two reasons but we remain vigilant.
First, the S&P 500 is doing great, but only because of a small handful of the largest-cap stocks. This imbalance is getting extreme. However, the condition doesn’t require a sharp downturn to correct itself. Simply, the other 480 or so stocks that have been underperforming can outperform without the market declining.
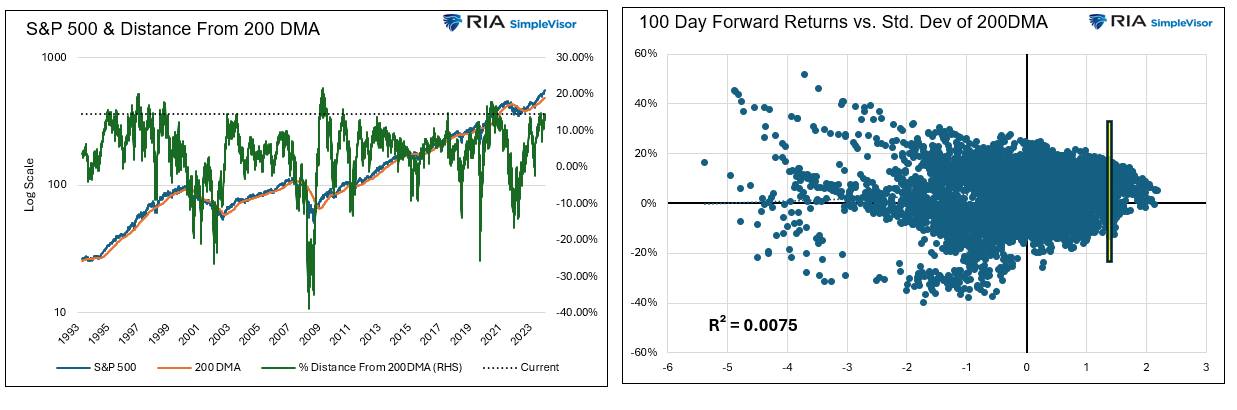
Secondly, similar historical deviations from important moving averages offer no conclusive evidence of an imminent downturn. The graph on the left shows the S&P 500 and its 200dma. The green line is the percentage market deviation from the 200dma. As the dotted line shows, the current instance is somewhat extreme but can remain so for a while. The scatter plot on the right compares the standard deviation of the market divergence from the 200 DMA with forward 100-day returns. The yellow bar is where the market currently is. Again, based on prior instances, an impending downturn is not a foregone conclusion. Furthermore, the R2 shows there is no correlation between the two factors.
The bottom line: watch for technical signs the market is breaking down but appreciate this current condition can continue.
What To Watch Today
Earnings
Economy
Market Trading Update

FOMC Minutes
Last Wednesday, after the market closed early for the July 4th holiday, the Fed released its minutes from the mid-June meeting. The minutes were generally dovish. In particular, the Fed seems to be getting more comfortable with continued disinflation. Per the minutes:
“Participants highlighted a variety of factors that were likely to help contribute to continued disinflation in the period ahead. The factors included continued easing of demand–supply pressures in product and labor markets, lagged effects on wages and prices of past monetary policy tightening, the delayed response of measured shelter prices to rental market developments, or the prospect of additional supply-side improvements. The latter prospect included the possibility of a boost to productivity associated with businesses’ deployment of artificial intelligence–related technology.”
Nevertheless, participants suggested that a number of developments in the product and labor markets supported their judgment that price pressures were diminishing. In particular, a few participants emphasized that nominal wage growth, though still above rates consistent with price stability, had declined, notably in labor-intensive sectors. A few participants also noted reports that various retailers had cut prices and offered discounts. Participants further indicated that business contacts reported that their pricing power had declined. Participants suggested that evidence of firms’ reduced pricing power reflected increased customer resistance to price increases, slower growth in economic activity, and a reassessment by businesses of prospective economic conditions.
Their disinflationary views are supported by their opinions on the labor market, which they believe has primarily normalized.
Several participants also suggested that the establishment survey may have overstated actual job gains. Several participants remarked that a variety of indicators, including wage gains for job switchers, suggested that nominal wage growth was slowing, consistent with easing labor market pressures. A number of participants noted that, although the labor market remained strong, the ratio of vacancies to unemployment had returned to pre-pandemic levels and there was some risk that further cooling in labor market conditions could be associated with an increased pace of layoffs. Some participants observed that, with the risks to the Committee’s dual-mandate goals having now come into better balance, labor market conditions would need careful monitoring.
Tesla Powers Consumer Discretionary Stocks
Last week, Tesla was up over 25%, leading the market higher and contributing to the gross outperformance of the consumer discretionary sector (XLY). Tesla accounts for roughly 2% of the S&P 500. Thus, last week’s gain contributed to over a third of the market’s 1.4% increase. Tesla also contributes about 30% to XLY. XLY was up about 3% last week. Tesla added over 6%; therefore, the sector would have been down by approximately 3% without Tesla.
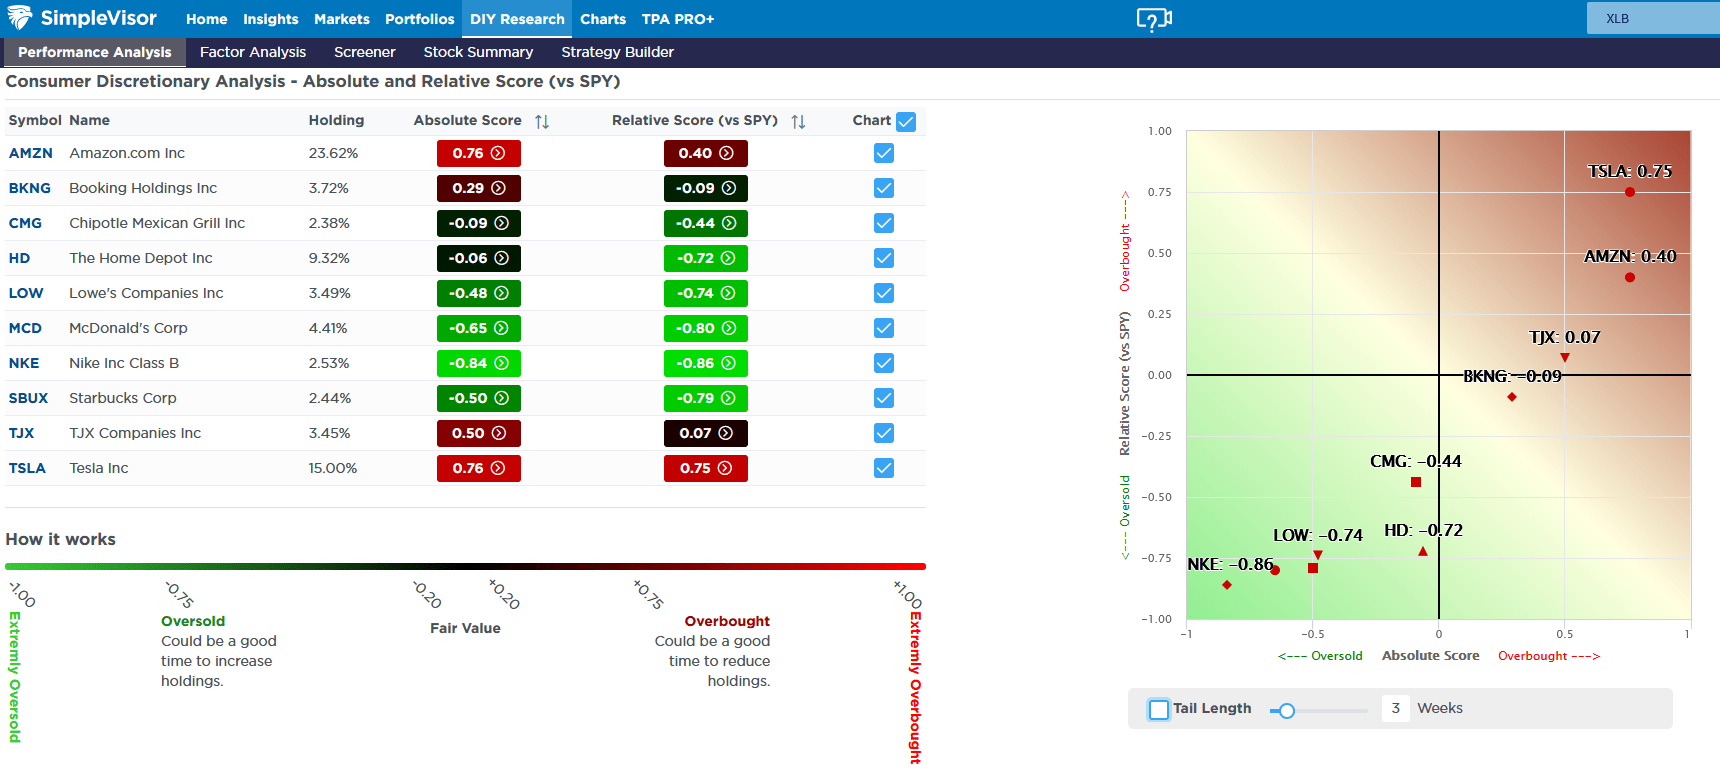
Tesla and Amazon are overbought compared to the market, while most consumer discretionary stocks are grossly oversold (bright green). The first graphic below, courtesy of SimpleVisor, shows that most discretionary stocks are grossly oversold. This is another example of the extreme performance bifurcation we are witnessing. The five-day heat map also shows the massive performance divergence. Note how many of the largest stocks by market cap had great five-day performances. However, the large majority of stocks were lower on the week.

Tweet of the Day

“Want to achieve better long-term success in managing your portfolio? Here are our 15-trading rules for managing market risks.”
Please subscribe to the daily commentary to receive these updates every morning before the opening bell.
If you found this blog useful, please send it to someone else, share it on social media, or contact us to set up a meeting.

