
Jerome Powell and his colleagues endlessly reassert their “higher for longer” plan for interest rates. They aim to weaken economic growth, bringing inflation back to pre-pandemic levels. The Fed has little choice because the government can’t afford the Fed’s higher-for-longer stance for much longer!
In the past few months, we have written many blog posts and daily commentaries touting bonds, including last week’s article, Our Elevator Pitch for Bonds. The article succinctly sums up our case as “this time won’t be different.” The pandemic-related factors that drove inflation and interest rates higher are one-time in nature. We believe 40-year economic trends will reassert themselves, pushing yields much lower.
A reader countered, “Astronomical future government deficits and the debt required to fund them may be the fly in your ointment.”
Our reply: we agree government deficit spending and, therefore, debt will only become more significant. For that very reason, the Fed and government can ill afford to maintain today’s interest rates. Fiscal spending projections only raise our conviction on the value of owning bonds at today’s relatively high yields.
If you disagree with our economic rationale for lower rates, this analysis may persuade you that the Fed and government don’t have any options but lower interest rates.
Key Takeaways
- Low-interest rates allowed federal outstanding debt to rise much more than tax revenues and GDP without creating problems.
- Higher interest rates threaten the Federal debt scheme.
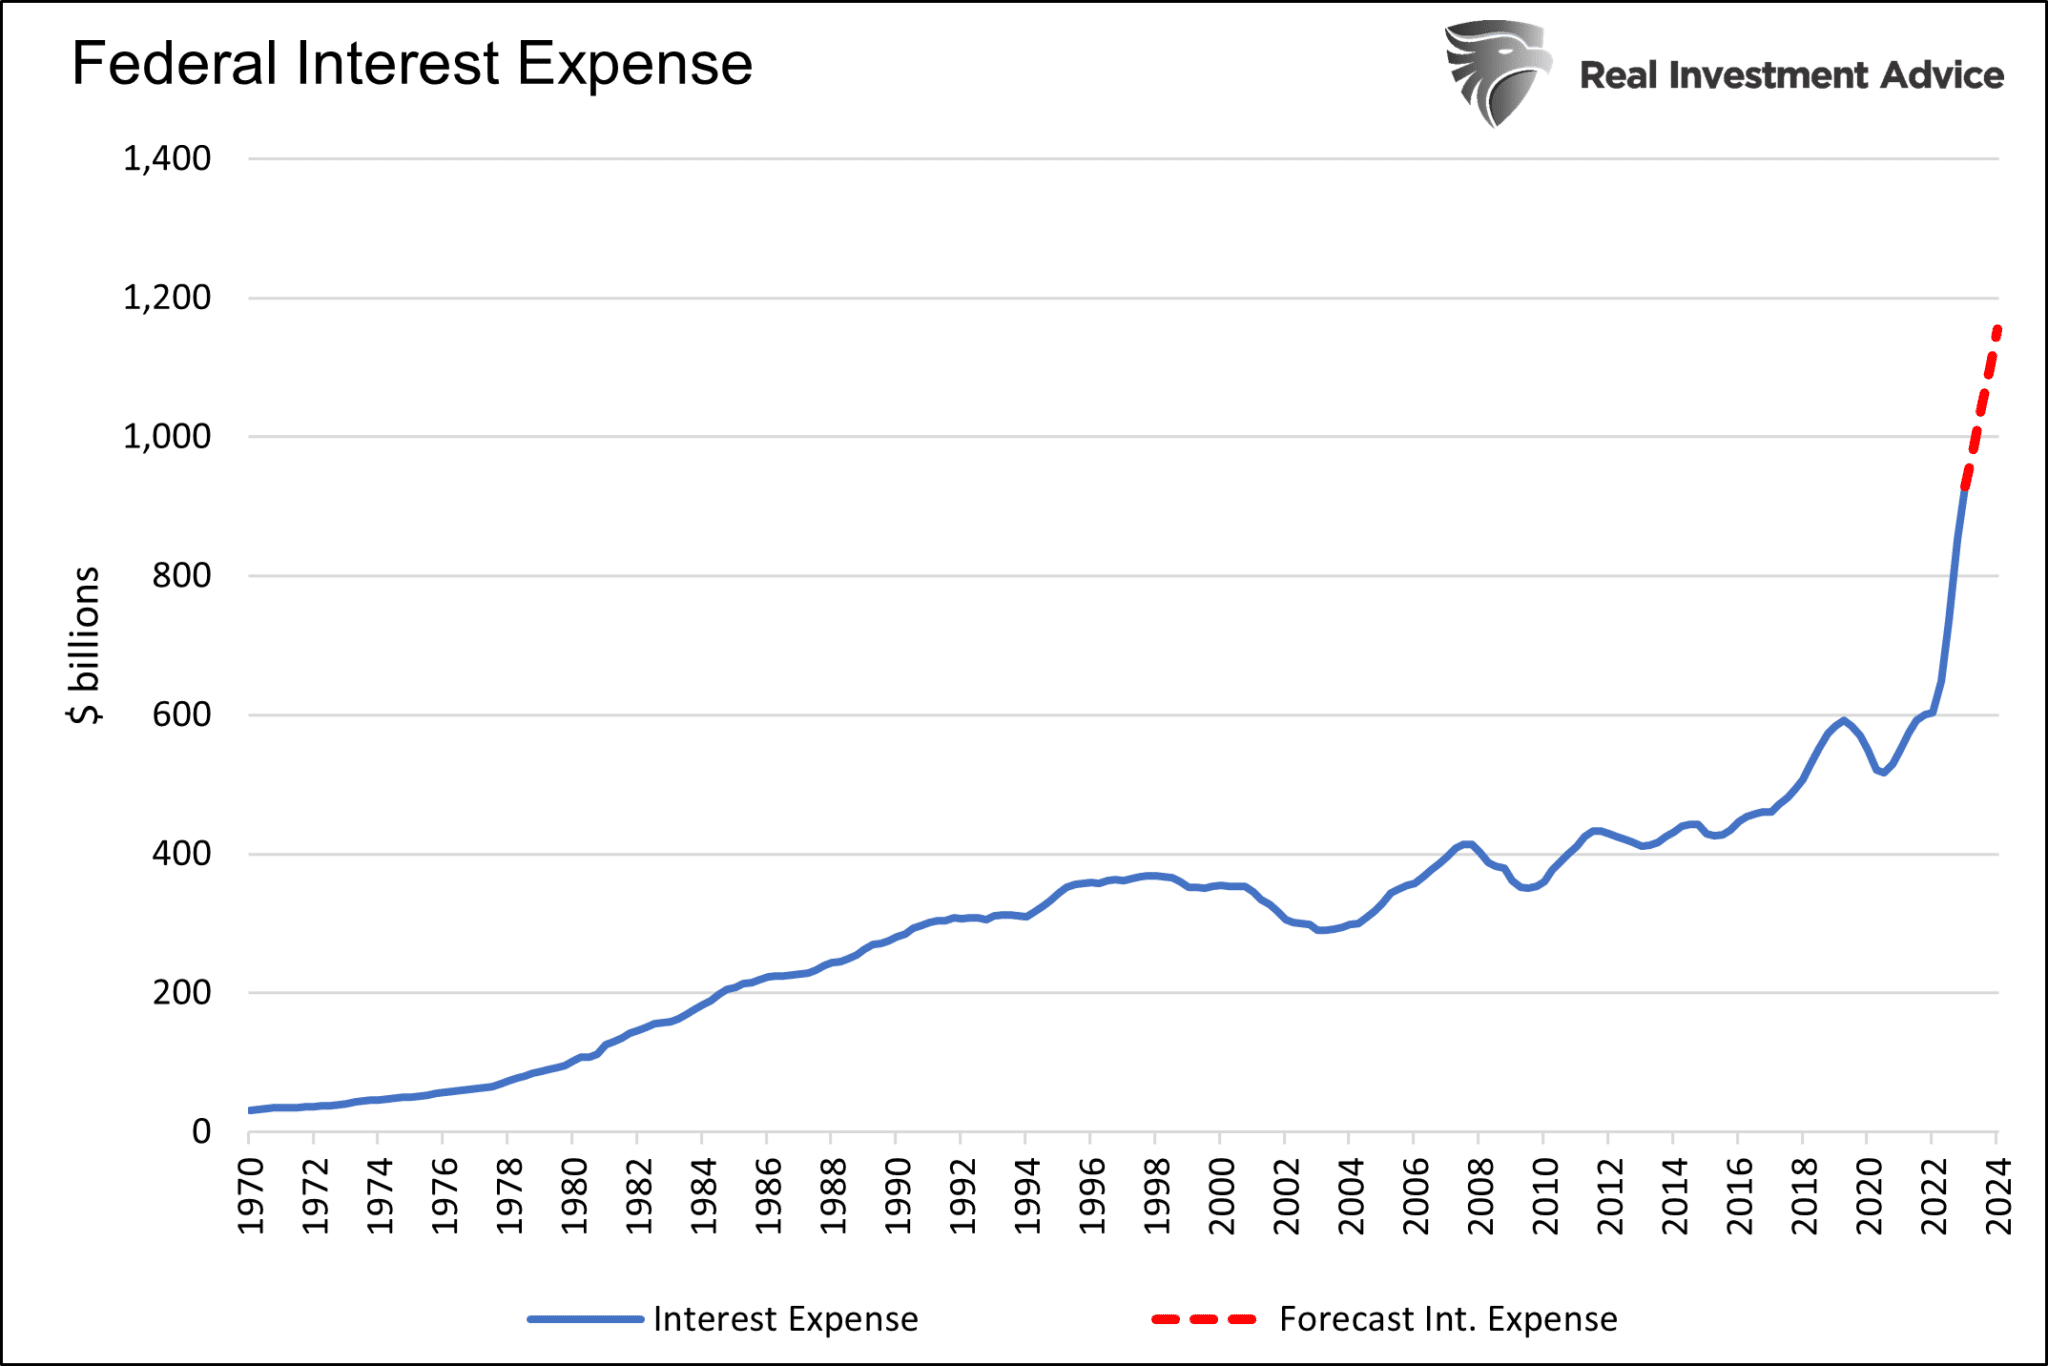
- Interest expenses will rise by over $200 billion within a year if interest rates stay at current levels.

The Debt Scheme
Since 1970, federal debt outstanding has risen from $370 billion to $31 trillion. Yes, that’s a massive increase, but to be fair, it should be contrasted with economic and tax revenue growth. Sadly, even considering GDP and tax revenue, its growth rate is obscene.
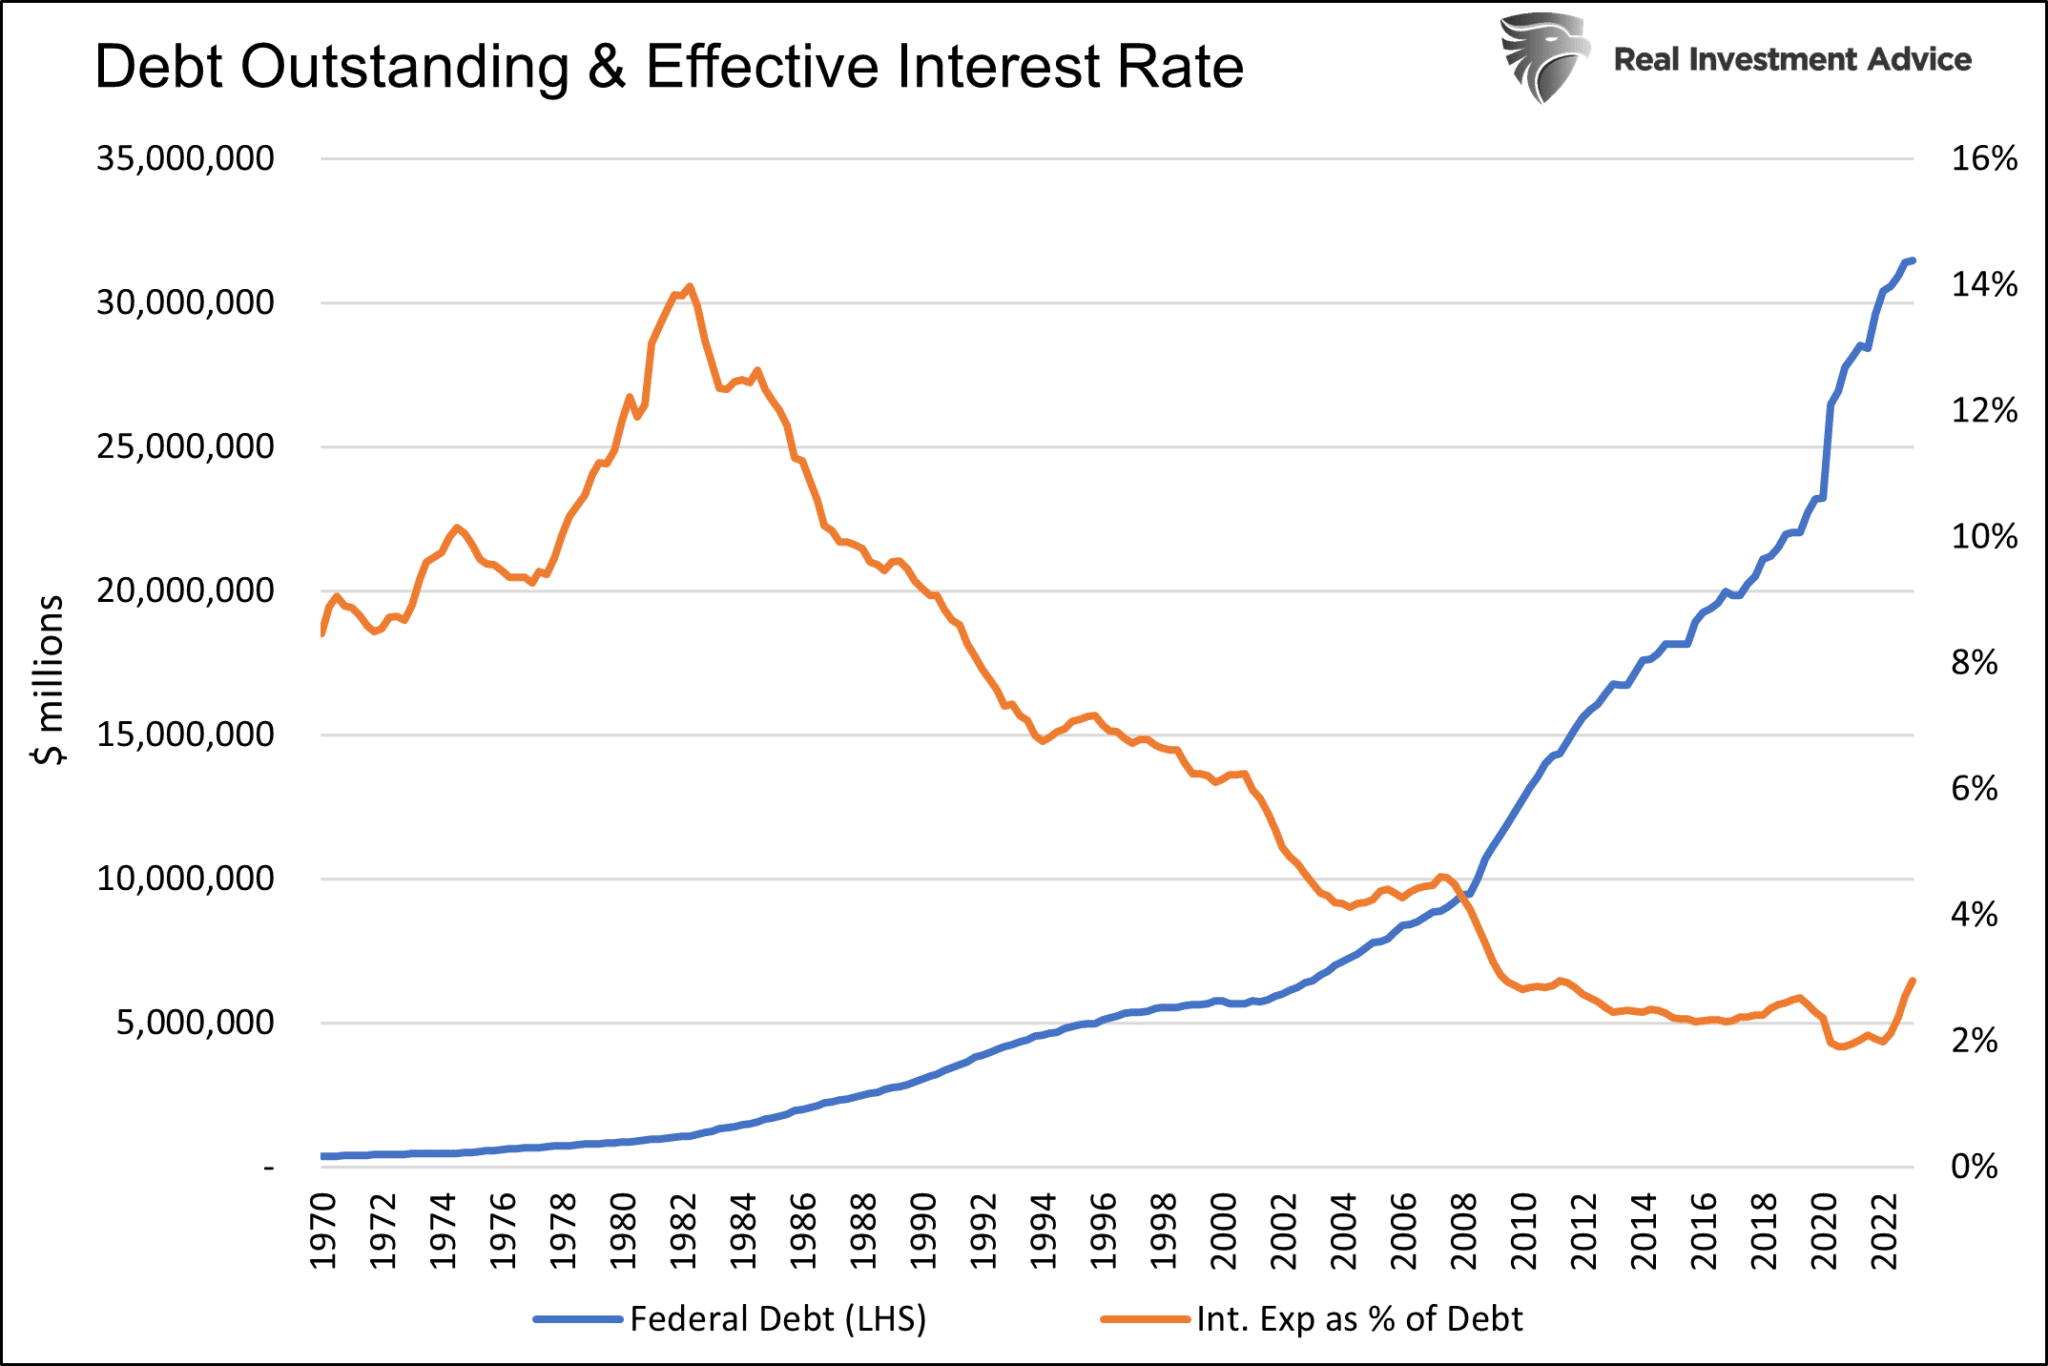
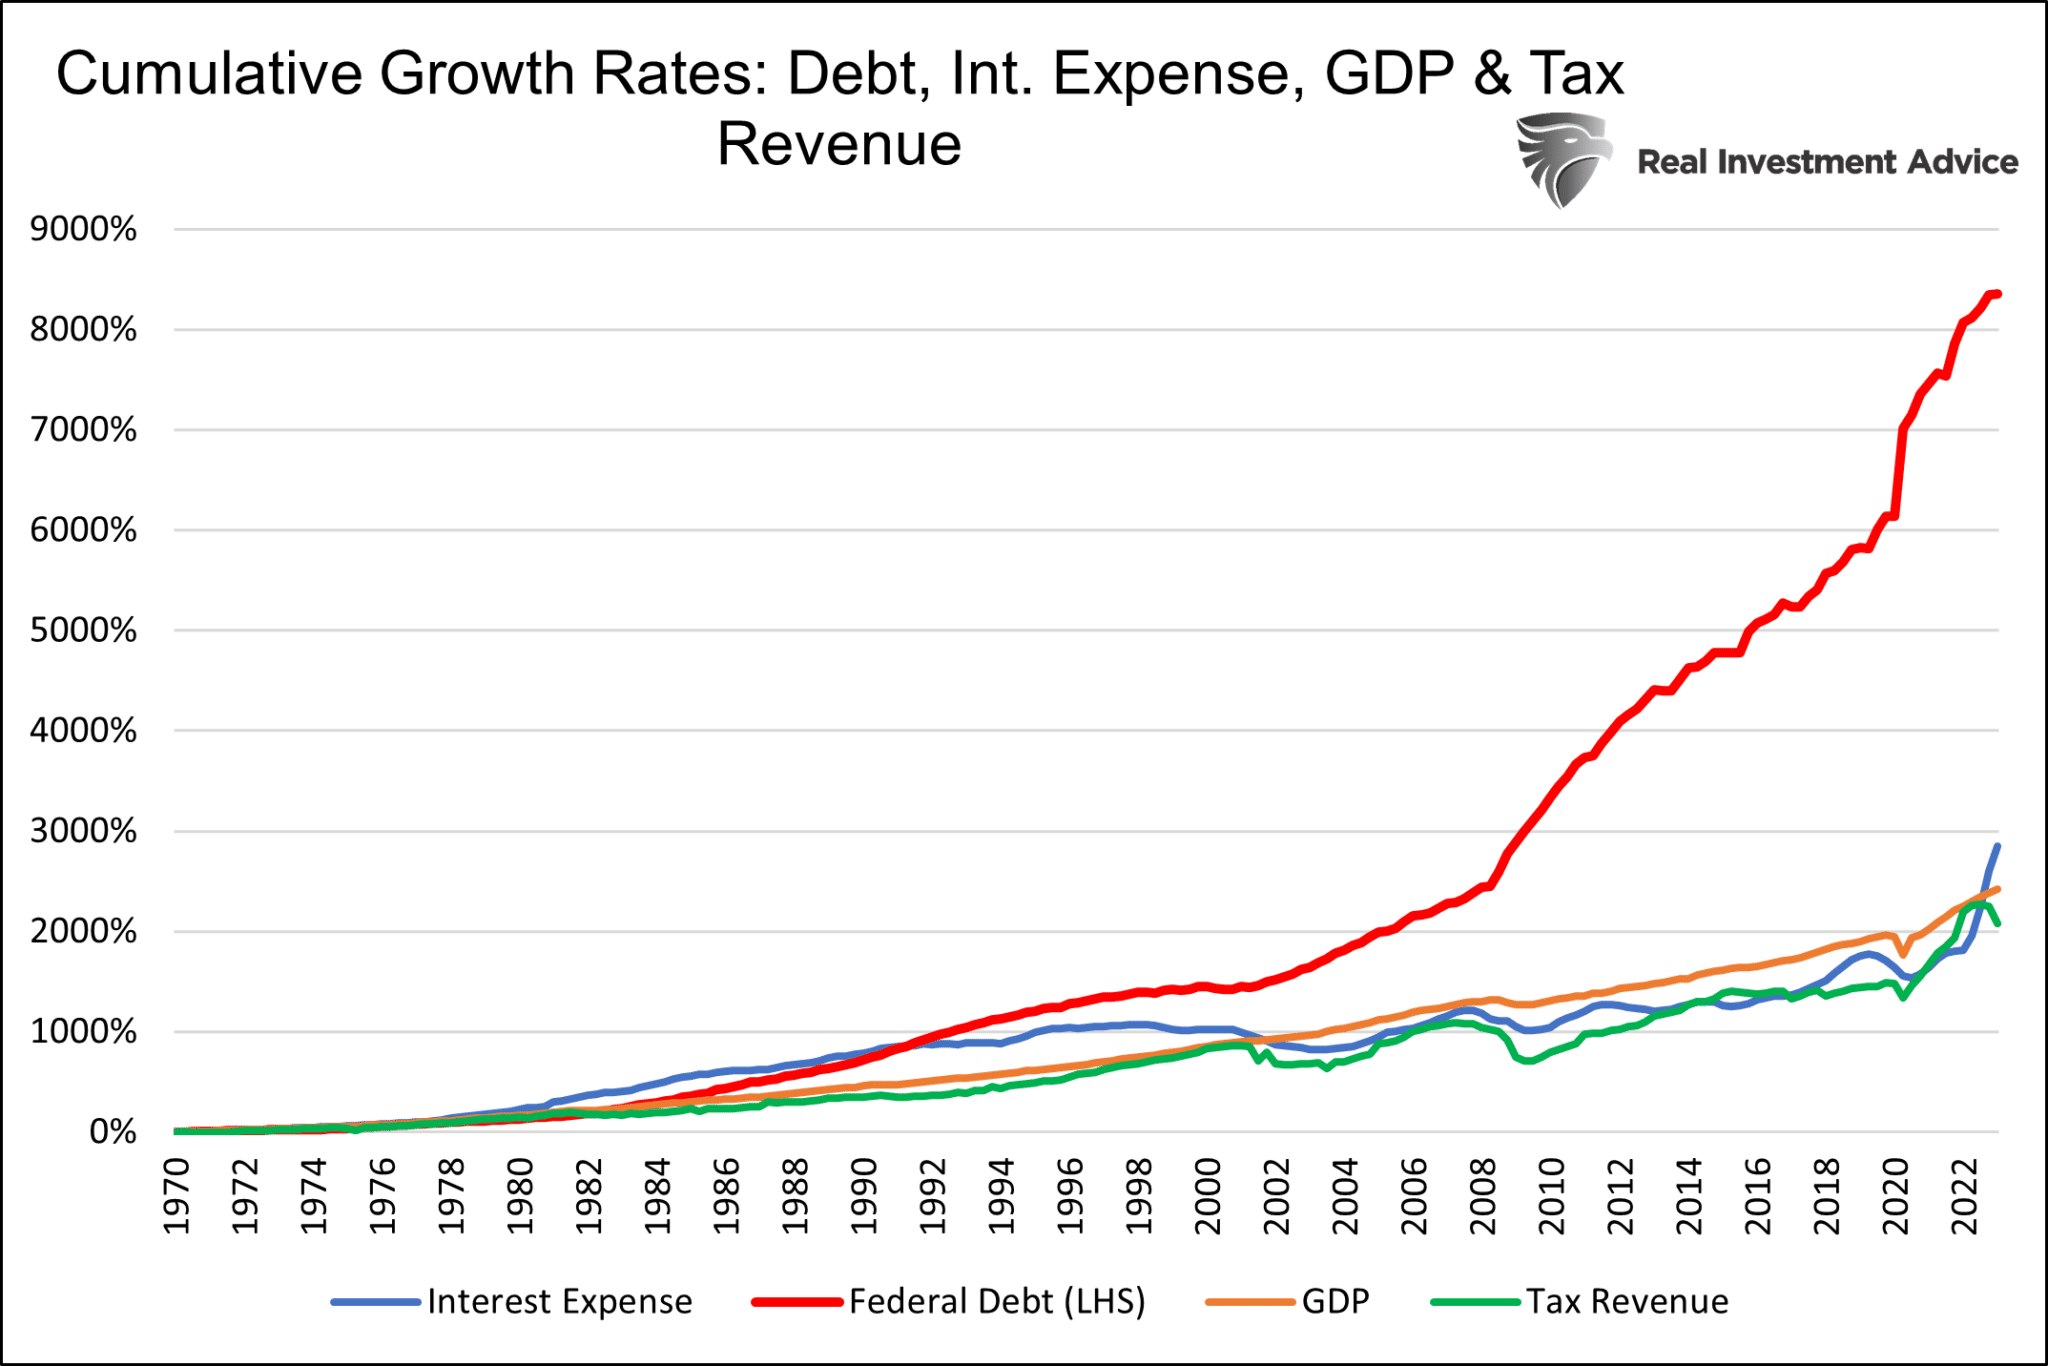
Since 1970, federal debt has grown at four times the rate of GDP. Worse, tax revenue grew even less than GDP. Lower interest rates helped bridge the significant spending vs. income gap. Since 1970, the effective Federal interest rate has shrunk from 8.5% to 3%. Consequently, the massively expanding debt load was “affordable.”
The debt scheme has worked, but the recent surge in interest rates presents an insurmountable roadblock if they remain at current levels. Paradoxically, it is also for this dire consequence that we are bullish on bonds.
The first graph shows the steep decline in the effective Federal interest rate and the sharp increase in debt outstanding.
The following graph shows debt grew four times faster than interest expenses, GDP, and tax revenues.
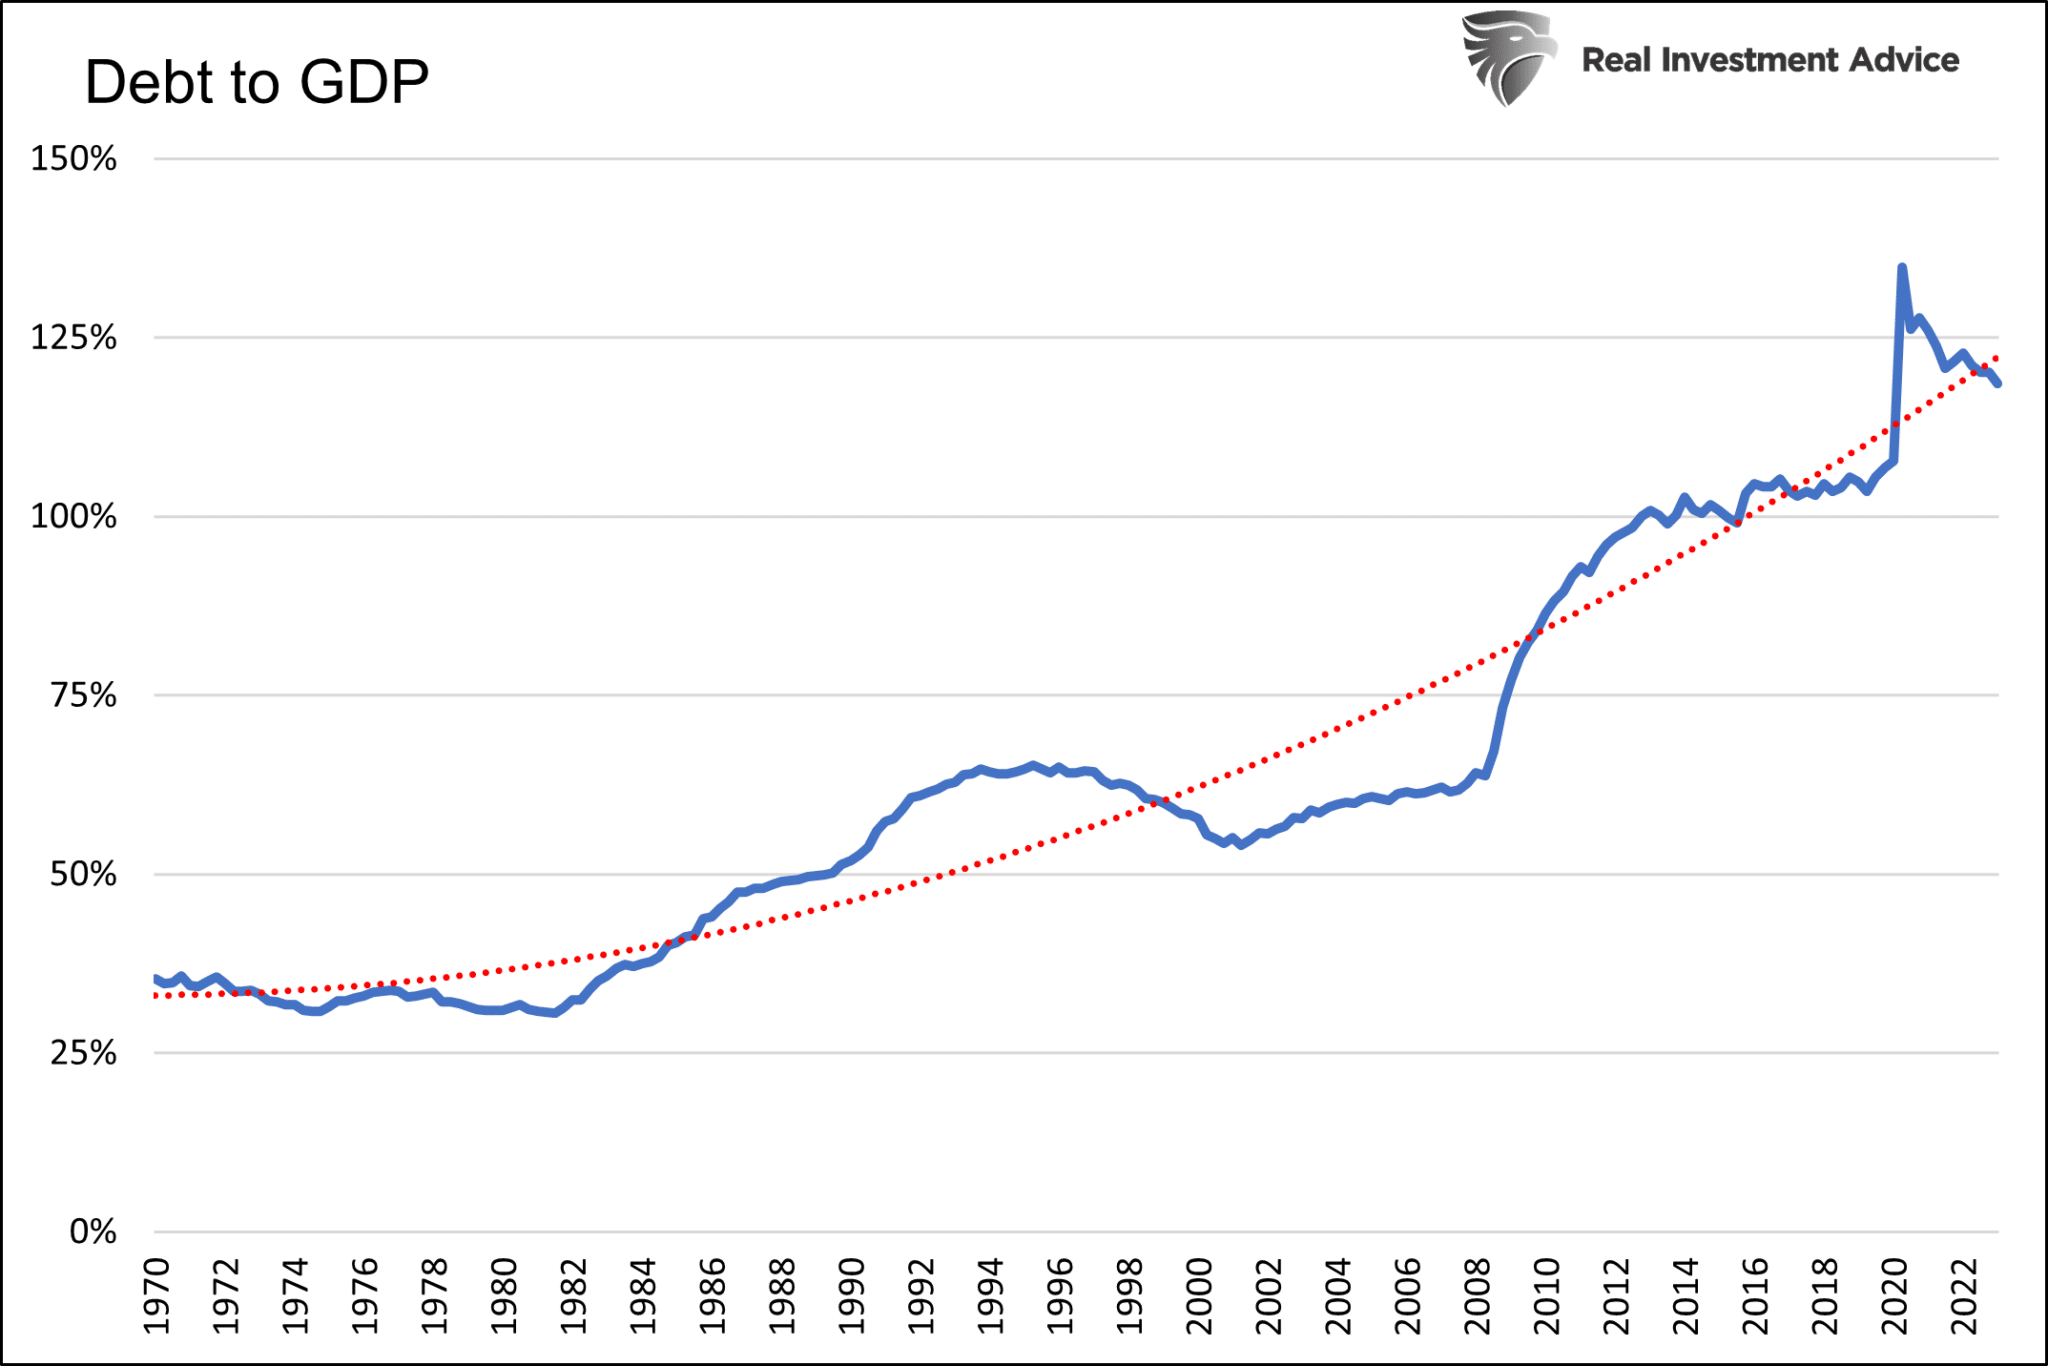
Finally, because of consistently borrowing more than its revenues, the ratio of government debt to GDP is around 120% and trending higher.
Rolling Over Debt is Costly.
Since interest rates started rising rapidly in early 2022, the effective federal interest rate has risen by a full percent. Debt over the same period increased by $1.8 trillion, and the interest expense rose by $328 billion. Of the $328 billion, only about $50 billion was due to new debt issuance. The remainder is a function of the Treasury having to fund maturing debt by issuing new debt at higher interest rates than the old debt.
In just the first half of the year, SIFMA calculates the Treasury has issued $9.9 trillion in new debt. At the same time, the federal debt grew by slightly more than $1 trillion. $8.9 trillion of new debt replaced old debt.
Some new debt replaces older debt with very low coupon rates. New debt is also replacing maturing Treasury bill issuance that may have rates close to today’s rates. Lastly, some of the new debt replacing debt issued way back may be done at a lower interest rate.
There are many moving pieces. Consequently, it’s not as easy as you think to forecast how rising interest rates affect interest expense. That said, let’s give it a shot.

Forecasting The Next 12 Months
The following analysis helps quantify how debt issuance to fund new spending and the refunding of maturing debt affects federal interest expenses. To approximate the impact, we make the following assumptions:
- Assume the maturity for coming debt issuance will match the profile of the existing outstanding debt.
- Since nonmarketable debt has no yield or maturity, representing roughly a quarter of the government’s debt, we assume proportionate changes in their interest expense as marketable debt.
- The budget deficit, therefore, new funding requirements, will be $1.8 trillion.
- All data is courtesy of the Treasury Department as of the end of June 2023.
- Rolling over TIPs debt has no impact, as yields are a function of inflation.
- All floating rate bonds are reset every three months.
The table below breaks down the debt by type (marketable or nonmarketable) and security class. The columns on the right approximate the additional expense of the debt. The second to last column is the new interest expense due to the debt required to fund the deficit. The final column calculates the additional interest expense tied to the rollover and replacement of maturing debt. We calculate the amount by multiplying the amount of debt by the difference between the existing and current interest rates.
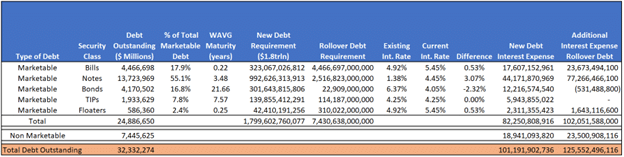
Total federal interest expenses should rise by approximately $226 billion over the next twelve months to over $1.15 trillion. For context, from the second quarter of 2010 to the end of 2021, when interest rates were near zero, the interest expense rose by $240 billion in aggregate. More stunningly, the interest expense has increased more in the last three years than in the fifty years prior.

Summary
The math above is not sustainable at current interest rates. However, at pre-2022 interest rates, interest expenses are not too demanding. What’s the Government, via the Treasury and Fed, to do?
The answer is simple. The Fed must extinguish inflation now and do everything it can to ensure rates return to the near-zero levels of yesteryear. Such buys time for the Treasury to issue debt at a faster growth rate than the economy is growing. “Buys time” is the crucial phrasing from the prior sentence. The scheme is unsustainable and requires increasingly lower interest rates and more QE. At some point, however, zero rates will not be low enough. Unfortunately, most government leaders prefer to push that problem off to the future and let the debt scheme blow up on someone else’s watch.
As such, we think the Feds mantra will change shortly to lower for longer!

