Inside This Week’s Bull Bear Report
- Share Repurchases End The Correction
- How We Are Trading It
- Research Report – Economic Growth Myth & The Rise Of Socialism
- Youtube – Before The Bell
- Market Statistics
- Stock Screens
- Portfolio Trades This Week
Markets Roar Back
As noted last week, events like the “Yen Carry Trade” blow-up are temporary and rarely devolve into more extreme market corrections. However, there is always that risk, so we suggested rebalancing portfolio risk as needed. As we will discuss today, the good news is that the 5-10% correction we warned about in June and July is likely complete.
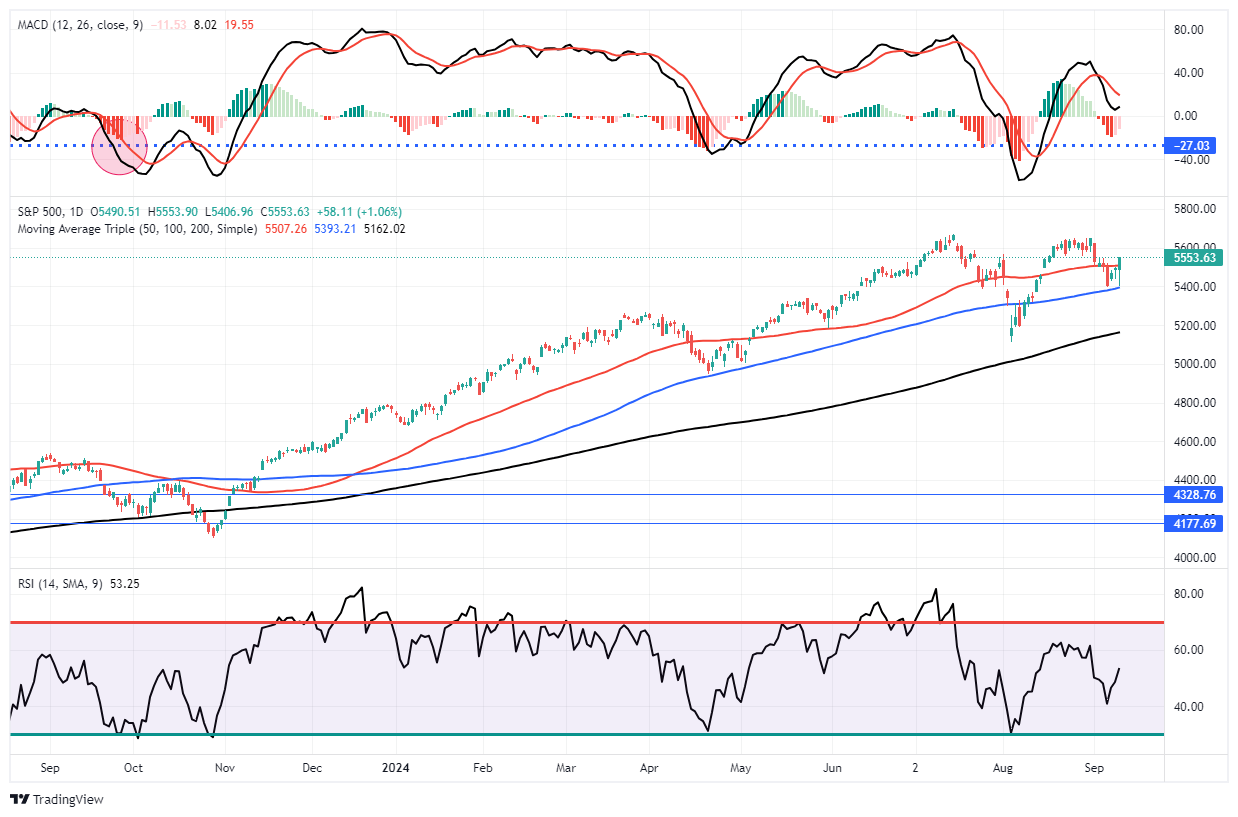
However, with that said, the rally from the lows of two weeks ago has been rapid and has some good and bad elements. Starting with the positive, the rally from the lows reversed the MACD “sell signal,” suggesting the bullish bias has returned. Furthermore, the rally cleared all-important resistance levels with ease. The market quickly crossed the 100, 50, and 20 DMAs, leaving only recent all-time highs as significant next resistance.
The only negative to the advance is the nearly complete reversal of the previous oversold conditions. Such isn’t a critical issue, but it suggests we will likely see a minor pullback to retest support at the 50-DMA. Such will provide a better entry point to add exposure as needed.
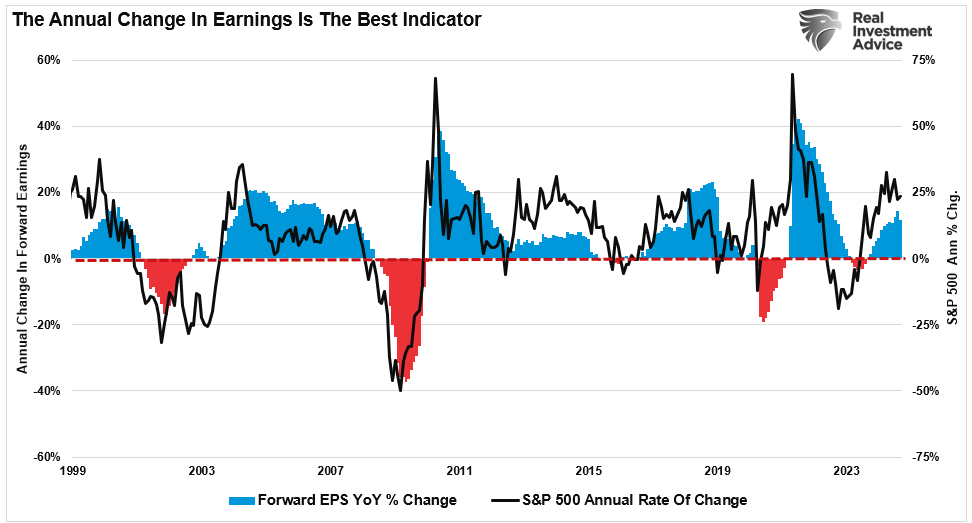
This week’s economic reports from PPI and CPI to retail sales help boost the market’s confidence that while the economy is slowing down, it is not recessionary. A “soft landing,” if the Federal Reserve can navigate one, would suggest that stable economic growth rates could support current earnings estimates. However, as history suggests, such optimistic outlooks rarely come to fruition, but that is a challenge the markets will face later this year and into 2025.
For now, as discussed last Monday, the “Mega-Caps,” which the media declared dead, has led the charge higher. As we will discuss in more detail today, one of the primary reasons for that is the return of share repurchases.
Need Help With Your Investing Strategy?
Are you looking for complete financial, insurance, and estate planning? Need a risk-managed portfolio management strategy to grow and protect your savings? Whatever your needs are, we are here to help.

Is The Correction Over?
As discussed previously, market corrections are common in any given year. To wit:
“During bullish years, corrections happen more often than you think. When corrections occur, it is not uncommon to see concerns about a “bear market” rise. However, historically speaking, the stock market increases about 73% of the time. The other 27% of the time, market corrections reverse the excesses of the previous advance. However, these are full-year returns, and during any given market year, intra-year declines of 5-10% are common.”

However, historically speaking, there have been a few years where an unexpected, exogenous event has shocked market participants with a sharp price decline. Such was a point we discussed in last week’s newsletter:
“The crash of 1987 resulted from the failure of “portfolio insurance.” The decline in 2011 was due to an earthquake that sparked a tsunami, flooding Japan and shuttering essential exports. In late 2015, the market moved sharply lower as Janet Yellen discussed tapering monetary support. The market crash in 2018 resulted from an unexpected statement by the Federal Reserve that interest rates were “nowhere near the neutral rate,” suggesting further rate increases.”
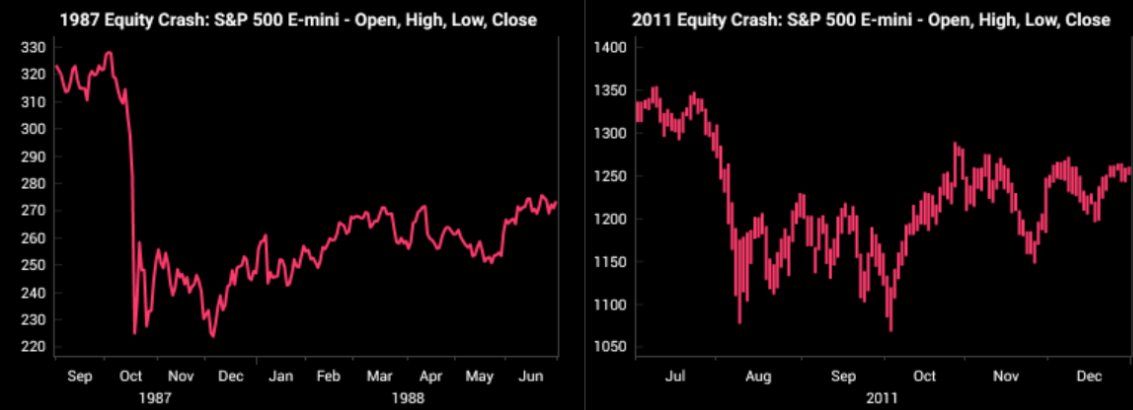
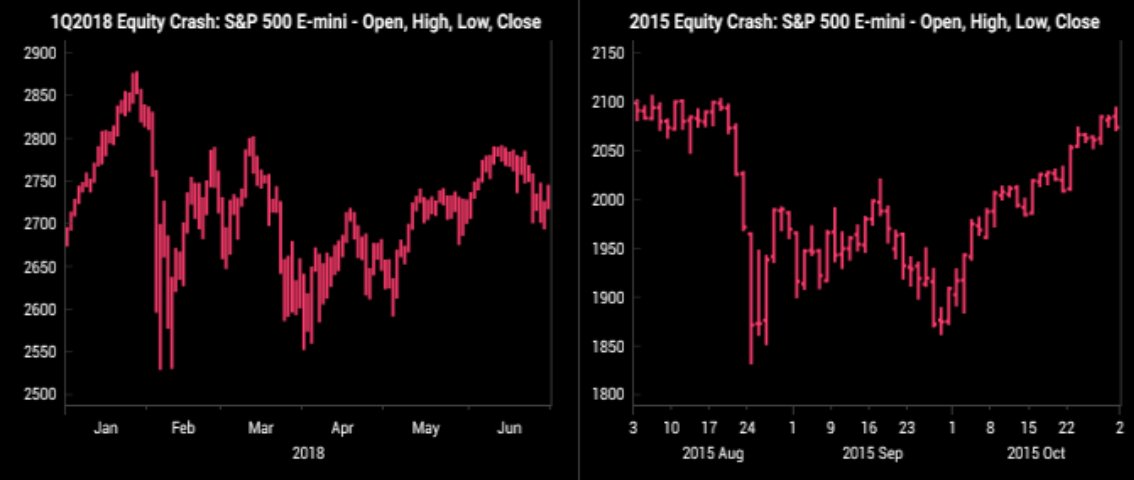
The recent market event caused by the reversal of the “Yen Carry Trade” had many of the same hallmarks as these past events:
- An unexpected, exogenous event causes sellers to swamp buyers in a “rush for the exits.”
- The market price moves sharply lower to find “buyers” at substantially lower prices.
- The market bounces as buyers step in to buy at reduced prices.
- The initial market rally fails, prices revert to previous lows, and investors’ sentiment becomes bearish.
- Buyers return to meet sellers at lower prices, ending the corrective period.
Following that event, buyers quickly returned to the market, surprising many who thought a much larger correction process was in the works.
That is because the four main drivers will still support the markets soon.
4-Drivers Of The Market
While there were many bearish headlines over the last two weeks, a common occurrence during corrective events, the markets remain supported by four primary factors.
The first is liquidity. Over the last decade, liquidity has become an essential driver of increasing asset prices. Rounds of quantitative easing, zero interest rates, and changes to bank reserves have helped support financial markets. One measure of liquidity we track is the change to the Federal Reserve’s balance sheet, less the changes to the Treasury General Account and the Revers Repo Facility.
The recent market decline coincided with a fairly sharp drop in that liquidity index. However, as the market was impacted, liquidity reversed, supporting the recent rally.

Secondly, hedge funds and professional investors stepped in to “buy the dip” despite the unexpected market shock. As shown, while hedge funds were selling to retail investors for three weeks before the “event,” they were buying from panicked retail investors during the decline. Such was a point made by BofA this week:
“Last week, during which the S&P 500 was essentially flat, BofA Securities clients were net buyers of US equities (+$5.8B) for the first time in five weeks (10th-largest inflow in history since ’08).”
As shown, professional investors were buying quality stocks during the decline.
Unsurprisingly, retail investors tend to be on the wrong side of the trade as they get swept up in headlines and allow emotions to dictate their actions.
Third, pension funds will need to start buying roughly $40 billion a week into September to balance their portfolios for the end of the quarter. With many pension managers underweight large capitalization equities, particularly the “Magnificent 7,“ rebalancing their portfolios will support the markets.
Lastly, and probably the most important, as it has been since 2000, remains share repurchases.
Share Repurchases Remain Key
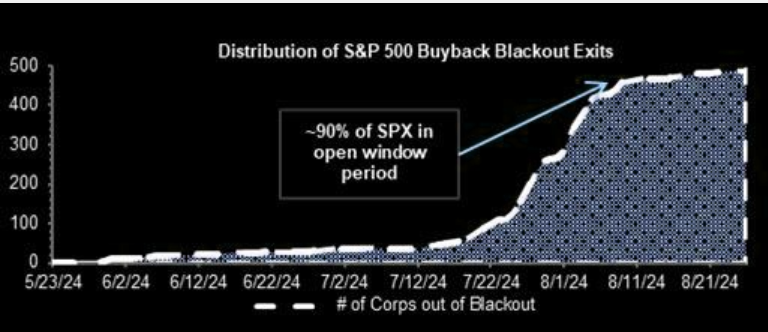
With the Q2 earnings season behind us, the “blackout” window for buybacks has reopened.
Those buybacks are essential because they continue to provide a bulk of the net purchases of equities in the open market. It was also a very active week for new repurchase authorizations, with 38 new programs authorized for $15.1 Billion.

Importantly, as I noted in Tuesday’s blog post, there is a high correlation between the annual change in buybacks and the market.
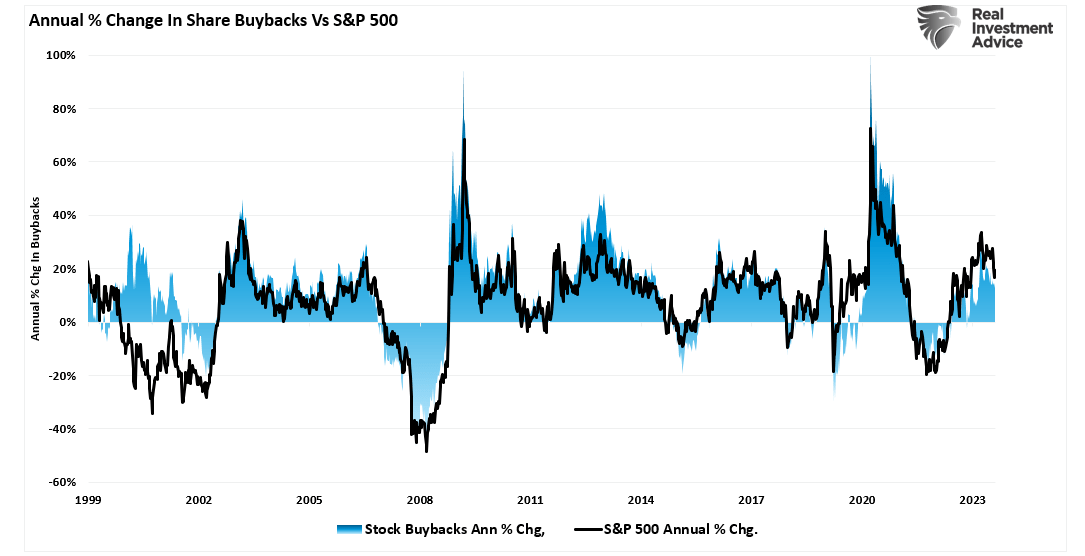
The surge of share repurchases remained an essential support for stocks in the near term and was the main reason the correction ended abruptly. Such is particularly the case given the low liquidity of the overall market. As noted by Goldman Sachs:
“S&P 500 top book liquidity is currently at $5M. This is down from $26M in July. This is a decline in the worlds equity liquidity instrument of-80% in the last 3 weeks. Top book liquidity hit $3M on Monday, the lowest level since March 2023 (15 months). ETFs represented 43% of the overall market volume on Monday compared to 29% YTD.”

At roughly $5 billion per day in executions, combined with currently low market liquidity, the corporate bid supported markets, sending markets quickly out of correction territory. Furthermore, August- September is the second-best period of the year, with companies completing 20.7% of all executions supporting higher asset prices.
However, that is just for the next month. The share repurchase window begins to close again on September 5th, which brings us to how we are trading the market heading into the election.
How We Are Trading It
While there are some concerns over the recent market decline, share repurchases supported the recovery rally. However, this does not mean “no risk” of another decline heading into the election.
With the polls now very tight between Trump and Harris, the potential for managers to “de-risk” portfolios remains elevated, given the uncertainty of outcomes. Furthermore, that potential “de-risking” process will coincide with the October blackout period for share repurchases, removing another supportive buyer of equities. That combination could set up a likely “flash point” for volatility before the November election.
We remain underweight equities and overweight cash in the near term with our core Treasury bond holdings intact to hedge against a sharp increase in volatility. That positioning is unlikely to change over the next two months, and we are willing to sacrifice some performance in exchange for control over risk.
While we have discussed these simplistic rules over the last several weeks, we continue to reiterate the need to rebalance risk if you have an allocation to equities.
- Tighten up stop-loss levels to current support levels for each position.
- Hedge portfolios against significant market declines.
- Take profits in positions that have been big winners
- Sell laggards and losers
- Raise cash and rebalance portfolios to target weightings.
Keep moves small for now. As the markets confirm their next direction, we can continue adjusting accordingly.
Have a great week.
Research Report

Subscribe To “Before The Bell” For Daily Trading Updates
We have set up a separate channel JUST for our short daily market updates. Please subscribe to THIS CHANNEL to receive daily notifications before the market opens.
Click Here And Then Click The SUBSCRIBE Button
Subscribe To Our YouTube Channel To Get Notified Of All Our Videos
Bull Bear Report Market Statistics & Screens

SimpleVisor Top & Bottom Performers By Sector

S&P 500 Weekly Tear Sheet

Relative Performance Analysis
The snap-back rally over the last two weeks was inspiring as the 5-10% summer correction occurred without significant damage. With that correction behind us, the subsequent market event risk will be the November election. With most markets and sectors back to overbought, look for minor corrections to support. I would be unsurprised to see some selling hit the markets next week. However, investors can use pullbacks opportunistically to increase risk exposures to rebalance portfolios.

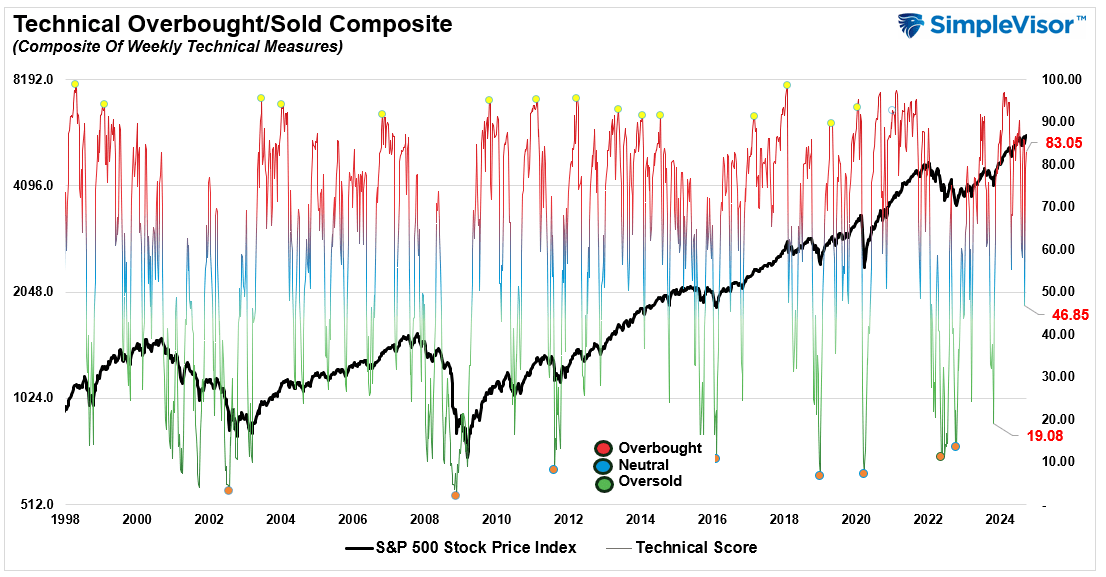
Technical Composite
The technical overbought/sold gauge comprises several price indicators (R.S.I., Williams %R, etc.), measured using “weekly” closing price data. Readings above “80” are considered overbought, and below “20” are oversold. The market peaks when those readings are 80 or above, suggesting prudent profit-taking and risk management. The best buying opportunities exist when those readings are 20 or below.
The current reading is 79.79 out of a possible 100.
Portfolio Positioning “Fear / Greed” Gauge
The “Fear/Greed” gauge is how individual and professional investors are “positioning” themselves in the market based on their equity exposure. From a contrarian position, the higher the allocation to equities, the more likely the market is closer to a correction than not. The gauge uses weekly closing data.
NOTE: The Fear/Greed Index measures risk from 0 to 100. It is a rarity that it reaches levels above 90. The current reading is 58.39 out of a possible 100.

Relative Sector Analysis
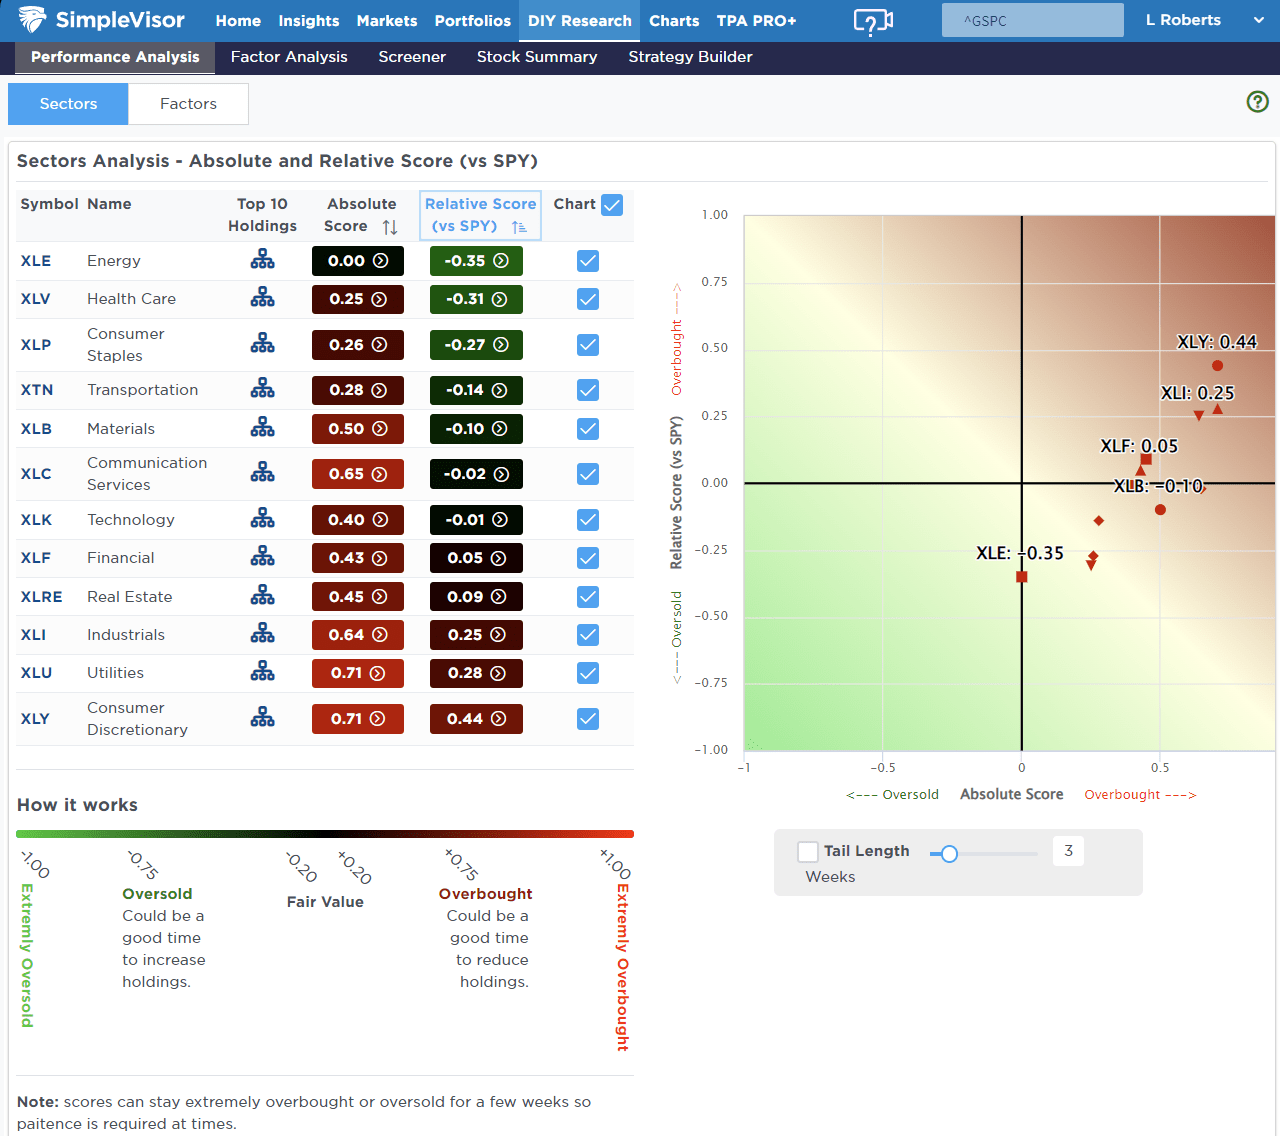
Most Oversold Sector Analysis

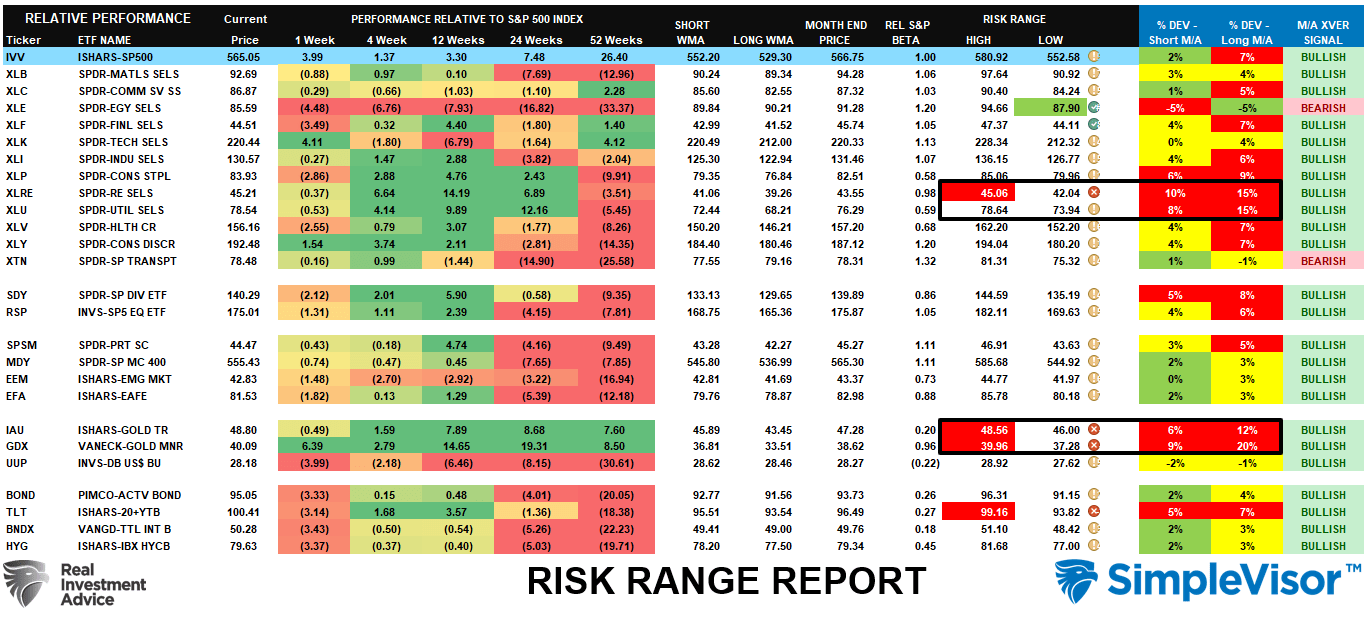
Sector Model Analysis & Risk Ranges
How To Read This Table
- The table compares the relative performance of each sector and market to the S&P 500 index.
- “MA XVER” (Moving Average Crossover) is determined by the short-term weekly moving average crossing positively or negatively with the long-term weekly moving average.
- The risk range is a function of the month-end closing price and the””bet”” of the sector or market. (Ranges reset on the 1st of each month)
- The table shows the price deviation above and below the weekly moving averages.
As stated last week:
“The previous overbought and extended conditions that existed three weeks ago have been reversed. That sets the market up for a decent rotational rally in the days ahead. Look for a rotation into decently oversold growth sectors with significant declines.”
Such was indeed the case this past week, with Technology leading the charge in the market recovery. Bonds remain very extended, so be patient for a better entry point to add exposure to fixed income. Transportation, as shown in the Most Oversold Sector Analysis, is the most oversold this week, along with Small Caps, which could see a bit of a catch-up trade next week. The market is overbought short-term, so minor corrections should be considered to increase exposures as needed.
Weekly SimpleVisor Stock Screens
We provide three stock screens each week from SimpleVisor.
This week, we are searching for the Top 20:
- Relative Strength Stocks
- Momentum Stocks
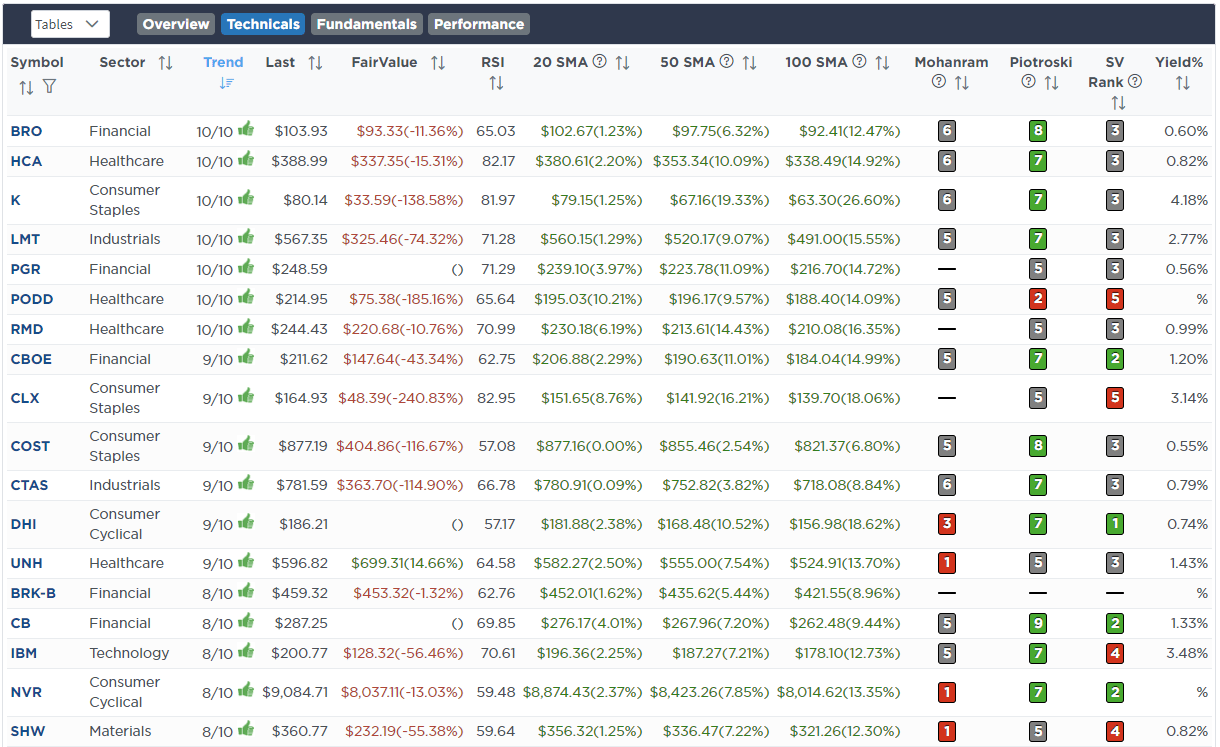
- Fundamental & Technical Strength W/ Dividends
(Click Images To Enlarge)
RSI Screen
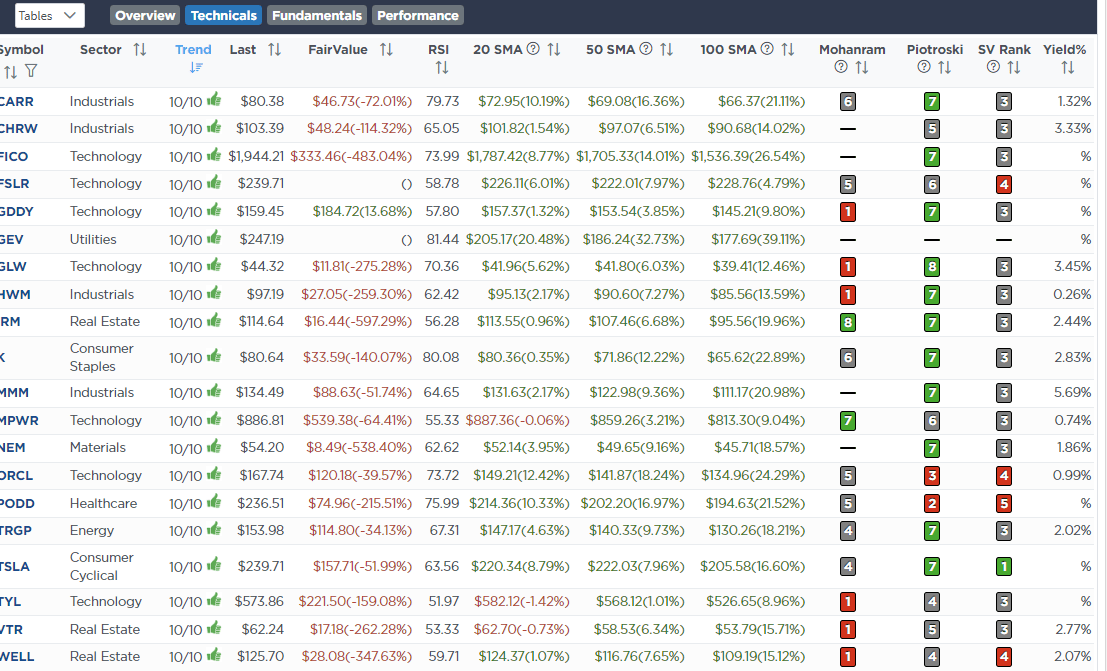
Momentum Screen
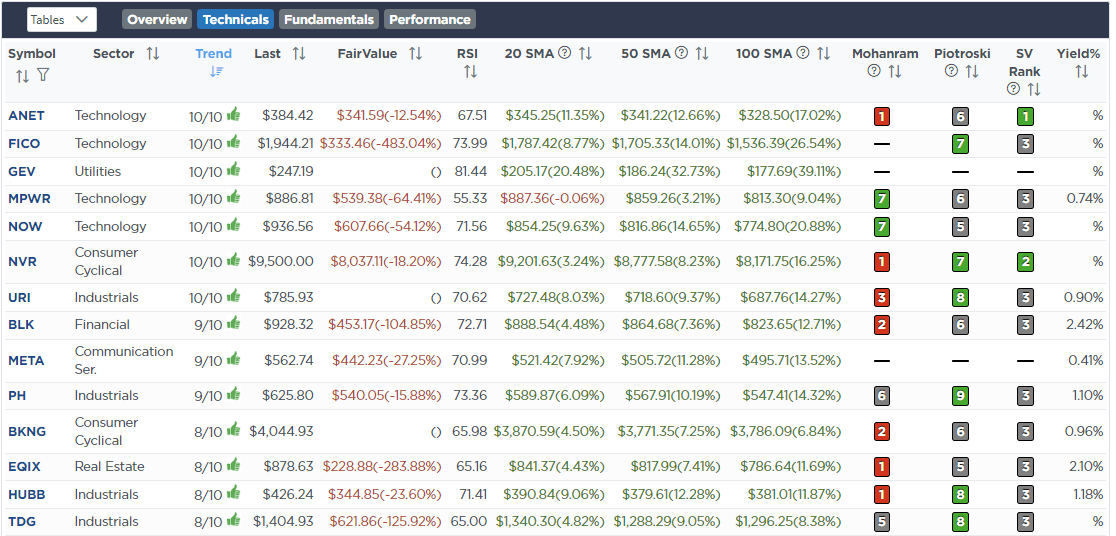
Fundamental & Technical Screen
SimpleVisor Portfolio Changes
We post all of our portfolio changes as they occur at SimpleVisor:
August 13th
“In recent months, Philip Morris International (PM) has had a huge run and is up 27% in the portfolio. With the stock extremely overbought and deviating from long-term means, we will take the gains and look for a suitable replacement. With most dividend stocks very overbought, we will likely need a correction or general market rotation to provide a better entry point. We will be patient here in the short term.”
Dividend Equity Model
- Sell 100% of PM
August 16th
“This morning, we reduced our exposure to energy slightly. Increased chances of a pact between Israel and Hammas/Hezbollah are pressuring crude prices, as are signs of economic weakening. Furthermore, oil prices have historically declined during Fed rate-cutting cycles as those cuts are in response to economic weakness.
However, despite reducing exposure, we remain slightly above the S&P target weights in both models. There is a large short position in crude oil, one reason we are reluctant to reduce further.“
Equity Model
- Reduce Exxon Mobil (XOM) and Diamond Back Drilling (FANG) to 1.5% of the portfolio.
ETF Model
- Reduce the SPDR Energy Sector ETF (XLE) to 4.5% of the portfolio.

Lance Roberts, C.I.O.
Have a great week!

