
Tuesday’s weak Consumer Confidence report was a good reminder of why some economists are calling our economy the K shaped economy. The Conference Board Consumer Confidence Index fell 6.8 points to 88.7 in November, below expectations of 93. Moreover, it sits at levels similar to those of early 2020, when the pandemic shuttered the economy. Similarly, the University of Michigan Consumer Sentiment survey is slightly above 70-year lows. Both surveys indicate that a large majority of consumers are struggling. Within the surveys, the outlook on current jobs and job availability is low. Inflation, tariffs, politics, and the government shutdown are also weighing on the consumer and limiting big-ticket spending plans.
A K shaped economy describes a post-crisis recovery where different parts of the economy and society are performing at sharply diverging rates, forming the two arms of the letter “K.”:
- The upper arm (going up): Sectors, companies, assets, and people that benefit from the recovery and, in many cases, are wealthier than before the pandemic. This includes investors in technology stocks, big tech companies, the luxury sectors, high-income professionals, and asset owners.
- The lower arm (going down): Sectors, small businesses, and people that continue to decline or stagnate even as the overall economy appears to improve. Examples include: the hospitality and travel industries, many lower-priced retail outlets, low-wage service workers, small businesses, and many middle-class and lower-income households.
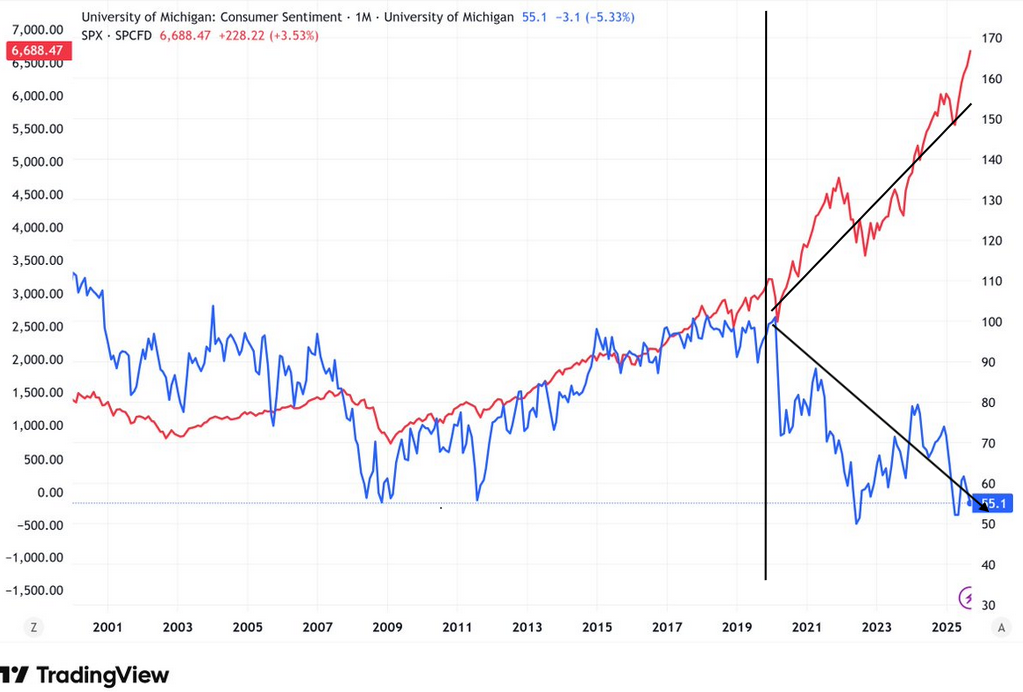
The graph below showing the stark divergence between the S&P 500 and the University of Michigan consumer survey best depicts the K shaped economy. You can make similar K shaped plots comparing stock markets, GDP, and megacap corporate profits versus small business closures, wage growth for low-income workers, and economic activity in the manufacturing sector.
What To Watch Today
Earnings
- No notable releases today.
Economy
- No notable releases today.
Market Trading Update
If you missed our previous market commentary, we posted links to our two investment guides to help make you a better investor. They are formatted in a printable PDF version for easier reading and keeping on your desk as a steady reminder when “emotions” start to get the better of you.
The reason I bring that up is that over the previous couple of weeks, as the market, bitcoin, and AI stocks declined, the media was filled with headlines about the “death of the AI trade” and a range of other bearish headlines. As we noted then, the correction was part of a normal process following one of the most substantial six-month advances we had seen in the markets over the last decade. However, when corrections occur, they tend to get the better of our emotions, and we make mistakes.
However, as we discussed in last weekend’s #BullBearReport:
“Heading into December, the seasonal tailwinds remain intact, as noted above. December is historically the best month for equities, with the “Santa Claus rally” often delivering average gains of 1.5% to 2.0%. With corporate buybacks in full swing, adding $5-6 billion in daily volume, investor positioning remaining stable, and professional managers underweight in exposure, particularly in technology companies, the fuel for a rally is present. However, the market also remains fragile due to poor underlying breadth and rising volatility, so caution is advised.”
As shown, this past week has followed seasonal strength trends, with money flowing back into technology.

As I noted previously, if you are not reading the weekly #BullBearReport, you are missing some critical analysis for your trading. For example, we noted last week that:
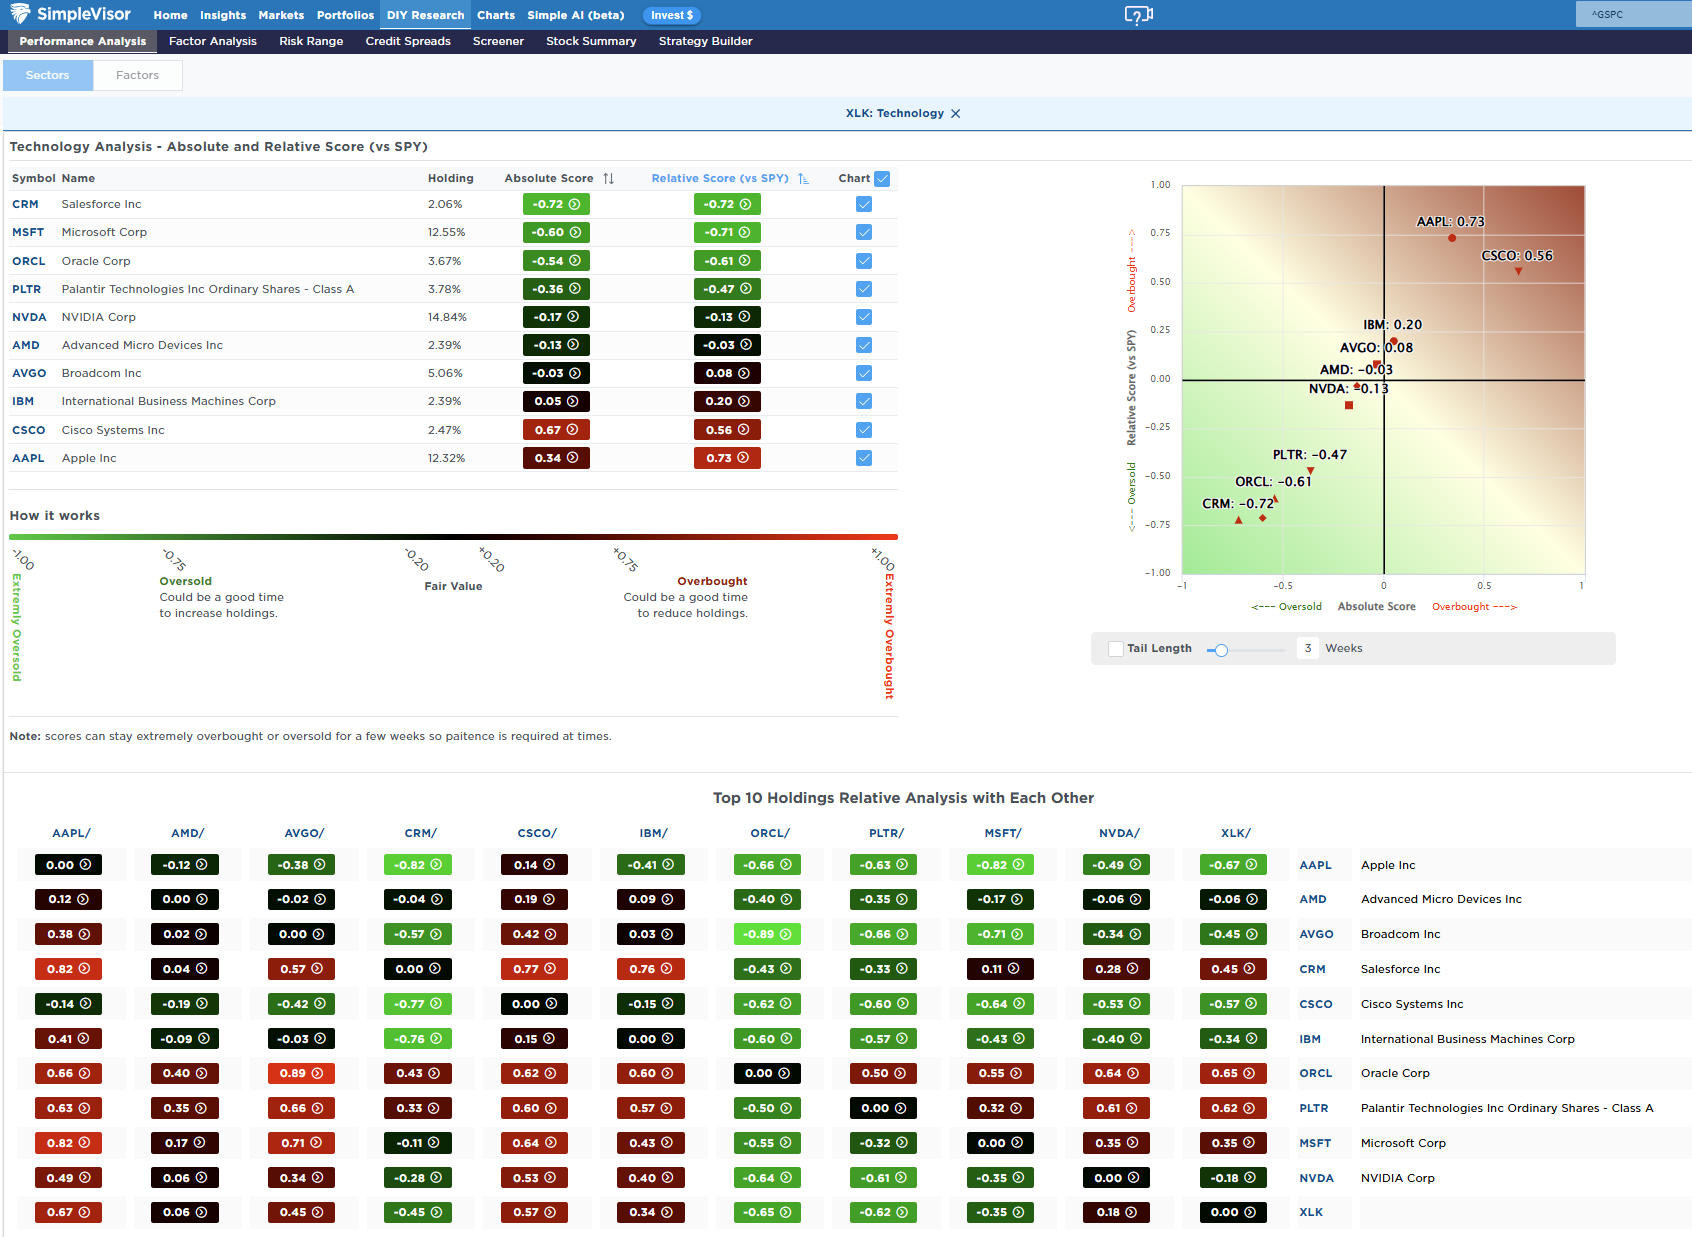
“As noted, Technology has reversed much of its previous overbought condition with the recent correction. Within the top 10 holdings of the sector, CRM, MSFT, ORCL, PLTR, and NVDA are the most oversold, suggesting we could see some buying enter these stocks next week.”
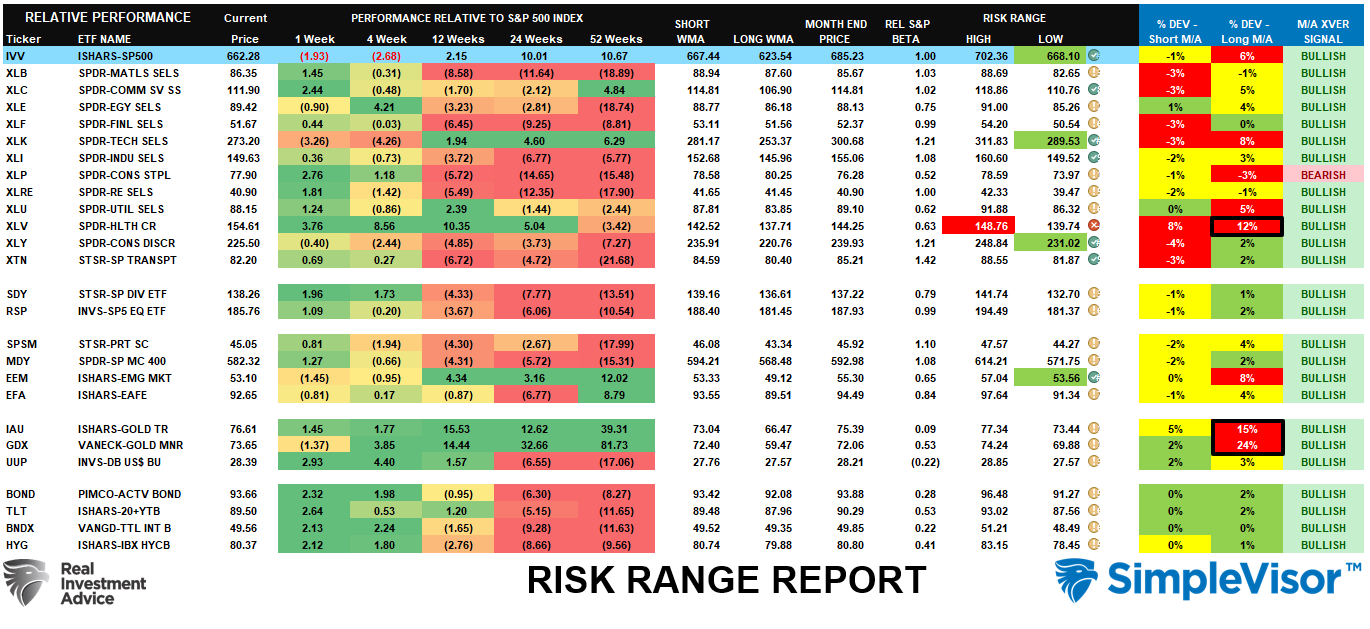
Furthermore, the RIsk Range Model also suggests the same:
“Three weeks ago, we started warning that many sectors were exceedingly above their long-term means, and a correction was likely to reverse those conditions. The correction this past week significantly reduced some of those larger deviations, except for gold and gold miners. Notably, healthcare, which was previously oversold, benefited from the risk-off rotation and is now overbought, 12% above its long-term mean. Take profits and look for a rotation back into technology and discretionary stocks, in particular, which may receive a technical bounce this week given their respective short-term oversold conditions. The overall bullish backdrop continues to improve with every primary market and sector, save Staples, on a bullish moving average crossover.”
While the seasonal trends remain intact, suggesting a further recovery in the market, the first couple of weeks of December tend to be choppy as mutual funds distribute capital gains and income for the year. Any weakness before Christmas will set up the “Santa Rally” into year-end as managers “window dress” for year-end reporting.
Maintain some cash, buy weakness, and pay attention to market rotation.

Black Friday And Holiday Estimates
Black Friday kicks off a spending frenzy as consumers worldwide buy holiday gifts. Often, holiday sales, particularly Black Friday sales, can make or break the entire year. Given the weak consumer sentiment we outlined in the opening section, we thought it might be helpful to see a few estimates of what this year’s holiday season may have in store for consumption.
- Adobe Analytics: US online sales forecasted to reach $11.7 billion, marking an 8.3% year-over-year increase from 2024’s $10.8 billion record.
- National Retail Federation (NRF): Overall holiday spending for November and December is expected to exceed $1 trillion for the first time, driven by a projected 3.7% to 4.2% growth in total retail sales, slightly down from last year’s 4.8% surge.
- Deloitte: They anticipate a more modest 3% rise in sales amid consumer caution over high prices and tariffs
- Bain & Company: Predicts an outsized 11% increase specifically for the Black Friday weekend but a more restrained 4% holiday forecast. They expect shopper turnout to hit a record 186.9 million over the five-day Thanksgiving-to-Cyber Monday stretch, up from 183.4 million in 2024. Moreover, they suspect shoppers will be enticed with deeper discounts—averaging up to 28% off on electronics, toys, and appliances.
The graph below, courtesy of Bloomberg, shows a KPMG survey estimating the percentage of spending by broad product category.

Tweet of the Day

“Want to achieve better long-term success in managing your portfolio? Here are our 15-trading rules for managing market risks.”
Please subscribe to the daily commentary to receive these updates every morning before the opening bell.
If you found this blog useful, please send it to someone else, share it on social media, or contact us to set up a meeting.

